Methodenartikel

A Fourier Transform Infrared Spectroscopy Technique to Study Peptide Self-Assembly

1.9K weergaven

13 augustus 2025

In dit artikel

Samenvatting

Source: Neves, R., et al. Synthesis and Characterization of 1,2-Dithiolane Modified Self-Assembling Peptides. J. Vis. Exp. (2018)

This video demonstrates the self-assembly of amyloid peptides into a beta sheet-rich supramolecular structure using Fourier transform infrared spectroscopy. An infrared beam is passed through a crystal with a high refractive index, and energy absorption across the interface of the crystal and the sample is recorded. The secondary structures of the sample proteins are identified by analyzing their characteristic absorption peaks at specific regions of the infrared spectrum, which aids in identifying the formation of the supramolecular assembly.
Protocol

1. Characterization of Supramolecular Self-Assembly Structures

  1. Formation of Amyloid Fibers
    1. To prepare a self-assembly solution, weigh out 1 mg of the peptide powder using an analytical balance. Dissolve into a mixture (pH 7.5) of 20% acetonitrile and 10 mM (4-(2-hydroxyethyl)-1-piperazineethanesulfonic acid (HEPES) in a 1.5 mL microcentrifuge tube, to a final concentration of 1 mg/mL peptide assembly mixture. Vortex the assembly solution and leave it to assemble at room temperature.
  2. Spectroscopic Characterization of Amyloid Fibers
    1. Follow the peptide assembly process via Fourier-transform infrared (FTIR) spectroscopy every few days. A broad peak centered around 1670 cm-1 is the IR signature arising from unassembled peptides in the sample. The peptide assembly samples usually take one to two weeks for the broad unassembled peak to disappear and reach maturation.
      1. Dry an aliquot of 8-10 μL of the assembly solution as a thin film on the ATR diamond crystal. Monitor the disappearance of a large and broad water peak from 1640 to 1630 cm-1 as the dry film forms.
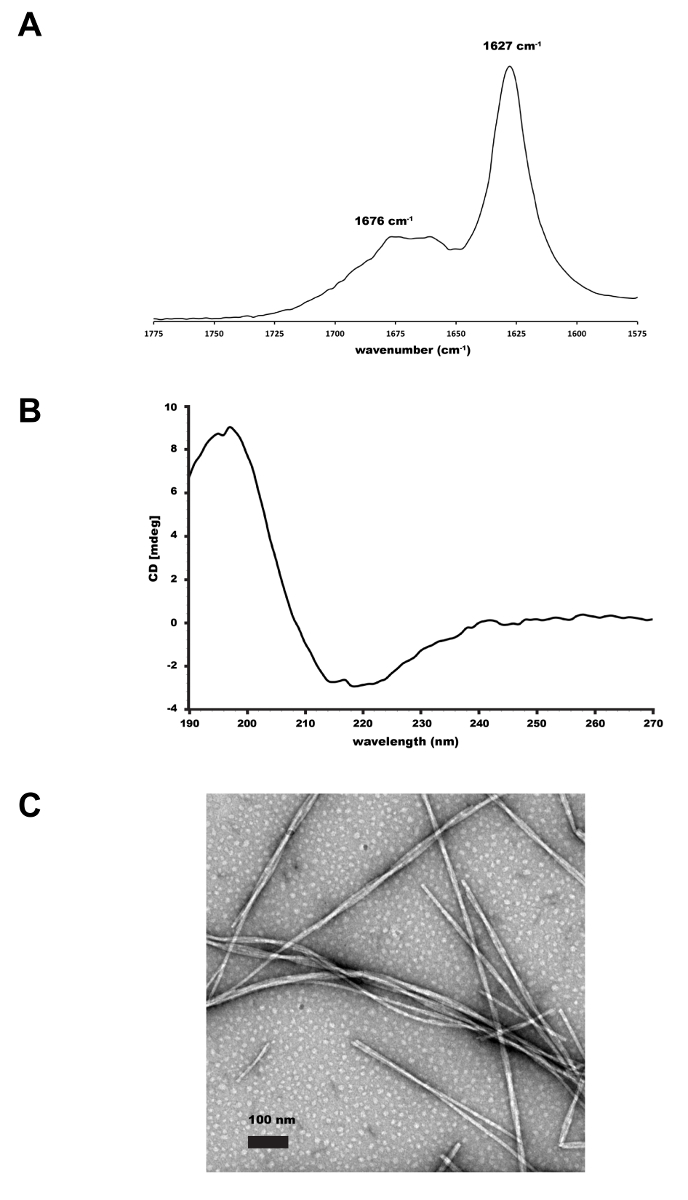
      2. Acquire IR spectra from 1500-1800 cm-1 averaging 50 scans with a 2 cm-1 resolution. Acquire and subtract the background scans prior to each sample scan. The IR signature for β-sheet assembly is a sharp peak between 1625 and 1635 cm-1 (Figure 1A).

Toegang beperkt. Log in of start een proefperiode om deze inhoud te bekijken.

Resultaten

FTIR spectra 1627/1676 cm⁻¹ (A), CD spectrum 190-270 nm (B), TEM nanofibers 100 nm scale (C).
Figure 1. Supramolecular characterization of 1,2-dithiolane modified peptide. (A) FT-IR of 1 mg/mL 1,2-dithiolane-KLVFFAQ-NH2 fibers assembled in 10mM HEPES, pH 7.5 in 20% CH3CN. The peak at 1627 cm-1 is consistent with the peptide...

Toegang beperkt. Log in of start een proefperiode om deze inhoud te bekijken.

Openbaarmakingen

No conflicts of interest declared.

Materialen

Lijst van materialen gebruikt in dit artikel
NaamBedrijfCatalogusnummerOpmerkingen
AcetonitrileFisher ScientificA998-4Flammable; irritating to eyes; Use personal protective equipment; Use only under a fume hood; keep away from open flame or hot surface; if contacted rinse wiith water for at least 15 minutes and obtain medical attention
4-(2-Hydroxyethyl)piperazine-1-ethanesulfonic acidAcros OrganicsAC172571000Do not inhale; use outdoors or in well-ventilated area
Fourier-Transform Infrared SpectrometerAlpha Tensor, Bruker

Herprints en machtigingen

Toestemming aanvragen om de tekst of afbeeldingen van dit JoVE-artikel te hergebruiken

Toestemming aanvragen

Trefwoorden

B tavoubladformatieATR kristalinfraroodspectrumanalyseevanescente golfgolfgetalmetingamylo de peptidensupramoleculaire structuuridentificatie van secundaire structuur

Gerelateerde artikelen