An erratum was issued for: High-Resolution Respirometry to Assess Mitochondrial Function in Human Spermatozoa. The Protocol and Representative Result sections were updated.
Erratum: High-Resolution Respirometry to Assess Mitochondrial Function in Human Spermatozoa
156 weergaven
⸱
26 september 2023
In dit artikel
Samenvatting
Samenvatting
An erratum was issued for: High-Resolution Respirometry to Assess Mitochondrial Function in Human Spermatozoa. The Protocol and Representative Result sections were updated.
Step 2.4.12 of the Protocol was updated from:
Finally, inject 1 µL of 5 mM antimycin A (2.5 µM final concentration). This is a complex II inhibitor to discriminate between the mitochondrial and residual oxygen consumption (non-mitochondrial respiration). For the analysis of complex I, add 1 µL of 1 mM rotenone (0.5 µM final concentration), an inhibitor of this complex, instead of AA. Measure the oxygen consumption until the signal decreases and stabilizes.
to:
Finally, inject 1 µL of 5 mM antimycin A (2.5 µM final concentration). This is a complex III inhibitor to discriminate between the mitochondrial and residual oxygen consumption (non-mitochondrial respiration). For the analysis of complex I, add 1 µL of 1 mM rotenone (0.5 µM final concentration), an inhibitor of this complex, instead of AA. Measure the oxygen consumption until the signal decreases and stabilizes.
Figure 3 in the Representative Results section was updated from:
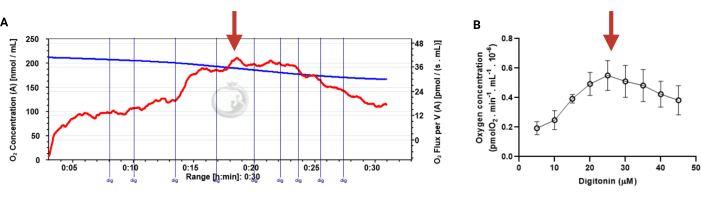
Figure 3: Determination of the optimal concentration of digitonin for the permeabilization of human sperm cells. The respiration rates were measured at 37 °C in MRM medium with glutamate, malate, and adenosine diphosphate. (A) Representative respiratory trace. The blue line is the O2 concentration, and the red line represents the O2 flow per volume correlated. (B) Mitochondria respiration rate means ± standard error, n = 4. The red arrow represents the optimal concentration. Abbreviation: dig = digitonin. Please click here to view a larger version of this figure.
to:
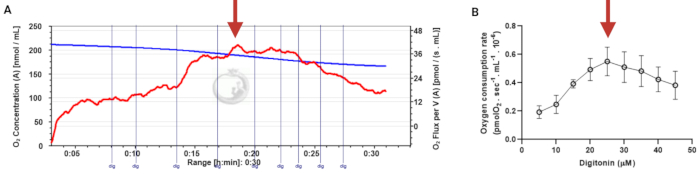
Figure 3: Determination of the optimal concentration of digitonin for the permeabilization of human sperm cells. The respiration rates were measured at 37 °C in MRM medium with glutamate, malate, and adenosine diphosphate. (A) Representative respiratory trace. The blue line is the O2 concentration, and the red line represents the O2 flow per volume correlated. (B) Mitochondria respiration rate means ± standard error, n = 4. The red arrow represents the optimal concentration. Abbreviation: dig = digitonin. Please click here to view a larger version of this figure.
Protocol
An erratum was issued for: High-Resolution Respirometry to Assess Mitochondrial Function in Human Spermatozoa. The Protocol and Representative Result sections were updated.
Step 2.4.12 of the Protocol was updated from:
Finally, inject 1 µL of 5 mM antimycin A (2.5 µM final concentration). This is a complex II inhibitor to discriminate between the mitochondrial and residual oxygen consumption (non-mitochondrial respiration). For the analysis of complex I, add 1 µL of 1 mM rotenone (0.5 µM final concentration), an inhibitor of this complex, instead of AA. Measure the oxygen consumption until the signal decreases and stabilizes.
to:
Finally, inject 1 µL of 5 mM antimycin A (2.5 µM final concentration). This is a complex III inhibitor to discriminate between the mitochondrial and residual oxygen consumption (non-mitochondrial respiration). For the analysis of complex I, add 1 µL of 1 mM rotenone (0.5 µM final concentration), an inhibitor of this complex, instead of AA. Measure the oxygen consumption until the signal decreases and stabilizes.
Figure 3 in the Representative Results section was updated from:
Figure 3: Determination of the optimal concentration of digitonin for the permeabilization of human sperm cells. The respiration rates were measured at 37 °C in MRM medium with glutamate, malate, and adenosine diphosphate. (A) Representative respiratory trace. The blue line is the O2 concentration, and the red line represents the O2 flow per volume correlated. (B) Mitochondria respiration rate means ± standard error, n = 4. The red arrow represents the optimal concentration. Abbreviation: dig = digitonin. Please click here to view a larger version of this figure.
to:
Figure 3: Determination of the optimal concentration of digitonin for the permeabilization of human sperm cells. The respiration rates were measured at 37 °C in MRM medium with glutamate, malate, and adenosine diphosphate. (A) Representative respiratory trace. The blue line is the O2 concentration, and the red line represents the O2 flow per volume correlated. (B) Mitochondria respiration rate means ± standard error, n = 4. The red arrow represents the optimal concentration. Abbreviation: dig = digitonin. Please click here to view a larger version of this figure.
Openbaarmakingen
No conflicts of interest declared.