This study of 196 PTC patients identified four independent CLNM predictors: tumor diameter >1 cm, capsular contact, microcalcification, and TSH >2.5 mIU/L. The combined model (AUC = 0.81) and mediation analysis (32.7% mediated by tumor diameter) support using these indicators to guide prophylactic central dissection decisions in cN0 PTC.
Onderzoeksartikel
Preoperative Clinical and Ultrasound Predictors of Central Lymph Node Metastasis in Papillary Thyroid Carcinoma: A Retrospective Study
In dit artikel
Samenvatting
Samenvatting
This retrospective study explored preoperative predictors of central lymph node metastasis (CLNM) in papillary thyroid carcinoma (PTC) patients to guide individualized surgical decision-making, particularly for clinical N0 (no clinical evidence of lymph node metastasis (cN0) stage cases, where prophylactic central lymph node dissection remains controversial. After applying 1:1 propensity score matching (PSM) to balance baseline characteristics, 196 patients were included based on postoperative pathology, divided into CLNM-positive (n = 98) and CLNM-negative (n = 98) groups. Preoperative data collected included age, gender, body mass index (BMI), serum thyroid-stimulating hormone (TSH) level, anti-thyroglobulin antibody (TgAb), anti-peroxidase antibody, along with ultrasound indicators such as maximum tumor diameter, multifocality, tumor location (capsular contact), boundary, morphology, internal echo, calcification type (microcalcification or coarse calcification), blood flow signal grade, cervical lymph node length-to-diameter ratio, and lymph node gate structure. Multivariate logistic regression analysis revealed that maximum tumor diameter >1 cm [odds ratio (OR) = 3.26, 95% confidence interval (CI): 1.61–6.61], capsular contact (OR = 2.97, 95% CI: 1.44–6.13), microcalcification (OR = 2.64, 95% CI: 1.28–5.46), and serum TSH level >2.5 mIU/L (OR = 1.98, 95% CI: 1.01–3.88) were independent predictors of CLNM (all p < 0.05). Generalized estimating equations (GEE) and sensitivity analyses confirmed model robustness. Mediation analysis suggests that 32.7% of the statistical association between microcalcification and CLNM was mediated through tumor diameter. The combined predictive model achieved an area under the curve of 0.81, indicating good discriminative ability. In conclusion, preoperative tumor size, capsular contact, microcalcification, and elevated TSH level effectively predict CLNM risk in PTC patients. For cN0 stage patients, integrating these four indicators can guide rational decision-making regarding prophylactic central lymph node dissection, helping to avoid unnecessary surgery while reducing the risk of occult metastasis, thereby supporting more precise, risk-stratified surgical management in clinical practice.
Inleiding
Papillary thyroid carcinoma (PTC), as the most common malignant tumor in the endocrine system, has been showing a continuous upward trend in incidence worldwide. This phenomenon is partly attributed to the widespread use of high-resolution ultrasound examinations and the enhanced awareness of population health check-ups1,2. Although PTC usually has a favorable prognosis, with a 10-year survival rate exceeding 90%, cervical lymph node metastasis, especially central lymph node metastasis (CLNM) in the central region (Zone VI), is not uncommon among newly diagnosed patients. The reported incidence rate can reach 30% to 80%3,4. The central region is the first site of lymph node metastasis for PTC, and its condition not only affects the tumor stage and risk stratification of recurrence but also directly determines the scope of surgical dissection: for patients with clinical assessment of cN0 (clinical N0, no lymph node metastasis found by imaging and clinical examination), whether to routinely perform prophylactic central neck dissection (pCND) remains a controversial issue in the field of thyroid surgery5,6. Supporters believe that pCND can reduce the postoperative neck recurrence rate, provide more accurate pathological staging, and guide subsequent radioactive iodine treatment; opponents argue that pCND increases the risk of permanent hypoparathyroidism and recurrent laryngeal nerve injury, and some patients with microcarcinoma may never experience clinical progression, and overtreatment may cause unnecessary damage7,8.
At the core of this clinical decision-making dilemma lies the severe insufficiency in the accuracy of preoperative prediction of CLNM status9,10. Currently, clinical practice relies on ultrasound examinations to assess central lymph node status, but ultrasound has limited sensitivity for CLNM, especially when typical malignant signs (such as microcalcification, cystic changes, and blood flow disorder) have not yet appeared in the lymph nodes, making it prone to missed diagnoses. Additionally, relying solely on ultrasound images is insufficient to comprehensively reflect the biological behavior of the tumor11,12. A large number of retrospective studies have attempted to identify predictive factors from clinical pathological variables such as age, gender, tumor size, multifocality, capsule invasion, and thyroid globulin antibody levels, but the results show significant heterogeneity, and most studies are limited by single centers, small samples, and insufficient correction for confounding biases13,14. In recent years, the association between preoperative serum thyroid-stimulating hormone (TSH) levels and the invasiveness of PTC has gradually gained attention –high TSH can promote tumor cell proliferation and migration through the TSH receptor pathway, but its independent predictive value for CLNM remains inconclusive15,16. Moreover, the relationships between ultrasound features such as microcalcification, capsule contact, and internal blood flow signals of the tumor and CLNM have been explored, but existing analyses mostly use univariate or multivariate logistic regression, failing to fully consider the clustering effect within the same center (such as the intra-group correlation brought about by different surgeons or pathologists), and few studies have deeply investigated whether there are mediating transmission paths among the indicators –for example, whether the ultrasound-detected microcalcification indirectly affects the risk of lymph node metastasis through promoting tumor volume increase17,18.
Based on the identified research gaps, our team designed a single-center retrospective study that included 196 patients with PTC who were diagnosed by postoperative pathology within the past two years (from January 2022 to December 2023). The aim was to systematically evaluate the predictive role of preoperative clinical and ultrasound examination indicators for CLNM, thereby providing quantitative evidence for individualized surgical decision-making. Compared with previous similar studies, this work has strengthened the statistical strategies at multiple levels. Firstly, PSM was employed at a 1:1 ratio to balance baseline confounding factors between the CLNM positive and negative groups, reducing selection bias. Secondly, a multivariate Logistic regression model was constructed in the matched cohort to screen independent predictors, and generalized estimating equations (GEE) were further introduced to correct the intra-group correlations that might arise due to data clustering (such as multiple lesions in the same patient or assessment of multiple regional lymph nodes), enhancing the robustness of parameter estimation. To ensure the reliability of the results, we designed sensitivity analyses, including excluding extreme continuous variable values and changing the assignment method of categorical variables, to observe the variation in effect estimates. Finally, given that there may be interrelationships between ultrasound features and tumor characteristics, the mediation effect analysis was introduced for the first time in the PTC central zone metastasis prediction model to quantify whether the association between an ultrasound indicator and CLNM may be statistically mediated through intermediate variables such as tumor size or location. This series of progressive statistical strategies not only addressed the deficiencies in confounding control and mechanism exploration in previous studies but also made the research conclusions more clinically applicable. The following will detail the specific methods, results, and implications for surgical decision-making of the study. It was hypothesized that preoperative clinical parameters (including serum TSH, TgAb, and TPOAb levels) and ultrasound features (including tumor size, capsular contact, microcalcification, and other morphological characteristics) would be independently associated with CLNM in PTC patients, and that a combined model integrating these predictors would provide satisfactory preoperative risk stratification to aid surgical decision-making in cN0 patients.
Protocol
This study was conducted in accordance with the principles of the Declaration of Helsinki. The research protocol was reviewed and approved by the Medical Ethics Committee of Jiujiang First People’s Hospital (Approval No.: JJSDYRMYY-YXLL-2026-058, dated May 18th, 2026). As this was a retrospective analysis of anonymized clinical data with no direct patient intervention, the ethics committee waived the requirement for written informed consent. All patient data were de-identified prior to analysis, and the research team committed to protecting patient confidentiality throughout the study.
Research subjects
This study retrospectively included patients who underwent thyroidectomy and concurrent central lymph node dissection at our institution from January 2022 to December 2023. During this period, a total of 412 patients underwent thyroid surgery for various thyroid diseases. Among these, 289 had a postoperative pathological diagnosis of thyroid carcinoma (including papillary, follicular, medullary, and undifferentiated types). After excluding non-papillary thyroid carcinoma subtypes (n = 75), 214 patients with PTC comprised the pre-matching cohort. Following 1:1 propensity score matching, 98 matched pairs (196 patients) were retained for the matched-cohort analyses. The patient selection and matching process is illustrated in Figure 1.
All included patients underwent their first thyroid surgery without any prior invasive procedures other than fine-needle aspiration biopsy, and the biopsy results did not affect inclusion. All patients underwent preoperative ultrasound-guided fine-needle aspiration biopsy (US-FNAB) of the dominant or most suspicious thyroid nodule(s) prior to surgery. FNAB was performed using a 22- to 25-gauge needle under real-time ultrasound guidance, with at least two passes per nodule to obtain adequate cellular material19,20. For patients with multinodular goiter, the nodule with the most suspicious ultrasound features—including microcalcifications, irregular margins, hypoechogenicity, taller-than-wide shape, or capsular contact—was selected for FNAB; additional nodules were biopsied if they exhibited suspicious features independent of the dominant nodule21. FNAB cytology was reported according to The Bethesda System for Reporting Thyroid Cytopathology (TBSRTC), with categories ranging from Bethesda II (benign) to Bethesda VI (malignant)22. Surgical intervention was recommended for patients with cytology diagnostic of or suspicious for malignancy (Bethesda V–VI), while decisions for Bethesda III–IV (indeterminate) lesions were made on a case-by-case basis, incorporating ultrasound features, nodule size, and patient preference. The final surgical plan—including the extent of thyroidectomy and the need for central lymph node dissection—was determined by the multidisciplinary team based on preoperative cytology, ultrasound findings, and clinical evaluation, with intraoperative frozen section used selectively to guide the extent of resection when cytology was indeterminate. Patients were excluded if they had a history of previous thyroid surgery or neck radiotherapy, concurrent other types of thyroid malignancies or head and neck tumors, or preoperative imaging suggesting lateral cervical lymph node or distant metastasis. All cases underwent postoperative paraffin embedding and hematoxylin-eosin (HE) staining and were independently diagnosed as PTC by two senior pathologists. The pathological diagnosis was based on the 2017 World Health Organization (WHO) classification of thyroid tumors, with core diagnostic features including a typical papillary structure, glassy cell nuclei, nuclear overlap, nuclear grooves, and intranuclear pseudonucleoli23. CLNM was defined as the presence of PTC cell nests or single tumor cell infiltration in lymph node tissue from the central (Ⅵ) region—specifically, the medial part of the recurrent laryngeal nerve, from the upper edge of the thyrohyoid muscle to the upper edge of the innominate artery. Metastatic foci were classified as micro-metastasis (≤2 mm) or macro-metastasis (>2 mm)24,25. The final CLNM gold standard for this study was postoperative pathology; ultrasound was used only as a preoperative assessment tool and not for grouping26,27. Preoperative high-resolution neck ultrasound examinations (probe frequency 7.5–12 MHz) were performed by board-certified radiologists with over ten years of experience in thyroid ultrasound as part of routine clinical care, with a single radiologist performing and reporting each examination. For the purposes of this retrospective study, all stored ultrasound images were independently re-reviewed by two senior radiologists (each with >10 years of thyroid ultrasound experience) who were blinded to the patients’clinical information and pathological outcomes. Inter-observer disagreements were resolved by consensus discussion to reach a final decision on each ultrasound feature. This dual-review approach was implemented specifically for the research data collection phase to minimize interpretation bias and enhance the reliability of preoperative ultrasound feature extraction, consistent with methodological practices in similar retrospective thyroid ultrasound studies28,29. The final CLNM gold standard for this study was postoperative pathology; ultrasound was used only as a preoperative assessment tool and not for grouping. Ultrasound criteria suggestive of metastatic central lymph nodes included short diameter >5 mm, short-to-long diameter ratio <2, absence or eccentric thickening of the lymph node hilum, presence of microcalcification (point-like hyperechoic foci ≤1 mm), cystic change, or peripheral blood flow signal (Adler grade ≥2). As part of routine preoperative evaluation for all patients undergoing thyroid surgery at our institution, serum thyroid function and autoantibody panels were measured in the fasting morning state. TgAb and TPOAb were included in this panel based on established clinical guidelines, which recommend testing for thyroid autoantibodies in patients with thyroid nodules, particularly when serum TSH is elevated, to assess for underlying autoimmune thyroid disease such as Hashimoto’s thyroiditis30,31. Given that Hashimoto’s thyroiditis is frequently associated with papillary thyroid carcinoma and may influence tumor behavior32, preoperative TgAb and TPOAb status provides valuable information for both diagnostic evaluation and prognostic stratification33. Additionally, preoperative TgAb measurement establishes a baseline for postoperative thyroglobulin monitoring, as TgAb interference can affect the accuracy of Tg assays in follow-up surveillance34. Serum TSH, TgAb, and TPOAb levels were measured using chemiluminescence methods, with results referenced to our laboratory’s normal ranges (TSH: 0.35–4.94µ IU/mL; TgAb positive: >115 IU/mL; TPOAb positive: >34 IU/mL).
After applying the inclusion and exclusion criteria, 214 eligible patients comprised the pre-matching cohort. Following 1:1 propensity score matching (PSM), 98 matched pairs (196 patients), comprising 98 CLNM-positive and 98 CLNM-negative patients, were retained for the matched-cohort analyses. No patients were lost to follow-up for the primary outcome, as all pathological data were obtained from the same hospitalization episode.
Exclusion and inclusion criteria
Inclusion criteria35,36: age ≥ 18 years; underwent high-resolution thyroid and cervical lymph node ultrasound examinations at the study hospital before surgery, with complete ultrasound images and reports; no preoperative imaging (ultrasound or computed tomography) findings suggestive of lateral cervical lymph node metastasis (levels II–V) or distant metastasis, as such patients would require lateral neck dissection beyond the central compartment, potentially confounding the analysis of predictors of central compartment metastasis; and complete clinicopathological and ultrasound data, with no missing key variables.
Exclusion criteria35,37,38,39: other types of malignant thyroid tumors, such as medullary carcinoma, undifferentiated carcinoma, or follicular carcinoma, or other tumors in the head and neck region; a history of thyroid surgery or neck radiotherapy; distant metastasis or lateral cervical lymph node metastasis detected before surgery that required an expanded resection scope; pregnancy or lactation; and suboptimal ultrasound or pathological image quality that precluded accurate diagnosis.
Research methodology
All ultrasound examinations in this study were conducted in the ultrasound department of our hospital. A color Doppler ultrasound diagnostic system equipped with a high-frequency linear array probe (frequency range 6–15 MHz) was used for all preoperative examinations, with the center frequency preset at 7.5–12 MHz to obtain optimal resolution for superficial tissues. All subjects were in the supine position, with pillows placed behind the neck and both shoulders to allow the neck to be moderately extended and fully expose the anterior cervical region. After applying an adequate amount of ultrasound coupling agent on the contact surface of the probe, the probe was gently placed on the skin surface of the anterior neck, and extra pressure was avoided to prevent compression of the thyroid tissue, which could result in image distortion. The scanning sequence was as follows: cross-sectional scanning and longitudinal scanning: during cross-sectional scanning, the probe was moved from the upper pole of the thyroid from top to bottom, observing the left lobe, right lobe and isthmus of the thyroid until the lower pole disappeared; during longitudinal scanning, the probe was made to perform a series of longitudinal sections along the long axis of the thyroid from the inner side to the outer side, covering the entire thyroid lobe. For each nodule in the thyroid, the maximum diameter was measured (taking the largest value among three measurements, accurate to 0.1 mm), and the following morphological characteristics were recorded: multifocality (distinguishing single lesion from two or more lesions), tumor location (whether contacting or adhering to the capsule, defined as the tumor edge being close to or exceeding the thyroid capsule line; and whether located in the isthmus), boundary (clear or unclear), shape (regular or irregular), internal echo (low echo, equal echo or high echo, with the surrounding normal thyroid tissue as a reference), and calcification type (no calcification, microcalcification, i.e., point-like strong echo with a diameter ≤ 1 mm without posterior acoustic shadow, or coarse calcification, i.e., diameter > 1 mm with posterior acoustic shadow or arc-shaped calcification). Under the color Doppler mode, the blood flow signals within and around the nodule were graded according to the Adler semi-quantitative classification method: 0 grade for no blood flow signal, 1 grade for a small amount of blood flow (visible 1–2 point-like or short rod-like blood flow), 2 grade for moderate blood flow (visible 3–4 point-like or one long vessel), 3 grade for abundant blood flow (visible 4 or more point-like or two or more long vessels)26. At the same time, the lymph node conditions in the neck were systematically evaluated, with a focus on the central area (Zone VI) and other lymph nodes in the neck, recording the short diameter (mm), ratio of short to long diameter, presence or absence of lymph node hilum structure or eccentric thickening, presence or absence of microcalcification or cystic change, and blood flow distribution pattern, etc.
All patients had 3–5 mL of peripheral venous blood collected from the elbow vein in the fasting state in the early morning before the operation. The blood was injected into a vacuum blood collection tube without an anticoagulant. It was left at room temperature to stand for 30 min until the blood clots fully contracted. Then, it was centrifuged at 1350 × g for 10 min to separate the serum. Serum TSH levels were quantitatively measured using a fully automatic chemiluminescence immunoassay analyzer with the corresponding chemiluminescence kit, employing a double-antibody sandwich chemiluminescence method. The sensitivity of TSH detection was 0.01 µIU/mL. The reference range of this laboratory was 0.35–4.94 µIU/mL. The intra-assay coefficient of variation was <5%, and the inter-assay coefficient of variation was <8%. TgAb and TPOAb levels were measured using a fully automatic chemiluminescence immunoassay analyzer with the corresponding reagent kits, based on an indirect chemiluminescence method. The positive definition threshold of TgAb was >115 IU/mL, and the positive definition threshold of TPOAb was >34 IU/mL. Quality control samples were tested daily to ensure inter-assay stability.
All the surgeries were performed by the same senior surgical team of the thyroid department of our hospital. The surgical methods were individually decided based on the preoperative ultrasound assessment and the intraoperative frozen pathological results, including thyroid lobectomy + isthmus resection or total thyroidectomy. All the enrolled patients underwent concurrent central region (Zone VI) lymph node dissection. The open surgical approach adopted a low anterior arc-shaped incision (Kocher incision), approximately 4–6 cm in length, which sequentially cut through the skin, subcutaneous tissue, and sternocleidomastoid muscle, and longitudinally separated the strap muscles along the cervical line to expose the thyroid gland. The choice between hemithyroidectomy (unilateral lobectomy with isthmectomy) and total thyroidectomy was individualized based on preoperative FNAB cytology (Bethesda category), tumor size (>4 cm favoring total thyroidectomy), multifocality, presence of capsular invasion on ultrasound, bilateral or contralateral nodules, patient age, and patient preference, in accordance with the 2015 American Thyroid Association guidelines21 and the Chinese guidelines for the diagnosis and treatment of thyroid nodules and differentiated thyroid cancer40. For patients with unilateral, unifocal PTC without high-risk features, hemithyroidectomy was generally preferred; total thyroidectomy was reserved for patients with bilateral disease, multifocal involvement, tumor size >4 cm, extra-thyroidal extension, or clinically involved cervical lymph.
Regarding the extent of central lymph node dissection, all patients underwent at least an ipsilateral central compartment (Level VI) lymph node dissection. For patients with preoperative evidence of bilateral central lymph node metastasis on ultrasound, or those undergoing total thyroidectomy for bilateral disease, bilateral central compartment dissection was performed41. The central compartment dissection boundaries were standardized as follows: superiorly to the hyoid bone, inferiorly to the innominate artery, laterally to the common carotid artery, and posteriorly to the prevertebral fascia, encompassing the pretracheal, paratracheal, and prelaryngeal lymph nodes42,43. Patients with preoperative ultrasound findings suspicious for lateral neck lymph node metastasis (Levels II–V) underwent additional lateral neck dissection; these patients were excluded from the current analysis to maintain a homogeneous cohort focused on central compartment metastasis prediction. During the operation, the recurrent laryngeal nerve was routinely exposed and protected, and the nerve function integrity was confirmed using a nerve monitoring device. Through fine anatomical techniques, the parathyroid glands and their blood supply were preserved in situ, and those that could not be preserved in situ were transplanted autogenously. The scope of the central region dissection was defined as follows: superiorly to the hyoid bone, inferiorly to the upper edge of the innominate artery, laterally to the medial margin of the common carotid artery, and medially to the tracheoesophageal groove44. After complete resection of the thyroid tissue, it is sent to the pathology department. For patients undergoing total thyroidectomy, bilateral central lymph nodes are also dissected. The specimen is immediately placed in 10% neutral formalin fixative after being removed from the body and sent for examination.
The thyroid and lymph node tissue specimens submitted for examination were processed in the pathology department following standardized procedures. After the tissue specimens were fixed in 10% neutral formalin for no less than 48 h, they were routinely dehydrated and embedded in paraffin. During the paraffin embedding process, liquid paraffin (melting point 56–58 °C) was poured into the embedding mold, and the wax-coated tissue blocks were placed flat along the predetermined cutting plane on the bottom of the mold. After the paraffin solidified, the wax blocks were trimmed to retain an appropriate amount of paraffin around the tissue to facilitate sectioning. The wax blocks were sectioned into 4–5 µm thick slices using a fully automatic rotary microtome. The sections were floated in a 40 °C constant temperature water bath to fully flatten them, then transferred to a non-removable glass slide, and placed in a 60 °C drying oven for 30 min to ensure the tissue adhered firmly. The routine HE staining steps include: xylene decolorization (2 times, each 10 min), gradient ethanol rehydration (2 times with 100% ethanol, 2 times with 95% ethanol, 1 time with 80% ethanol, each 3 min), safranin staining (5–10 min), 1% hydrochloric acid ethanol differentiation (a few seconds), tap water re-blotting (10–15 min), eosin staining (1–3 min), gradient ethanol dehydration, xylene clearing, and neutral gum mounting. The pathological diagnosis was independently reviewed and agreed upon by two senior pathologists without knowing the clinical and ultrasound data. The diagnosis of PTC was based on the 2017 WHO classification of thyroid tumors. The typical pathological features include papillary structure, opacified nuclei, nuclear overlap, nuclear grooves, and intranuclear pseudonucleoli. CLNM was defined as the presence of at least one lymph node containing a PTC cell nest or single tumor cell infiltration in the examined lymph nodes of the VI region through pathological examination. The size of the metastatic lesion was classified as micro-metastasis (≤2 mm) or macro-metastasis (>2 mm). In this study, the presence or absence of metastasis (yes/no) was used as the primary outcome variable45,46.
The data extraction was conducted by two independent researchers using standardized data collection forms to retrospectively retrieve data from the hospital’s electronic medical record system and PACS system. The collected data included all the aforementioned clinical and ultrasound indicators. For controversial ultrasound imaging features, a third senior ultrasound physician made the arbitration. The data quality was controlled by combining double data entry verification and logical validation. Variables with a missing rate exceeding 5% were excluded, and a multiple imputation method was used to handle a small number of missing values. All statistical analyses were performed using SPSS.
Observation indicators
The observation indicators of this study were divided into three categories: preoperative clinical indicators, preoperative ultrasound imaging indicators, and postoperative pathological outcome indicators. All indicators were collected and determined based on standardized operating procedures.
Preoperative clinical indicators included age, gender, BMI, preoperative serum TSH, TgAb, and TPOAb. Age was recorded in years and was treated as both a continuous variable (unit: years) and a categorical variable (divided into <55 years and ≥55 years groups based on 55 years). BMI was calculated based on the height (accurate to 0.1 cm) and weight (accurate to 0.1 kg) measured in the preoperative morning fasting state, using the formula of weight divided by the square of height (kg/m2). It was used as both a continuous variable, and stratified analysis was conducted based on the Chinese adult overweight standard at 24 kg/m2. TSH was detected by the chemiluminescence method, and the original value was recorded (unit: mIU/L). The TSH cutoff of 2.5 mIU/L was selected based on multiple lines of evidence. First, several independent studies have identified preoperative serum TSH ≥2.5 mIU/L as an independent predictor of central lymph node metastasis in PTC patients47,48. In a cohort of 162 patients with papillary thyroid microcarcinoma, serum TSH level ≥2.5 mIU/L was shown to be an independent predictor for CLNM in multivariate analysis19. Besler et al. reported that the prevalence of central metastasis was significantly higher in patients with TSH ≥2.5 mIU/L (p = 0.009), and preoperative TSH level was determined as an independent predictive risk factor for central neck metastases (p = 0.012)48. Second, from a biological standpoint, TSH exerts trophic effects on thyroid follicular cells via the TSH receptor pathway; elevated TSH promotes thyroid cell proliferation and may facilitate tumor progression and lymphatic spread49. Third, 2.5 mIU/L represents the upper quartile or median value of the normal TSH reference range (0.35–4.94 mIU/L) in our institutional laboratory and has been used as a clinically meaningful threshold in prior studies from our center. The TSH level was also analyzed as a continuous variable in supplementary analyses to evaluate its dose-response relationship with CLNM. The continuous form was also retained for sensitivity analysis. TgAb and TPOAb were defined as positive when >115 IU/mL and >34 IU/mL, respectively, and were considered negative when lower or equal to the above thresholds.
The preoperative ultrasound imaging indicators were independently evaluated and agreed upon by two senior ultrasound physicians without knowing the pathological results. The following features were extracted. Tumor maximum diameter: Measure the longest diameter of the nodule on the thyroid cross-sectional or longitudinal sectional images, accurate to 0.1 mm, and divide it into two groups: ≤1 cm and >1 cm. Multifocality: Classify the thyroid lesions based on the total number of lesions as single-focal (only one nodule) or multiple-focal (two or more nodules). Tumor location: Assess whether it contacts the thyroid capsule (defined as the nodule edge closely adhering or breaking through the thyroid capsule line, classified as yes or no) and whether it is located in the isthmus (yes or no). Boundary: Classified as a clear boundary (the nodule and the surrounding normal thyroid tissue have a clear demarcation) and an unclear boundary (the demarcation is blurred or serrated, infiltrative). Shape: Classified as regular (the nodule is round, oval, or approximately circular, with smooth edges) and irregular (the nodule is lobulated, spatulate, or angulated). Internal echo: Refer to the echo of the surrounding normal thyroid parenchyma as a reference, classified as hypoechoic (lower than normal parenchyma), isoechoic (approximately normal parenchyma), and hyperechoic (higher than normal parenchyma). Calcification type: Classified as no calcification, microcalcification (point-like strong echo with a diameter ≤1 mm, without posterior acoustic shadowing), and coarse calcification (diameter >1 mm, nodular, sheet-like, or arc-shaped strong echo, often accompanied by posterior acoustic shadowing). Blood flow signal grading: Adopt the Adler semi-quantitative grading method. Observe the internal and peripheral blood flow distribution in the nodule under the color Doppler mode, with 0 grade indicating no blood flow signal, 1 grade indicating a small amount of blood flow (visible 1–2 point-like or short rod-like blood flow), 2 grade indicating moderate blood flow (visible 3–4 point-like or one long vessel), and 3 grade indicating abundant blood flow (visible 4 or more point-like or two or more long vessels).
The key assessment of ultrasound features of cervical lymph nodes focuses on the central region (Zone VI) lymph nodes. The following parameters are recorded: the short diameter of the lymph node (taking the vertical diameter perpendicular to the long axis on the cross-section of the lymph node, accurate to 0.1 mm); the ratio of long diameter to short diameter (the ratio of the long diameter to the short diameter, divided into two categories: ≥2 and <2); the lymph node structure (divided into presence, disappearance or eccentric thickening); whether there are microcalcifications (point-like strong echo) or cystic changes (anechoic area); the blood flow distribution pattern (divided into no blood flow, lymph node type blood flow, peripheral type blood flow or mixed type blood flow). These lymph node features are used as candidate variables in univariate analysis, but the main outcome of this study is based on postoperative pathology as the gold standard, and ultrasound is only used as a preoperative assessment tool.
The postoperative pathological outcome indicators were the dependent variables in this study, namely the status of CLNM. The definition is as follows: The lymph node tissues from the VI area that were sent for examination after surgery were stained with HE. Two senior pathologists conducted a double-blind examination of the slides. If thyroid papillary cancer cell nests or single tumor cell infiltration were found in at least one lymph node, it was determined as CLNM positive; otherwise, it was negative. The number of metastatic lymph nodes and the maximum diameter of the metastatic lesion (divided into micro-metastasis ≤2 mm and macro-metastasis >2 mm) were also recorded. However, the main analysis used binary variables (presence or absence) as the outcome. In addition, the pathological subtype of the primary lesion (classic type, follicular type, high cell type, etc.), tumor size (compared with ultrasound measurement values), multifocality, extracapsular invasion, and extrathyroidal invasion were recorded to assist in grouping and sensitivity analysis. All observation indicators were entered into standardized tables during data extraction. For patients with multiple lesions, the ultrasound indicators were based on the characteristics of the largest lesion.
Sample size calculation
Given the retrospective nature of this study, the sample size was determined based on the available case volume during the study period (January 2022 to December 2023), which yielded 214 eligible patients before propensity score matching. Prior to PSM, we performed a prospective power analysis for the anticipated unmatched cohort: assuming a CLNM incidence of approximately 45% based on our institutional data and literature reports, with a two-sided α = 0.05, power (1–β) = 0.80, and an estimated odds ratio of 2.0 for the primary predictors, a minimum of 170 patients (85 per group) would be required to detect the specified effect.
After 1:1 PSM, 98 matched pairs were successfully retained. To assess whether the matched cohort retained adequate statistical power, we conducted a post hoc power analysis using the paired binary outcome formula [n_pair = (Z_(1-α/2) + Z_(1-β))2 × (OR^(-1/2) + OR^(1/2))2 / (4 × π × (1-π))], where π represents the approximate event rate in the exposed group. With the observed CLNM rate of 50% in the matched cohort and the same α and power parameters, the calculation confirmed that 98 pairs exceeded the minimum requirement of 85 pairs.
Furthermore, even if the true OR were as low as 1.8, the current sample would still provide >75% power. It should be acknowledged that post hoc power analysis has inherent limitations and is primarily used for descriptive purposes rather than confirmatory inference; nonetheless, the consistency between the prospective estimate and the post-matching calculation supports the adequacy of the final sample.
Additionally, for the multivariate logistic regression model incorporating no more than eight independent variables, the empirical rule requiring 10–15 events per variable was satisfied, as the matched cohort contained 98 CLNM-positive events.
Statistical methods
The statistical methods employed a multi-level strategy. Firstly, descriptive statistics were conducted on the raw data. Continuous variables with normal distribution were expressed as mean ± standard deviation, and inter-group comparisons were performed using the independent sample t-test; non-normal distribution variables were expressed as median (interquartile range), and the Mann-Whitney U test was used; categorical variables were expressed as frequency (percentage), and the χ2 test or Fisher’s exact test was adopted. To minimize the influence of observed baseline covariates and control for potential confounding, we employed 1:1 propensity score matching (PSM). Propensity scores were estimated using a non-parsimonious multivariable logistic regression model with CLNM status as the dependent variable. The following baseline covariates were included in the propensity score model based on their clinical relevance and established associations with CLNM in the literature: age (continuous), sex, BMI (continuous), multifocality (binary), maximum tumor diameter (continuous), and capsular contact (binary). We did not include additional covariates (e.g., TSH, microcalcification) in the propensity score model to avoid adjusting for variables that might themselves be mediators of the exposure–outcome relationship, which could introduce overadjustment bias. The choice of a non-parsimonious model, including all clinically relevant covariates regardless of their statistical significance in univariate analysis, followed established recommendations for propensity score estimation to optimize covariate balance. Subsequently, 1:1 nearest-neighbor matching without replacement was performed using a caliper width of 0.2 standard deviations of the logit-transformed propensity score, as recommended by Austin44. Standardized mean differences (SMDs) were calculated for all baseline covariates before and after matching, with an SMD <0.1 considered to indicate adequate balance between the two groups. However, it is important to acknowledge that the selection bias inherent to retrospective designs cannot be entirely eliminated by statistical adjustment alone. To comprehensively address this limitation, we combined PSM with multivariable regression adjustment, generalized estimating equations (GEE) to account for clustering effects, and multiple sensitivity analyses to assess the robustness of our findings against unmeasured confounding. This multi-layered approach does not remove selection bias but rather strengthens the internal validity by ensuring that the association between predictors and CLNM is not merely an artifact of imbalanced covariates. After matching, the cohort was again compared between groups to verify the balance. Univariate logistic regression was performed on the pre-matching cohort to identify candidate predictors (p < 0.10) for the subsequent multivariate model. Propensity score matching was then applied to balance baseline characteristics, and the matched cohort was used for the multivariate logistic regression analysis and all subsequent analyses (GEE, sensitivity analyses, mediation analysis). On this basis, a multivariate binary Logistic regression model (enter method) was constructed to screen independent predictors of CLNM, including variables from univariate analysis with p < 0.10 and factors considered clinically important. In addition to the dichotomized analysis using the 2.5 mIU/L cutoff, TSH was also evaluated as a continuous variable in supplementary analyses. Univariate and multivariate logistic regression models were fitted with TSH entered as a continuous predictor (per 1.0 mIU/L increase). Restricted cubic spline regression with three knots was used to assess potential non-linear relationships between TSH levels and CLNM risk. To account for the non-independence of observations arising from patients with multiple thyroid nodules or multifocal lesions—where multiple lesions from the same patient are more likely to share similar biological and microenvironmental characteristics than lesions from different patients—we specified patient-level clustering as the unit of correlation in the GEE framework. Specifically, each patient was treated as an independent cluster, and all lesions/nodes from the same patient were considered correlated within that cluster50. A generalized estimating equation (GEE) with an exchangeable working correlation structure was employed for this purpose. The exchangeable structure assumes a constant correlation between any two observations within the same patient cluster51, and is appropriate for the data because there was no a priori expectation that correlations would decay over time or space, as in AR-1 structures. Furthermore, the number of lesions per patient was small and variable, making unstructured correlation matrices impractical due to overparameterization52. The exchangeable structure also provides a parsimonious yet robust approach to accounting for within-patient clustering, yielding asymptotically valid standard error estimates even when the true correlation structure is misspecified. Robust standard errors were estimated. Sensitivity analyses were conducted by refitting the regression model after removing extreme values below the 5th percentile and above the 95th percentile for continuous variables, including age, BMI, and maximum tumor diameter. The analysis was also repeated after reassigning categorical variables, such as changing contact status from yes/no to contact-degree grading and changing the TSH cutoff from 2.5 to 4.0 mIU/L, to determine whether the OR values and confidence intervals changed directionally.
Mediation analysis
To explore the potential pathway through which ultrasound features may be associated with CLNM, we conducted a mediation analysis following the framework proposed by Baron and Kenny42 and further developed by Preacher and Hayes43. Mediation analysis decomposes the total association between an exposure (X) and an outcome (Y) into a direct effect (X → Y) and an indirect effect (X → M → Y) that operates through a mediator variable (M)44. In this study, microcalcification (binary: present vs. absent) was specified as the exposure variable (X), CLNM (binary: positive vs. negative) as the outcome variable (Y), and maximum tumor diameter (>1 cm, binary) as the mediator variable (M). The selection of tumor diameter as the mediator was based on the biological plausibility that microcalcification—often corresponding to psammoma bodies indicative of active tumor proliferation—may be associated with larger tumor size, which in turn increases lymphatic spread risk52.
The mediation model was estimated using a widely used mediation analysis macro for SPSS45, which implements ordinary least squares regression for continuous mediators and logistic regression for binary outcomes. The following effects were estimated: the total effect (c), representing the overall association between microcalcification and CLNM; the direct effect (c’), representing the association between microcalcification and CLNM after accounting for the mediator; and the indirect effect (ab), calculated as the product of the effect of microcalcification on tumor diameter (a) and the effect of tumor diameter on CLNM adjusted for microcalcification (b). The proportion mediated was calculated as (ab / c) × 100%.
Given that the product of coefficients (ab) does not follow a normal distribution, statistical significance of the indirect effect was assessed using bias-corrected bootstrap confidence intervals based on 5,000 resamples53. An indirect effect was considered statistically significant if the 95% bootstrap confidence interval did not include zero54. Due to the retrospective observational design of this study, all mediation results are interpreted as statistical associations rather than causal mechanisms; this interpretation is consistent with the AGReMA (A Guideline for Reporting Mediation Analyses) statement recommendations for observational studies55.
To formally compare the discriminative performance between the combined model and each individual predictor, pairwise comparisons of AUCs were performed using DeLong’s nonparametric method for correlated ROC curves56. The DeLong test evaluates the statistical significance of the difference between two AUCs derived from the same cohort (paired design), accounting for the correlation between the two ROC curves57. A two-sided p-value < 0.05 was considered to indicate a statistically significant difference in AUC between the combined model and each individual predictor.
All statistical analyses were completed using SPSS, and a two-sided p < 0.05 was considered statistically significant.
Resultaten
Baseline characteristics
After PSM, as shown in Table 1, there were 98 cases in each of the CLNM-positive group and the negative group. There were no statistically significant differences in 12 baseline indicators, such as age, gender, body mass index, preoperative TSH level, TgAb positive rate, TPOAb positive rate, tumor maximum diameter, multifocality ratio, capsule contact ratio, unclear boundary ratio, hypoechoic ratio, and microcalcification ratio, between the two groups (p value range 0.47–0.70). As shown in Table 1, the SMD values for all 12 baseline covariates after matching ranged from 0.06 to 0.09, all below the conventional threshold of 0.1, indicating adequate balance between the two groups after PSM.
Univariate analysis
Univariate logistic regression was performed on the pre-matching cohort (n = 214) to screen candidate predictors for entry into the multivariate model. As shown in Table 2, tumor maximum diameter >1 cm, capsular contact, microcalcification, and TSH >2.5 mIU/L were significantly associated with CLNM (all p < 0.05). According to the results of the univariate Logistic regression analysis shown in Table 2, the effects and screening of each of the 12 candidate predictors were evaluated. The analysis revealed that three ultrasound indicators, namely tumor maximum diameter > 1 cm [OR = 3.32, 95% confidence interval (CI): 1.71–6.45, p < 0.001], adhesion to the capsule (OR = 3.06, 95% CI: 1.60–5.87, p < 0.001), and microcalcification (OR = 2.86, 95% CI: 1.50–5.46, p = 0.001), were significantly positively correlated with CLNM, and the differences were highly statistically significant. Preoperative TSH > 2.5 mIU/L also showed an independent predictive trend (OR = 1.97, 95% CI: 1.01–3.85, p = 0.046), reaching the statistical significance level. Additionally, the p-values of the multifocal and ill-defined boundaries variables were 0.094 and 0.098, respectively, which were at the margin of significance (p < 0.10), suggesting possible predictive value. The p-values of the remaining variables, such as age ≥55 years, male, BMI ≥ 24 kg/m2, TgAb positive, TPOAb positive, and hypoechoic, were all greater than 0.10 and were not significantly associated with CLNM. Based on the above results, this study set p < 0.10 as the screening criterion for including variables in the multivariate regression model. The variables TSH > 2.5 mIU/L, tumor maximum diameter > 1 cm, multifocality, adhesion to the capsule, ill-defined boundaries, and microcalcification were included in the subsequent multivariate Logistic regression analysis to further correct confounding factors and identify independent predictors.
Multivariate logistic regression analysis
Based on the single-variable screening, a multivariate Logistic regression model was further constructed (Table 3). The results showed that tumor maximum diameter > 1 cm (OR = 3.26, 95% CI: 1.61–6.61, p = 0.001), contact with the capsule (OR = 2.97, 95% CI: 1.44–6.13, p = 0.003), microcalcification (OR = 2.64, 95% CI: 1.28–5.46, p = 0.009), and preoperative TSH > 2.5 mIU/L (OR = 1.98, 95% CI: 1.01–3.88, p = 0.046) were independent predictors of CLNM. However, multifocality and unclear boundaries did not reach statistical significance after adjusting for other factors. The model had a good fit (Hosmer-Lemeshow test χ2 = 6.23, p = 0.62), and the overall classification accuracy was 76.5%.
Generalized estimating equation analysis
To correct for the data clustering effect caused by multiple lesions in the same patient, GEE was used for robust estimation (Table 4). The results were highly consistent with multivariate Logistic regression: the maximum tumor diameter > 1 cm (OR = 3.16, 95% CI: 1.59–6.28, p = 0.001), contact with the capsule (OR = 2.89, 95% CI: 1.43–5.84, p = 0.003), microcalcification (OR = 2.56, 95% CI: 1.26–5.20, p = 0.009), and TSH > 2.5 mIU/L (OR = 1.92, 95% CI: 1.00–3.69, p = 0.049) had their estimated effects and significance not changed in direction. The quasi-likelihood independence criterion (QIC) was 245.6, indicating that the model was robust.
Sensitivity analysis
Further verification of the reliability of the results was conducted through sensitivity analysis. Firstly, extreme values beyond the 5th and 95th percentiles of the continuous variables were removed (a total of 12 cases were excluded, leaving 184 cases), and the model was re-fitted (Table 5). The OR values of each predictor were basically consistent with the main analysis: the maximum tumor diameter > 1 cm (OR = 3.32, 95% CI: 1.58–6.98, p = 0.002), adhesion to the capsule (OR = 3.03, 95% CI: 1.41–6.51, p = 0.004), microcalcification (OR = 2.69, 95% CI: 1.28–5.66, p = 0.009), and OR for TSH > 2.5 mIU/L was 2.01 (95% CI: 0.99–4.08), with the p value slightly increasing to 0.052, but the direction and magnitude of the effect remained consistent. Secondly, the variable assignment method was changed (Table 6): after raising the TSH cutoff point from 2.5 mIU/L to 4.0 mIU/L, the predictive effect weakened (OR = 1.68, 95% CI: 0.80–3.53, p = 0.17), suggesting that 2.5 mIU/L might be a more optimal clinical cutoff point; after changing the classification of adhesion from binary (yes/no) to three-level (no contact, contact, breakthrough), the OR for each increase in level was 2.48 (95% CI: 1.35–4.56, p = 0.003), showing a clear dose-response relationship. To evaluate the dose-response relationship between preoperative TSH levels and CLNM risk, TSH was additionally analyzed as a continuous variable. In univariate logistic regression, each 1.0 mIU/L increase in serum TSH was associated with a modest increase in CLNM risk (OR = 1.18, 95% CI: 1.02–1.37, p = 0.031). However, after adjusting for other covariates (tumor diameter, capsular contact, microcalcification, multifocality, age, and sex) in the multivariate model, TSH as a continuous variable did not retain statistical significance (OR = 1.12, 95% CI: 0.95–1.32, p = 0.18). The restricted cubic spline analysis did not reveal a clear linear or threshold effect across the entire TSH range (p for non-linearity = 0.34). These findings suggest that while TSH is associated with CLNM risk when dichotomized at 2.5 mIU/L, its effect as a continuous measure is attenuated after adjustment for other strong predictors, supporting the use of the 2.5 mIU/L cutoff as a clinically practical threshold rather than a strict biological breakpoint.
Mediation analysis
The mediation analysis (Table 7) examined whether the association between microcalcification and CLNM operated through maximum tumor diameter (>1 cm) as a mediator. The total effect of microcalcification on CLNM was 1.04 (95% CI: 0.38–1.70, p = 0.002), representing the overall association before accounting for the mediator. After introducing tumor diameter into the model, the direct effect decreased to 0.70 (95% CI: 0.05–1.35, p = 0.03), while the indirect effect through tumor diameter was 0.34 (95% CI: 0.06–0.66, p = 0.008). The indirect effect accounted for 32.7% of the total effect, indicating partial mediation—i.e., microcalcification was associated with CLNM both directly and indirectly through its association with larger tumor diameter. The 95% bootstrap confidence interval for the indirect effect did not include zero, confirming the statistical significance of the mediation pathway. These findings suggest that microcalcification may reflect tumor characteristics associated with both larger diameters and higher metastatic potential; however, given the retrospective design, this mediation pathway should be interpreted as a statistical association rather than evidence of a causal mechanism.
Model performance and subgroup analysis
Based on the predicted probabilities obtained from the multivariate regression model, the receiver operating characteristic curve (ROC) was plotted, and the area under the curve (AUC) was 0.81 (95% CI: 0.75–0.87). With a cut-off point of predicted probability ≥ 0.45, the sensitivity was 76.5%, and the specificity was 72.4%.
To assess the model’s generalizability and guard against overfitting, internal validation was performed using bootstrap resampling with 1,000 iterations. The optimism-corrected AUC was estimated by applying the bootstrap-derived shrinkage factor to the original model coefficients. The apparent AUC of the combined model was 0.81 (95% CI: 0.75–0.87). After bootstrap correction, the optimism-adjusted AUC was 0.79 (95% CI: 0.73–0.85), with a shrinkage factor of 0.86, indicating mild optimism and acceptable model stability. The calibration plot demonstrated good agreement between predicted and observed probabilities (intercept = -0.02, slope = 0.89), with a Hosmer-Lemeshow calibration statistic of χ2 = 8.14 (p = 0.42), further supporting adequate model fit. These internal validation results suggest that the predictive model is unlikely to be substantially overfitted and may perform reasonably well in similar clinical settings, although external validation in independent cohorts is warranted. Further subgroup analysis was conducted based on tumor size (≤1 cm vs >1 cm), and the results showed that in the micro-cancer (≤1 cm) subgroup, adhesion to the capsule (OR = 2.89, 95% CI: 1.22–6.85 and microcalcification (OR = 2.41, 95% CI: 1.02–5.70) remained independent predictors of CLNM (Table 8).
ROC was plotted based on the predicted probabilities obtained from the multivariate Logistic regression model. The original data of the area under the curve (AUC) for each independent predictor and the combined model are shown in Table 9 and Figure 2. Among the individual ultrasound indicators, the AUC for tumors with a maximum diameter > 1 cm was 0.68 (95% CI: 0.60–0.76), and the optimal cut-off point of the Youden index corresponded to a sensitivity of 65.3% and a specificity of 72.4%; the AUC for the capsule contact was 0.66 (95% CI: 0.58–0.74), with a sensitivity of 60.2% and a specificity of 70.4%; the AUC for microcalcification was 0.65 (95% CI: 0.57–0.73), with a sensitivity of 58.2% and a specificity of 69.4%. The AUC for preoperative TSH > 2.5 mIU/L was relatively low, at 0.58 (95% CI: 0.50–0.66), with a sensitivity of 48.0% and a specificity of 62.2%. In contrast, the combined model including the above four independent predictors demonstrated the best discriminatory ability, with an AUC of 0.81 (95% CI: 0.75–0.87), and a sensitivity of 76.5% and a specificity of 72.4% at the optimal cut-off point (predicted probability ≥ 0.45). All AUC values were significantly greater than 0.50 (p < 0.01), and the predictive performance of TSH was weak but still superior to the random level (p = 0.046).
To assess whether the combined model’s AUC was statistically superior to each individual predictor, pairwise DeLong tests were performed (Table 10). The combined model demonstrated significantly higher AUC than tumor diameter >1 cm (ΔAUC = 0.13, 95% CI: 0.06–0.20, p = 0.002), capsular contact (ΔAUC = 0.15, 95% CI: 0.08–0.22, p < 0.001), microcalcification (ΔAUC = 0.16, 95% CI: 0.09–0.23, p < 0.001), and TSH >2.5 mIU/L (ΔAUC = 0.23, 95% CI: 0.15–0.31, p < 0.001). These results confirm that the combined model provides statistically superior discriminative ability compared to any single preoperative indicator.
Among the 196 enrolled patients, preoperative ultrasound identified suspicious central lymph node features in 42 patients (21.4%) (Table 11), all of whom were confirmed to have CLNM on postoperative pathology, yielding a positive predictive value of 100% for ultrasound-positive cases. Of the remaining 154 patients who were classified as cN0 by preoperative ultrasound, 56 patients (36.4%) were found to have CLNM on final pathology, representing occult metastases missed by ultrasound. Among these 56 ultrasound-negative/CLNM-positive patients, our combined model classified 41 patients (73.2%) as high-risk (predicted probability ≥0.45), demonstrating that the model could have identified approximately three-quarters of the occult metastases that were not detected by ultrasound alone. This suggests that the combined model provides meaningful incremental value over ultrasound alone in identifying cN0 patients who may benefit from prophylactic central lymph node dissection.
Extent of central compartment dissection
Among the 196 patients, 120 (61.2%) underwent ipsilateral central compartment (Level VI) lymph node dissection and 76 (38.8%) underwent bilateral central compartment dissection. In the CLNM-positive group, 50 patients underwent ipsilateral dissection and 48 underwent bilateral dissection; in the CLNM-negative group, 70 and 28 patients underwent ipsilateral and bilateral dissection, respectively (Table 12).
In summary, this study identified four independent preoperative predictors of CLNM in PTC patients: maximum tumor diameter >1 cm, capsular contact, microcalcification, and serum TSH >2.5 mIU/L. The combined model demonstrated good discriminative ability with an AUC of 0.81, supporting the hypothesis that integrated clinical and ultrasound variables can provide effective preoperative risk stratification for cN0 patients. The mediation analysis revealed a statistically significant indirect pathway through which microcalcification was associated with CLNM in a pathway statistically consistent with mediation through tumor diameter; however, this finding should be interpreted as an association rather than a causal mechanism due to the retrospective design. Internal validation via bootstrap confirmed the model’s stability with minimal optimism (optimism-corrected AUC = 0.79), further supporting the reliability of the identified predictors. These results collectively suggest that the four indicators can serve as a practical preoperative tool to guide individualized decisions regarding prophylactic central lymph node dissection in cN0 PTC patients.
DATA AVAILABILITY
The anonymized minimal dataset supporting the findings of this study is provided in Supplementary File 1.
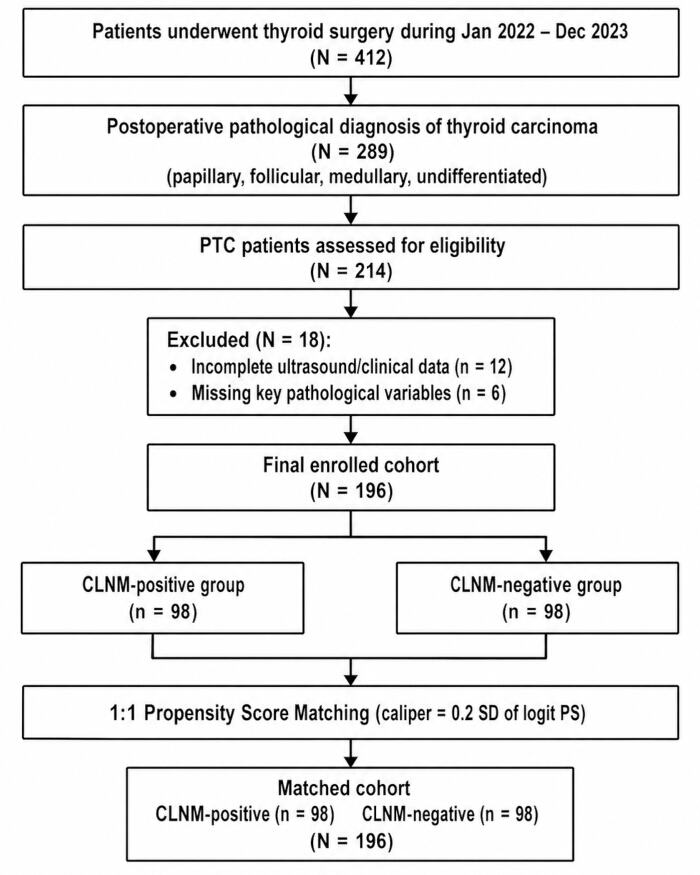
Figure 1: CONSORT-style flow diagram illustrating patient selection, exclusion criteria, and the propensity score matching (PSM) process. Abbreviations: PTC = papillary thyroid carcinoma; CLNM = central lymph node metastasis; PSM = propensity score matching. Please click here to view a larger version of this figure.

Figure 2: ROC Curve Receiver operating characteristic (ROC) curves for predicting CLNM. The curves display the performance of individual predictors (tumor diameter >1 cm, capsular contact, microcalcification, and TSH >2.5 mIU/L) and the combined multivariate logistic regression model. The diagonal dashed line represents the reference line (AUC = 0.5). Abbreviations: AUC = area under the curve; CLNM = central lymph node metastasis; TSH = thyroid-stimulating hormone. Please click here to view a larger version of this figure.
| Variable | CLNM-positive (n=98) | CLNM-negative (n=98) | t/χ² | 95% CI | SMD after matching | P value |
| Age (years) | 45.32 ± 12.18 | 46.05 ± 11.94 | t = -0.43 | (-3.24, 2.78) | 0.06 | 0.67 |
| Sex (male/female) | 38/60 | 35/63 | χ² = 0.20 | — | 0.07 | 0.66 |
| BMI (kg/m²) | 23.45 ± 3.22 | 23.18 ± 3.45 | t = 0.58 | (-0.73, 1.27) | 0.08 | 0.56 |
| TSH (mIU/L) | 2.18 ± 1.35 | 2.05 ± 1.28 | t = 0.71 | (-0.25, 0.51) | 0.09 | 0.48 |
| TgAb positive (n, %) | 22 (22.45) | 19 (19.39) | χ² = 0.29 | — | 0.08 | 0.59 |
| TPOAb positive (n, %) | 18 (18.37) | 16 (16.33) | χ² = 0.15 | — | 0.06 | 0.7 |
| Tumor maximum diameter (cm) | 1.12 ± 0.45 | 1.08 ± 0.42 | t = 0.66 | (-0.09, 0.17) | 0.09 | 0.51 |
| Multifocality (n, %) | 31 (31.63) | 28 (28.57) | χ² = 0.22 | — | 0.07 | 0.64 |
| Capsular contact (n, %) | 44 (44.90) | 40 (40.82) | χ² = 0.34 | — | 0.08 | 0.56 |
| Ill-defined boundary (n, %) | 52 (53.06) | 48 (48.98) | χ² = 0.33 | — | 0.08 | 0.57 |
| Hypoechoic (n, %) | 76 (77.55) | 73 (74.49) | χ² = 0.25 | — | 0.07 | 0.62 |
| Microcalcification (n, %) | 55 (56.12) | 50 (51.02) | χ² = 0.52 | — | 0.09 | 0.47 |
Table 1: Comparison of baseline characteristics between CLNM-positive and CLNM-negative groups after propensity score matching. Data are presented as mean ± SD for continuous variables and as n (%) for categorical variables. p values were derived from independent-sample t-tests for continuous variables, and Pearson χ2 tests for categorical variables. SMD < 0.1 indicates adequate balance between groups. Abbreviations: SMD = standardized mean difference; CLNM = central lymph node metastasis; BMI = body mass index; TSH = thyroid-stimulating hormone; TgAb = anti-thyroglobulin antibody; TPOAb = anti-thyroid peroxidase antibody; SD = standard deviation; CI = confidence interval.
| Variable | Regression coefficient (β) | Standard error | Wald χ² | OR | 95% CI | p |
| Age (≥ 55 years old vs < 55 years old) | -0.32 | 0.28 | 1.31 | 0.73 | (0.42, 1.26) | 0.25 |
| Gender (Male vs Female) | 0.45 | 0.31 | 2.11 | 1.57 | (0.86, 2.88) | 0.15 |
| BMI (≥24 kg/m²) | 0.28 | 0.29 | 0.93 | 1.32 | (0.75, 2.34) | 0.34 |
| TSH (>2.5 mIU/L) | 0.68 | 0.34 | 4 | 1.97 | (1.01, 3.85) | 0.046 |
| Positive for TgAb | 0.23 | 0.35 | 0.43 | 1.26 | (0.63, 2.51) | 0.51 |
| Positive for TPOAb | 0.15 | 0.37 | 0.16 | 1.16 | (0.56, 2.41) | 0.69 |
| Tumor maximum diameter (> 1 cm) | 1.2 | 0.34 | 12.46 | 3.32 | (1.71, 6.45) | <0.001 |
| Multifocal (is) | 0.52 | 0.31 | 2.81 | 1.68 | (0.92, 3.09) | 0.094 |
| Contact with the coating (is) | 1.12 | 0.33 | 11.52 | 3.06 | (1.60, 5.87) | <0.001 |
| The boundaries are unclear. | 0.48 | 0.29 | 2.74 | 1.62 | (0.92, 2.86) | 0.098 |
| Low echo (is) | 0.31 | 0.34 | 0.83 | 1.36 | (0.70, 2.65) | 0.36 |
| Microcalcification (is) | 1.05 | 0.33 | 10.12 | 2.86 | (1.50, 5.46) | 0.001 |
Table 2: Univariate logistic regression analysis of candidate predictors for CLNM in the pre-matching cohort. Variables with p < 0.10 were selected for entry into the multivariate regression model. Abbreviations: OR = odds ratio; CI = confidence interval; CLNM = central lymph node metastasis; BMI = body mass index; TSH = thyroid-stimulating hormone; TgAb = anti-thyroglobulin antibody; TPOAb = anti-thyroid peroxidase antibody.
| Variable | β | Standard error | Wald χ² | OR | 95% CI | p |
| The maximum diameter of the tumor is greater than 1 cm. | 1.18 | 0.36 | 10.74 | 3.26 | (1.61, 6.61) | 0.001 |
| Membrane contact | 1.09 | 0.37 | 8.68 | 2.97 | (1.44, 6.13) | 0.003 |
| Microcalcification | 0.97 | 0.37 | 6.87 | 2.64 | (1.28, 5.46) | 0.009 |
| TSH >2.5 mIU/L | 0.68 | 0.34 | 4 | 1.98 | (1.01, 3.88) | 0.046 |
| Multifocal | 0.41 | 0.34 | 1.45 | 1.51 | (0.78, 2.92) | 0.23 |
| Unclear boundaries | 0.35 | 0.32 | 1.2 | 1.42 | (0.76, 2.66) | 0.27 |
Table 3: Multivariate logistic regression analysis identifying independent predictors of CLNM. The model was constructed using the enter method, including variables with p < 0.10 from univariate analysis. Hosmer-Lemeshow goodness-of-fit test: χ2 = 6.23, p = 0.62. Abbreviations: OR = odds ratio; CI = confidence interval; CLNM = central lymph node metastasis; TSH = thyroid-stimulating hormone.
| Variable | β | Standard error | Steady Z value | OR | 95% CI | p |
| The maximum diameter of the tumor is greater than 1 cm. | 1.15 | 0.35 | 3.29 | 3.16 | (1.59, 6.28) | 0.001 |
| Membrane contact | 1.06 | 0.36 | 2.94 | 2.89 | (1.43, 5.84) | 0.003 |
| Microcalcification | 0.94 | 0.36 | 2.61 | 2.56 | (1.26, 5.20) | 0.009 |
| TSH >2.5 mIU/L | 0.65 | 0.33 | 1.97 | 1.92 | (1.00, 3.69) | 0.049 |
Table 4: Generalized estimating equation (GEE) analysis for CLNM prediction. An exchangeable correlation structure was used to account for within-subject clustering effects from multiple lesions. Quasi-likelihood independence criterion (QIC) = 245.6. Abbreviations: OR = odds ratio; CI = confidence interval; CLNM = central lymph node metastasis; TSH = thyroid-stimulating hormone.
| Variable | β | Standard error | Wald χ² | OR | 95% CI | p |
| The maximum diameter of the tumor is greater than 1 cm. | 1.2 | 0.38 | 9.98 | 3.32 | (1.58, 6.98) | 0.002 |
| Membrane contact | 1.11 | 0.39 | 8.1 | 3.03 | (1.41, 6.51) | 0.004 |
| Microcalcification | 0.99 | 0.38 | 6.79 | 2.69 | (1.28, 5.66) | 0.009 |
| TSH >2.5 mIU/L | 0.7 | 0.36 | 3.78 | 2.01 | (0.99, 4.08) | 0.052 |
Table 5: Sensitivity analysis of the multivariate logistic regression model after excluding extreme values (beyond the 5th and 95th percentiles) of continuous variables (age, BMI, tumor diameter, and TSH). A total of 12 cases were excluded, leaving 184 cases for re-analysis. Abbreviations: OR = odds ratio; CI = confidence interval; TSH = thyroid-stimulating hormone.
| Variable | Assignment method | β | Standard error | Wald χ² | OR | 95% CI | p |
| TSH | >4.0 mIU/L | 0.52 | 0.38 | 1.87 | 1.68 | (0.80, 3.53) | 0.17 |
| Membrane contact | Level 3 (None/Contact/Breakthrough) | 0.91 | 0.31 | 8.62 | 2.48 (Each additional level) | (1.35, 4.56) | 0.003 |
Table 6: Sensitivity analysis using alternative variable assignments and cutoff values. TSH cutoff was changed from 2.5 mIU/L to 4.0 mIU/L, and capsular contact was re-categorized from binary (yes/no) into three levels (no contact, contact, breakthrough). OR: odds ratio; CI: confidence interval; TSH: thyroid-stimulating hormone.
| Type of effect | Effect size | Bootstrap standard error | 95% CI | Percentage (%) | p |
| Overall effect | 1.04 | 0.34 | (0.38, 1.70) | 100 | 0.002 |
| Direct effect | 0.7 | 0.33 | (0.05, 1.35) | 67.3 | 0.03 |
| Indirect effect | 0.34 | 0.15 | (0.06, 0.66) | 32.7 | 0.008 |
Table 7: Mediation analysis of the pathway microcalcification → maximum tumor diameter (>1 cm) → CLNM. Indirect, direct, and total effects were estimated using the bootstrap method with 5,000 resamples. Abbreviation: CLNM = central lymph node metastasis.
| Variable | β | Standard error | Wald χ² | OR | 95% CI | p |
| Membrane contact | 1.06 | 0.44 | 5.8 | 2.89 | (1.22, 6.85) | 0.016 |
| Microcalcification | 0.88 | 0.44 | 4 | 2.41 | (1.02, 5.70) | 0.046 |
| TSH >2.5 mIU/L | 0.55 | 0.42 | 1.71 | 1.73 | (0.76, 3.94) | 0.19 |
Table 8: Subgroup analysis of predictors for CLNM in patients with papillary thyroid microcarcinoma (maximum tumor diameter ≤ 1 cm). This subgroup included 112 patients (56 per group). Tumor diameter was fixed and therefore not included in this model. Abbreviations: CLNM = central lymph node metastasis; TSH = thyroid-stimulating hormone.
| Predictive factor / model | AUC | Standard error | Asymptotic 95% confidence interval | The optimal cut-off point of the Youden index | Sensitivity (%) | Specificity (%) |
| The maximum diameter of the tumor is greater than 1 cm. | 0.68 | 0.04 | (0.60, 0.76) | 0.35 | 65.3 | 72.4 |
| Membrane contact | 0.66 | 0.04 | (0.58, 0.74) | 0.3 | 60.2 | 70.4 |
| Microcalcification | 0.65 | 0.04 | (0.57, 0.73) | 0.28 | 58.2 | 69.4 |
| TSH >2.5 mIU/L | 0.58 | 0.04 | (0.50, 0.66) | 0.2 | 48 | 62.2 |
| Joint Model | 0.81 | 0.03 | (0.75, 0.87) | 0.45 | 76.5 | 72.4 |
Table 9: Area under the receiver operating characteristic curve (AUC) for individual predictors and the combined multivariate model. The optimal cutoff was determined using the Youden index (sensitivity + specificity –1). Abbreviations: CLNM = central lymph node metastasis; TSH = thyroid-stimulating hormone; CI = confidence interval.
| Comparison | AUC₁ | AUC₂ | ΔAUC | 95% CI | Z statistic | p value |
| Combined model vs. Tumor diameter >1 cm | 0.81 | 0.68 | 0.13 | 0.06–0.20 | 3.09 | 0.002 |
| Combined model vs. Capsular contact | 0.81 | 0.66 | 0.15 | 0.08–0.22 | 3.75 | <0.001 |
| Combined model vs. Microcalcification | 0.81 | 0.65 | 0.16 | 0.09–0.23 | 3.91 | <0.001 |
| Combined model vs. TSH >2.5 mIU/L | 0.81 | 0.58 | 0.23 | 0.15–0.31 | 5.14 | <0.001 |
Table 10: Pairwise comparison of AUCs between the combined model and individual predictors using DeLong’s test. Pairwise comparison of area under the receiver operating characteristic curves (AUCs) between the combined multivariate model and each individual predictor using DeLong’s nonparametric method for correlated ROC curves. ΔAUC represents the difference in AUC between the combined model and the individual predictor. A two-sided p-value < 0.05 indicates a statistically significant difference. Abbreviations: CI = confidence interval; TSH = thyroid-stimulating hormone.
| Category | n (%) | CLNM-positive on pathology | Model classification |
| Ultrasound-positive (cN+) | 42 (21.4) | 42 (100) | — |
| Ultrasound-negative (cN0) | 154 (78.6) | 56 (36.4) | — |
| └ High-risk by model (probability ≥0.45) | 41 | 41 (100) | TP: 41 |
| └ Low-risk by model (probability <0.45) | 113 | 15 (13.3) | FN: 15 |
| Overall cohort | 196 (100) | 98 (50.0) | — |
Table 11: Performance of preoperative ultrasound and incremental value of the combined predictive model in detecting central lymph node metastasis. Data are presented as n (%). Ultrasound-positive was defined as the presence of any suspicious central lymph node features on preoperative imaging (short diameter >5 mm, short-to-long diameter ratio <2, absence or eccentric thickening of the lymph node hilum, microcalcification, cystic change, or peripheral blood flow signal). Model high-risk was defined as predicted probability ≥0.45 based on the multivariate logistic regression model. Abbreviations: TP = true positive; FN = false negative.
| Group | Ipsilateral dissection, n (%) | Bilateral dissection, n (%) | Total, n |
| CLNM-positive | 50 (51.0) | 48 (49.0) | 98 |
| CLNM-negative | 70 (71.4) | 28 (28.6) | 98 |
| Overall | 120 (61.2) | 76 (38.8) | 196 |
Table 12: Extent of central compartment (Level VI) lymph node dissection
Extent of central compartment (Level VI) lymph node dissection in the matched cohort. Data are presented as n (%). Ipsilateral dissection indicates unilateral central compartment dissection; bilateral dissection indicates bilateral central compartment dissection. CLNM: central lymph node metastasis. Percentages were calculated based on the total number of patients in each group (n = 98 for CLNM-positive, n = 98 for CLNM-negative, and n = 196 for the overall cohort).
Supplementary File 1: Raw data. Please click here to download this file.
Discussie
Accurate preoperative prediction of CLNM in PTC patients remains a persistent challenge in thyroid surgery, directly influencing the debate over prophylactic central neck dissection in cN0 patients. This study employed PSM, GEE, sensitivity analyses, and mediation analysis to evaluate preoperative predictors of CLNM. Our results identified four independent predictors—tumor maximum diameter >1 cm, capsular contact, microcalcification, and serum TSH >2.5 mIU/L—with a combined model AUC of 0.81 (95% CI: 0.75–0.87), supporting the hypothesis that integrated clinical and ultrasound variables provide effective preoperative risk stratification.
Tumor maximum diameter emerged as the most robust predictor, with an adjusted OR of 3.26 (95% CI: 1.61–6.61), consistent across all analyses and subgroups. This aligns with previous reports identifying diameter as an independent risk factor for CLNM and extrathyroidal extension, with AUCs ranging from 0.818 to 0.86458,59. For microcarcinoma (≤1 cm), our subgroup analysis showed that capsular contact and microcalcification retained predictive value while TSH did not, suggesting that local anatomical factors may play a more dominant role in smaller tumors than systemic endocrine parameters. Capsular contact, reflecting local invasiveness, demonstrated a dose-response relationship (OR = 2.48 per severity level, 95% CI: 1.35–4.56) when re-categorized into three grades, reinforcing findings from prior studies60. These results highlight that once a tumor contacts or breaches the capsule, it gains direct access to the central lymphatic network—a biological rationale that explains the elevated CLNM risk even in small tumors.
Microcalcification showed an independent OR of 2.64 (95% CI: 1.28–5.46), consistent with meta-analysis estimates (pooled OR = 3.25, 95% CI: 2.42–4.36)61 and previous reports62,63.Our mediation analysis revealed that approximately 32.7% of the statistical association between microcalcification and CLNM was mediated through tumor diameter (Bootstrap 95% CI: 0.06–0.66). This finding suggests that microcalcification may reflect tumor characteristics associated with both larger diameters and higher metastatic potential; however, given the retrospective design, this mediation pathway should be interpreted as a statistical association rather than evidence of a causal mechanism. The clinical implication is that for patients with microcalcification but a small tumor diameter (≤1 cm), careful risk stratification remains warranted. TSH >2.5 mIU/L was a significant predictor in the main model, but lost significance when the cutoff was raised to 4.0 mIU/L. This sensitivity to cutoff selection is consistent with the variable results reported in the literature52,64 suggesting that TSH should be used as an adjunctive rather than a standalone criterion.
A major strength of this study is its multi-layered statistical strategy. PSM balanced 12 baseline covariates (all SMD <0.1), effectively reducing confounding; GEE confirmed robustness to clustering effects (QIC = 245.6); sensitivity analyses consistently supported the primary findings; and bootstrap internal validation (1,000 iterations) yielded an optimism-corrected AUC of 0.79 with a shrinkage factor of 0.86, indicating acceptable model stability. Importantly, our analysis revealed that while preoperative ultrasound identified suspicious central lymph nodes in only 21.4% of patients, the combined model was able to identify 73.2% of occult CLNM cases among ultrasound-negative patients. This finding highlights a key clinical utility of the predictive model: it can “rescue” a substantial proportion of patients with occult central lymph node metastasis who would otherwise be classified as low-risk based on ultrasound alone. In the context of the ongoing debate over prophylactic central neck dissection in cN0 patients5,6, this incremental diagnostic gain supports the use of the model as a decision-support tool to refine patient selection for surgery, potentially reducing both under-treatment of high-risk patients and over-treatment of truly low-risk individuals.
The limitations of this study should be acknowledged. Its single-center retrospective design may introduce selection bias and limit generalizability. Although bootstrap validation suggests acceptable internal validity, external validation in independent cohorts is essential to confirm the model’s transportability. The sample size, while adequate for the main analysis, limited subgroup power, particularly in the microcarcinoma analysis. The absence of novel ultrasound techniques (contrast-enhanced ultrasound, elastography) and molecular markers such as BRAF V600E, both shown to enhance predictive performance65, represents another limitation. Additionally, the optimal TSH cutoff remains uncertain, as our sensitivity analysis suggested fluctuation around 2.5 mIU/L without establishing a definitive threshold.
Despite these limitations, our findings have practical implications for clinical decision-making. For cN0 patients with any positive ultrasound sign (tumor >1 cm, capsular contact, or microcalcification), the CLNM risk is significantly elevated; those with two or more signs have a predicted probability exceeding 70%, which would support considering pCND in the shared decision-making process. For microcarcinoma patients without capsular contact or microcalcification, conservative follow-up may be considered. Future studies should prioritize multicenter prospective cohort studies incorporating advanced ultrasound techniques and BRAF V600E testing to develop more comprehensive prediction models with external validation; machine learning approaches integrating radiomics and clinical data65; and clinical trials to validate whether model-guided decisions reduce surgical complications without increasing recurrence risk in cN0 PTC patients. Until then, the four predictors identified in this study offer a practical, evidence-based framework for preoperative risk stratification in routine clinical practice. Additionally, as Zhou et al. (2023) have demonstrated, the superior performance of deep learning models in predicting CLNM66, future work should explore such approaches to further refine risk stratification.
Openbaarmakingen
The authors declare that they have no financial conflicts of interest.
Dankbetuigingen
Natural Science Pre-Research Fund of Jiujiang First People’s Hospital(Grant No.JYYY2024001).
Materialen
| Naam | Bedrijf | Catalogusnummer | Opmerkingen |
|---|---|---|---|
| 10% neutral buffered formalin | Sigma-Aldrich | HT501128 | Tissue fixation |
| Color Doppler ultrasound diagnostic system (Voluson E10) | GE Healthcare | 20158 | Main ultrasound system for preoperative examination |
| Constant temperature water bath (SUB Aqua 18) | Grant Instruments | SUB Aqua 18 | Flattening of tissue sections |
| Cover slips | Thermo Fisher Scientific | 125410 | Coverslipping |
| Drying oven (UN55) | Memmert | UN55 | Drying of slides |
| Eosin | Sigma-Aldrich | E4009 | HE staining – cytoplasmic staining |
| Ethanol | Sigma-Aldrich | 459836 | HE staining – hydration/dehydration |
| Fully automatic chemiluminescence immunoassay analyzer (ADVIA Centaur XP) | Siemens Healthcare Diagnostics Inc. | STEM-CTEPO-0045-ZJF | For serum TSH measurement |
| Fully automatic chemiluminescence immunoassay analyzer (CL-6000i) | Shenzhen Mindray Biomedical Electronics Co., Ltd. | V277197 | For TgAb and TPOAb measurement |
| Fully automatic rotary microtome (RM2255) | Leica Biosystems | 63565 | Sectioning of paraffin-embedded tissues |
| Hematoxylin | Sigma-Aldrich | H9627 | HE staining – nuclear staining |
| Histology paraffin (melting point 56–58 °C) | Leica Biosystems | 39601006 | Tissue embedding |
| Hydrochloric acid | Sigma-Aldrich | 320331 | Differentiation |
| ML6-15 high-frequency linear array probe | General Electric Company (GE Healthcare) | N/A | obtain the best resolution for superficial tissues |
| Nerve monitoring device (NIM-Response 3.0) | Medtronic | 8229701 | Intraoperative recurrent laryngeal nerve monitoring |
| Neutral gum | Sigma-Aldrich | 100496 | Mounting |
| Non-removable glass slides | Thermo Fisher Scientific | 4951PLUS | Tissue section adhesion |
| Refrigerated centrifuge (5810R) | Eppendorf | 5810R | Serum separation |
| Statistical software | IBM Corp. | version 26.0; RRID:SCR_016479 | statistical analysis |
| TgAb detection kit | Shenzhen Mindray Biomedical Electronics Co., Ltd. | 20152400843 | Indirect chemiluminescence method |
| TPOAb detection kit | Shenzhen Mindray Biomedical Electronics Co., Ltd. | 20152400845 | Indirect chemiluminescence method |
| TSH detection kit (ADVIA Centaur TSH3-Ultra II) | Siemens Healthcare Diagnostics Inc. | 21279174; RRID:AB_3740175 | double-antibody sandwich chemiluminescence |
| Ultrasound coupling agent (Aquasonic 100) | Parker Laboratories | January 1st | Ultrasound examination |
| Vacuum blood collection tube (no anticoagulant) | BD | 367955 | Blood collection for serum |
| Xylene | Sigma-Aldrich | 534056 | HE staining – deparaffinization |
Referenties
- Francis DO, et al. Overdiagnosis of papillary thyroid cancer. JAMA Netw Open. 2026;9(2):e2559852.
- Lei W, Qiang J, Yi C, Wang M. Global epidemiology of thyroid cancer: trends in incidence, mortality, and DALYs from 1990 to 2021. Open Med (Wars). 2026;21(1):20251322.
- Seib CD, Sosa JA. Evolving understanding of the epidemiology of thyroid cancer. Endocrinol Metab Clin North Am. 2019;48(1):23–35.
- Kuenstner W, Alzedaneen Y, Burman KD. Update in papillary thyroid cancer. Endocrinol Metab Clin North Am. 2025;54(3):329–340.
- Bakkar S, et al. Verifying the oncologic rationale of prophylactic central compartment neck dissection in the management of papillary thyroid carcinoma using a pathologic spectrum of nodal metastases characteristics. A prospective comparative study. Endocrine. 2025;89(1):119–124.
- Yang J, et al. Prophylactic central neck dissection for cN0 papillary thyroid carcinoma: is there any difference between western countries and China? A systematic review and meta-analysis. Front Endocrinol (Lausanne). 2023;14:1176512.
- Yan XQ, et al. Prophylactic central neck dissection for cN1b papillary thyroid carcinoma: a systematic review and meta-analysis. Front Oncol. 2022;11:803986.
- Wang Y, et al. The effectiveness and safety of prophylactic central neck dissection in clinically node-negative papillary thyroid carcinoma patients: a meta-analysis. Front Endocrinol (Lausanne). 2022;13:1094012.
- Zhu H, et al. Development and validation of a clinical predictive model for high-volume lymph node metastasis of papillary thyroid carcinoma. Sci Rep. 2024;14(1):15828.
- Zhao Y, et al. Predictive models for contralateral occult thyroid carcinoma and central lymph node metastasis in unilateral multifocal papillary thyroid carcinoma based on ultrasound. Quant Imaging Med Surg. 2026;16(1):37.
- Zheng Y, et al. Preoperative prediction of central lymph node metastasis in follicular variant of papillary thyroid carcinoma using clinical and ultrasound features. Gland Surg. 2024;13(6):812–824.
- Wu Y, Wang J, Liu Q. [Predictors for central lymph node metastases in papillary thyroid microcarcinoma]. Lin Chuang Er Bi Yan Hou Tou Jing Wai Ke Za Zhi. 2020;34(10):955–957.
- He X, et al. Risk prediction model for cervical lymph node metastasis of papillary thyroid microcarcinoma: a systematic review and meta-analysis. Front Endocrinol (Lausanne). 2025;16:1709773.
- Zhou SL, et al. Predicting factors of central lymph node metastasis and BRAF V600E mutation in Chinese population with papillary thyroid carcinoma. World J Surg Oncol. 2021;19(1):211.
- Mao A, et al. Association between preoperative serum TSH and tumor status in patients with papillary thyroid microcarcinoma. Endocrine. 2021;73(3):617–624.
- Ito Y, et al. Thyroid-stimulating hormone, age, and tumor size are risk factors for progression during active surveillance of low-risk papillary thyroid microcarcinoma in adults. World J Surg. 2023;47(2):392–401.
- Jia W, Cai Y, Wang S, Wang J. Predictive value of an ultrasound-based radiomics model for central lymph node metastasis of papillary thyroid carcinoma. Int J Med Sci. 2024;21(9):1701–1709.
- Li N, et al. Nomogram including elastography for prediction of contralateral central lymph node metastasis in solitary papillary thyroid carcinoma preoperatively. Cancer Manag Res. 2020;12:10789–10797.
- Gharib H, et al. American Association of Clinical Endocrinologists, American College of Endocrinology, and Associazione Medici Endocrinologi medical guidelines for clinical practice for the diagnosis and management of thyroid nodules—2016 update appendix. Endocr Pract. 2016;22(Suppl 1):1–60.
- Kuzan TY, Canbey Goret C. Comparison of number of passes and cytopathological specimen adequacy for thyroid fine-needle aspiration biopsy in the absence of an on-site pathologist. Eur Thyroid J. 2020;9(1):49–54.
- Haugen BR, et al. 2015 American Thyroid Association management guidelines for adult patients with thyroid nodules and differentiated thyroid cancer: the American Thyroid Association Guidelines Task Force on Thyroid Nodules and Differentiated Thyroid Cancer. Thyroid. 2016;26(1):1–133.
- Cibas ES, Ali SZ. The 2017 Bethesda System for Reporting Thyroid Cytopathology. Thyroid. 2017;27(11):1341–1346.
- Basolo F, Macerola E, Poma AM, Torregrossa L. The 5th edition of WHO classification of tumors of endocrine organs: changes in the diagnosis of follicular-derived thyroid carcinoma. Endocrine. 2023;80(3):470–476.
- Khafif A, Yosef LM. Para-tracheal neck dissection—is dissection of the upper part of level VI necessary? World J Otorhinolaryngol Head Neck Surg. 2020;6(3):171–175.
- Karvounis E, et al. Papillary thyroid carcinoma micro-deposits in cervical lymph nodes without intra-thyroid malignancy: a comment in consideration of the latest American Thyroid Association guidelines. Mol Clin Oncol. 2021;15(2):164.
- Chen L, et al. The value of ultrasonographic scoring method and nomogram in assessing cervical lymph node metastasis of papillary thyroid carcinoma. Thyroid Res. 2025;18(1):36.
- Zhang M, et al. Prediction of contralateral central lymph node metastasis in unilateral papillary thyroid carcinoma based on radiomics. Sci Rep. 2025;15(1):21948.
- Hoang JK, et al. Interobserver variability of sonographic features used in the American College of Radiology Thyroid Imaging Reporting and Data System. AJR Am J Roentgenol. 2018;211(1):162–167.
- Alyami J, et al. Interobserver variability in ultrasound assessment of thyroid nodules. Medicine (Baltimore). 2022;101(41):e31106.
- Caturegli P, De Remigis A, Rose NR. Hashimoto thyroiditis: clinical and diagnostic criteria. Autoimmun Rev. 2014;13(4–5):391–397.
- Durante C, et al. 2023 European Thyroid Association clinical practice guidelines for thyroid nodule management. Eur Thyroid J. 2023;12(5):e230067.
- Moon S, et al. Associations between Hashimoto thyroiditis and clinical outcomes of papillary thyroid cancer: a meta-analysis of observational studies. Endocrinol Metab (Seoul). 2018;33(4):473–484.
- Wang W, et al. Preoperative thyroid peroxidase antibody predicts recurrence in papillary thyroid carcinoma: a consecutive study with 5,770 cases. Front Oncol. 2022;12:881024.
- Bahçecioğlu AB, Erdem M. A new perspective on anti-thyroglobulin antibody patterns in the follow-up of papillary thyroid carcinoma. Endocrinol Res Pract. 2025;29(4):320–326.
- Wei M, et al. Clinical characteristics and risk analysis of lymph node metastasis in patients with cN0 differentiated thyroid carcinoma. Sci Rep. 2026;16(1):8792.
- Zhang C, et al. Construction of a diagnostic model for lymph node metastasis of the papillary thyroid carcinoma using preoperative ultrasound features and imaging omics. J Healthc Eng. 2022;2022:1872412.
- Weng L. Role of ultrasound-guided fine-needle aspiration cytology combined with thyroid peroxidase and thyroglobulin antibodies in evaluating cervical lymph node metastasis in thyroid cancer. Oncol Lett. 2024;28(5):512.
- Zhong L, et al. Development and validation of a prediction model for lymph node metastasis in thyroid cancer: integrating deep learning and radiomics features from intra- and peri-tumoral regions. Gland Surg. 2025;14(7):1272–1282.
- Chen Y, et al. A model predicting occult metastases in lateral lymph nodes in pN1a stage papillary thyroid cancer. Int J Gen Med. 2025;18:4279–4290.
- Kim MJ, et al. US-guided fine-needle aspiration of thyroid nodules: indications, techniques, results. Radiographics. 2008;28(7):1869–1886**; discussion 1887**.
- Agrawal N, et al. Indications and extent of central neck dissection for papillary thyroid cancer: an American Head and Neck Society consensus statement. Head Neck. 2017;39(7):1269–1279.
- Xu V, Renslo B, Cottrill EE. Central neck dissection: updates on indications and surgical technique. Oper Tech Otolaryngol Head Neck Surg. 2024;35(4):331–337.
- Smallridge RC, et al. American Thyroid Association guidelines for management of patients with anaplastic thyroid cancer. Thyroid. 2012;22(11):1104–1139.
- Uludağ M, Tanal M, İşgör A. Standards and definitions in neck dissections of differentiated thyroid cancer. Sisli Etfal Hastan Tip Bul. 2018;52(3):149–163.
- Hijioka H, Tabata H. Combination of ultrasonography and MRI for preoperative prediction of lymph node metastasis in tongue squamous cell carcinoma: an exploratory study. PLoS One. 2026;21(1):e0340884.
- Liu X, et al. Development and validation of a multidimensional machine learning-based nomogram for predicting central lymph node metastasis in papillary thyroid microcarcinoma. Gland Surg. 2025;14(3):344–357.
- Title M, et al. Joint pain, physical function, and balance self-confidence in acromegaly versus nonfunctioning pituitary adenoma patients. Eur J Endocrinol. 2023;189(2):156–163.
- Besler E, et al. The relationship of clinicopathological factors of the tumor with preoperative TSH level in papillary thyroid cancers. Eurasian J Med. 2019;51(1):8–11.
- Mullur R, Liu YY, Brent GA. Thyroid hormone regulation of metabolism. Physiol Rev. 2014;94(2):355–382.
- Tajmir SH, Alkasab TK. Toward augmented radiologists**: changes in radiology education in the era of machine learning and artificial intelligence**. Acad Radiol. 2018;25(6):747–750.
- Genders TS, et al. Methods for calculating sensitivity and specificity of clustered data: a tutorial. Radiology. 2012;265(3):910–916.
- Zheng T, et al. Combined clinicopathological and ultrasonographic features for predicting extrathyroidal extension in thyroid cancer. Quant Imaging Med Surg. 2026;16(5):359.
- Preacher KJ, Hayes AF. SPSS and SAS procedures for estimating indirect effects in simple mediation models. Behav Res Methods Instrum Comput. 2004;36(4):717–731.
- Preacher KJ, Hayes AF. Asymptotic and resampling strategies for assessing and comparing indirect effects in multiple mediator models. Behav Res Methods. 2008;40(3):879–891.
- Lee H, et al. A guideline for reporting mediation analyses of randomized trials and observational studies**: the AGReMA statement**. JAMA. 2021;326(11):1045**–1056**.
- DeLong ER, DeLong DM, Clarke-Pearson DL. Comparing the areas under two or more correlated receiver operating characteristic curves: a nonparametric approach. Biometrics. 1988;44(3):837–845.
- Hanley JA, McNeil BJ. The meaning and use of the area under a receiver operating characteristic (ROC) curve. Radiology. 1982;143(1):29–36.
- Ruan Z, Chen Y, Zhou J, Ma B. Clinical significance of multimodal ultrasound features in predicting cervical lymph node metastasis in papillary thyroid carcinoma with cystic change. Quant Imaging Med Surg. 2026;16(4):295.
- Zha X, et al. The risk stratification of papillary thyroid cancer with Bethesda category III (atypia of undetermined significance/follicular lesion of undetermined significance) by thyroid fine-needle aspiration could be assisted by tumor size for precision treatment. Front Endocrinol (Lausanne). 2022;13:822423.
- Yu M, et al. Positive preoperative circulating tumor cells level associated with lymph node metastasis in papillary thyroid carcinoma patients with capsular invasion. World J Surg Oncol. 2025;23(1):190.
- Wang Z, et al. Clinical and ultrasonic risk factors for high-volume central lymph node metastasis in cN0 papillary thyroid microcarcinoma: a retrospective study and meta-analysis. Clin Endocrinol (Oxf). 2023;98(4):609–621.
- Wu L, et al. Application of ultrasound elastography and radiomic for predicting central cervical lymph node metastasis in papillary thyroid microcarcinoma. Front Oncol. 2024;14:1354288.
- Chen H, et al. Prediction model of cervical lymph node metastasis in papillary thyroid carcinoma. Cancer Control. 2024;31:10732748241295347.
- Hsieh YS, Yang TT, Hsu CH, Lin YY. Association between thyroid profile levels and lymph node metastasis in papillary thyroid carcinoma: a retrospective study. Reports (MDPI). 2024;7(3):78.
- Chang L, et al. An integrated nomogram combining deep learning, clinical characteristics and ultrasound features for predicting central lymph node metastasis in papillary thyroid cancer: a multicenter study. Front Endocrinol (Lausanne). 2023;14:964074.
- Zhou LQ, et al. Deep learning predicts cervical lymph node metastasis in clinically node-negative papillary thyroid carcinoma. Insights Imaging. 2023;14(1):222.