Het voorgestelde Low-Voltage Acceptance Automation Platform integreert het Internet of Things (IoT), visuele workflow-orkestratie, edge- en cloudcomputing, feature engineering en machine learning om de acceptatietests van laagspanningssystemen (LV) te automatiseren. Het platform maakt intelligente foutdetectie, real-time besluitvorming, geautomatiseerde acceptatie, hoge nauwkeurigheid, lage operationele latentie en schaalbare implementatie mogelijk.
Een abonnement op JoVE is vereist om deze inhoud te bekijken. Log in of start vandaag met uw gratis proefperiode.
Onderzoeksartikel
Een procesgestuurd automatiseringsplatform voor laagspanningsacceptatie met visuele workflow-orkestratie en validatie via machine learning
In dit artikel
Samenvatting
Samenvatting
De snelle uitbreiding van laagspanningsnetten (LV-netten) en hun integratie met gedistribueerde energiebronnen vereisen intelligente en geautomatiseerde beheeroplossingen. Cloud-edge collaboratieve Internet of Things (IoT)-platforms ondersteunen real-time monitoring, besturing en gegevensverwerving. Bestaande platforms missen echter over het algemeen workflowautomatisering, visuele procesorchestratie, gebruikersgestuurde beslissingsondersteuning en uitgebreide validatie. Bijgevolg bieden ze geen procesgestuurde oplossingen voor de geautomatiseerde acceptatietests van LV-netten. Deze studie presenteert het ontwerp en de evaluatie van een Low-Voltage Acceptance Automation Platform op basis van een gevisualiseerd procescanvas. Het voorgestelde platform hanteert een procesgestuurde architectuur waarin acceptatieworkflows visueel worden gecreëerd, beheerd en uitgevoerd. Het visuele procescanvas transformeert conventionele statische monitoring in dynamische workflowautomatisering door real-time uitvoering, validatie en besluitvorming van de workflow mogelijk te maken. Het framework maakt gebruik van de Open LV Network & Smart Meter-dataset om realistische modellering van het elektrische lastgedrag te ondersteunen. De workflow omvat IoT-gebaseerde gegevensverwerving, gegevensvoorbewerking, feature engineering, workfloworchestratie met behulp van het visuele procescanvas, validatie op basis van machine learning en real-time visualisatie via een dashboard. Het voorgestelde framework behaalde een foutdetectieratio van 98,4%, een receiver operating characteristic area under the curve (ROC-AUC) van 0,968 en een operationele beslissingslatentie van 31 ms, waarmee het ongeveer 30%–40% beter presteerde dan traditionele cloud-centrische en IoT-gebaseerde baseline-benaderingen.
Inleiding
Industrie 4.0 (I4.0)1 wordt mogelijk gemaakt door verschillende opkomende technologieën, waaronder het Industrial Internet of Things (IIoT) een van de belangrijkste is. IIoT verwijst naar de toepassing van Internet of Things (IoT)-technologieën in industriële omgevingen, waar onderling verbonden apparaten en machines voornamelijk communiceren via machine-to-machine-interacties. Omdat storingen in industriële systemen kunnen leiden tot aanzienlijke operationele verliezen, vereisen IIoT-applicaties een zeer betrouwbare communicatie, terwijl ze aanzienlijk grotere volumes aan gegevens genereren dan conventionele IoT-systemen2. Daarnaast beschouwen sommige studies IIoT als een concept dat nauw verwant is aan Industrie 4.03. IoT-technologieën transformeren traditionele hiërarchische architecturen door flexibelere systemen met naadloze gegevensuitwisseling mogelijk te maken4. Talrijke recente studies hebben bestaande IIoT-architecturen beoordeeld en nieuwe raamwerkontwerpen voorgesteld5,6,7,8,9. Ondanks deze ontwikkelingen blijven er twee belangrijke beperkingen bestaan. Ten eerste worden er frequent nieuwe raamwerken voorgesteld om de tekortkomingen van eerdere architecturen te overwinnen, wat resulteert in een groeiend aantal alternatieve modellen die de architecturale diversiteit en de implementatiecomplexiteit verhogen. Ten tweede beperkt het hoge abstractieniveau dat gepaard gaat met veel voorgestelde architecturen de praktische adoptie ervan in industriële omgevingen10.
Verschillende IIoT-architecturen zijn in de literatuur beschreven. Een IIoT-architectuur gebaseerd op de Open Platform Communications (OPC)-standaard werd gepresenteerd in samen met een Python-middleware voor het beheren van OPC-communicatie11. Een zevenlaagse IIoT-architectuur werd voorgesteld in; implementatiedetails en validatie-experimenten werden echter niet verstrekt12. Een raamwerk dat 5G- en IIoT-technologieën integreert, werd beschreven in samen met een representatieve use case, hoewel de experimentele validatie beperkt was13. Een framework voor emotioneel ontwerp voor Industrie 4.0 werd geïntroduceerd, en de potentiële implicaties hiervan werden besproken zonder experimentele verificatie14. Een meerlaags IIoT-platform werd geëvalueerd in een real-world testbed in, met de nadruk op telecommunicatie-overwegingen15. Op soortgelijke wijze werd een modulair IoT-raamwerk voor het monitoren van de binnenluchtkwaliteit gepresenteerd in en werd de prestatie ervan geëvalueerd aan de hand van gegevens verzameld uit 84 huishoudens met kinderen16.
Het Internet of Things (IoT) is een snel evoluerende technologie geworden met aanzienlijk potentieel voor toepassing in de elektrosector17,18. De integratie van IoT-technologieën in knooppunten van energiesystemen maakt intelligentere en efficiëntere energieopwekking, transmissie, distributie, exploitatie en benutting mogelijk via autonome besluitvorming, ondersteund door continue real-time monitoring van de elektriciteitsstroom binnen het smart grid. Bijgevolg verbeteren deze intelligente knooppunten de algehele operationele prestaties van het elektrische netwerk19. Communicatietechnologie vormt een fundamenteel onderdeel van de implementatie van smart grids, omdat twee hoofdcategorieën informatie betrouwbaar moeten worden verzonden: sensormetingen en controlesignalen. Naast een lage communicatielatentie vereisen smart grid-toepassingen een passende kwaliteit van dienstverlening (QoS) en adequate gegevensbeveiliging om een betrouwbare werking te garanderen20.
Voor het selecteren van een geschikte communicatietechnologie voor smart grid-toepassingen moet rekening worden gehouden met communicatie-intervallen, datatransmissiesnelheden en communicatiekosten21. IoT-communicatienetwerken bestaan doorgaans uit software-, beveiligings-, service-, systeem- en connectiviteitslagen. Binnen de connectiviteitslaag worden communicatieprotocollen over het algemeen ingedeeld in drie categorieën. Langeafstandsprotocollen omvatten Long Range (LoRa) en Narrowband-IoT (NB-IoT); middellange afstandsprotocollen omvatten Wi-Fi, 4G/LTE en 5G; en korte afstandsprotocollen omvatten Bluetooth en ZigBee. Naarmate elektriciteitsmarkten steeds meer gedereguleerd zijn geworden, is belastingvoorspelling belangrijker geworden voor het evalueren van de effecten van weersomstandigheden, apparatuurstoringen, regelgevende wijzigingen en andere operationele factoren op de kosten van elektriciteitsdiensten. Bijgevolg is een nauwkeurige voorspelling van de residentiële belasting essentieel geworden voor de exploitatie en supervisie van smart grids, microgrids en slimme gebouwen22.
De betrouwbare werking van laagspanningsnetten (LV) is afhankelijk van het behoud van een hoge vermogenskwaliteit23. De vermogenskwaliteit wordt bepaald door de effectiviteit van de spanningsregeling, de stroombalans en de beperking van technische storingen onder ongebalanceerde bedrijfsomstandigheden24. Van deze factoren is fasebalancering bijzonder belangrijk, omdat deze de uniforme verdeling van spanningen en stromen over de fasen bepaalt25. Een slechte fasebalancering kan leiden tot een toename van geleideropwarming, spanningsafwijkingen en nulstroom, waardoor de systeemefficiëntie en de operationele betrouwbaarheid afnemen26. Bijgevolg moet fasebalancering tijdens het ontwerpproces worden overwogen om de systemprestaties, de operationele stabiliteit en de betrouwbaarheid op lange termijn te verbeteren. Desondanks wordt dit aspect zelden opgenomen in conventionele ontwerpmethodologieën voor mini-grids.
Recente vooruitgangen in workflow-orchestratiesystemen hebben de voordelen aangetoond van event-driven automatisering en visueel procesbeheer binnen industriële IoT-omgevingen. Desondanks blijft hun toepassing voor de validatie van distributienetwerken en acceptatietests voor laagspanningsinstallaties beperkt. De meeste bestaande laagspanningsautomatiseringssystemen richten zich primair op monitoring en supervisie, terwijl relatief weinig studies workflow-gestuurd acceptatiemanagement of geautomatiseerde complianceverificatie onderzoeken. In dezelfde zin hebben machinelearningtechnieken aanzienlijke aandacht gekregen voor de detectie van anomalieën in slimme meters en de beoordeling van de elektriciteitskwaliteit, maar deze benaderingen worden over het algemeen ontwikkeld als onafhankelijke analytische modellen in plaats van als componenten van een geïntegreerd workflow-orchestratieraamwerk.
In recente jaren zijn diverse slimme energiemeteroplossingen voorgesteld voor slim gebouwbeheer en huisautomatisering27. In referentie27 werd een prototype van een slimme meter gepresenteerd om de integratie van educatieve concepten op universitair niveau in slimme meteringtechnologieën te demonstreren. De ontwikkelde slimme meter vertoonde een aanzienlijk potentieel voor energiemanagement en -beheersing, waardoor het energieverbruik werd verminderd en zowel nutsbedrijven als consumenten profiteerden van bidirectionele IoT-communicatie. Vervolgens werd een op een microcontroller gebaseerd slim stekkersysteem geïntroduceerd om intelligente energiemonitoring te ondersteunen28.
Het voorgestelde smart plug-systeem toont het stroomverbruik in realtime via een grafische gebruikersinterface op basis van Android. Daarnaast kan het apparaat de aanwezigheid van aangesloten elektrische apparaten detecteren, een functionaliteit die invasieve belastingsmeting wordt genoemd28. Voor de implementatie werd een goedkope commerciële smart plug gebruikt. Toekomstige verbeteringen omvatten het monitoren van de effectieve stroom (RMS), het actieve vermogen, het reactieve vermogen en de fasehoek tussen spanning en stroom. Zoals beschreven in onze eerdere studies maakt een gedeeltelijk netgekoppeld fotovoltaïsch microgrid gebruik van ZigBee- en LoRa-communicatieprotocollen om informatie uit te wisselen met slimme meters, wat de haalbaarheid aantoont van IoT-ondersteunde communicatie voor gedistribueerde energiesystemen29,30.
Om de beperkingen van conventionele planning van distributiesystemen aan te pakken, zijn de technische praktijk en het wetenschappelijk onderzoek in verschillende complementaire richtingen gevorderd. Eén onderzoeksrichting heeft zich gericht op planning op hoog niveau met behulp van geografische informatiesystemen (GIS) voor locatiekeuze en voorlopige hulpbronnenbeoordeling31,32. Een andere richting heeft zich geconcentreerd op het verbeteren van individuele componenten en subsystemen, waaronder de selectie van geleiders, optimale dimensionering van opwekking en energieopslag, en vergelijkende evaluaties van wisselstroom- (AC) en gelijkstroom- (DC) distributiesystemen33,34,35,36. Een derde onderzoeksrichting heeft optimalisatiealgoritmen toegepast op de planning van distributienetwerken, de routering van voedingslijnen en het ontwerp van de nettopologie. Recente ontwikkelingen omvatten frameworks zoals het uGrid-platform van de onderzoekers, dat apparaatplaatsing en netwerkconfiguratie integreert, maar een standaard vermogensstroomanalyse voor verificatie en optimalisatie mist. Andere benaderingen vertrouwen op handmatige parameterinstelling voor topologiegeneratie of richten zich op gespecialiseerde toepassingen zoals laagvermogen DC-microgrids37,38,39. Hoewel deze benaderingen een aanzienlijke vooruitgang vertegenwoordigen, is verder werk nodig om een geïntegreerde methodologie vast te stellen voor het end-to-end ontwerp van laagspanningsdistributiesystemen. Bovendien blijven uitgebreide techno-economische evaluaties van éénfasige, driefasige en hybride laagspanningssystemen beperkt.
Recente vorderingen in kunstmatige intelligentie (AI) en machine learning hebben de mogelijkheden van intelligente energiesystemen verder uitgebreid. Een uitgebreid overzicht presenteerde samengevatte AI- en machine learning-toepassingen in slimme netten, inclusief opkomende technologieën zoals Federated Learning, Generatieve AI, Large Language Models, Artificial Intelligence of Things (AIoT) en Digital Twins40. Het overzicht belichtte toepassingen in lastvoorspelling, voorspellend onderhoud, anomaliedetectie, vraaggestuurd beheer en de integratie van elektrische voertuigen, terwijl de nadruk lag op aanhoudende uitdagingen met betrekking tot interoperabiliteit, privacy, schaalbaarheid, robuustheid en ethische overwegingen. Een andere recente review evalueerde AI-methoden voor gedistribueerd energiemanagement in IoT-edge-cloud-infrastructuren, met de focus op machine learning, reinforcement learning en multi-agent-systemen voor decentrale energiecontrole41.
Collectief hebben eerdere studies IoT-gestuurde monitoring, slimme metering, cloud-edge computing, kunstmatige intelligentie en intelligent energiemanagement voor laagspanningsdistributiesystemen (LV) verder ontwikkeld. Echter, deze technologieën zijn grotendeels onafhankelijk van elkaar ontwikkeld. Workflow-orchestratie, geautomatiseerd acceptatiemanagement, procesgestuurde validatie en geïntegreerde beslissingsondersteuning blijven beperkt, wat de noodzaak benadrukt voor een uniform, workflow-georiënteerd automatiseringsraamwerk.
Hiertoe presenteert deze studie een automatiseringsplatform voor de acceptatie van laagspanningsnetten op basis van een gevisualiseerd procescanvas. Het voorgestelde raamwerk integreert IoT-gebaseerde gegevensverwerving, gegevensvoorbewerking, feature engineering, workflow-orkestratie, op machine learning gebaseerde validatie, cloud-edge computing en real-time visualisatie binnen een uniforme architectuur om geautomatiseerde en betrouwbare acceptatietesten van LV-netten te ondersteunen met behulp van smart-metergegevens uit de praktijk. Figuur 1 geeft een overzicht van de workflow-georiënteerde architectuur van het voorgestelde platform. De workflow omvat gegevensverwerving, voorbewerking, feature engineering, workflow-orkestratie, intelligente besluitvorming en cloud-edge-integratie, wat geautomatiseerde validatie van LV-distributienetten mogelijk maakt via een procesgeoriënteerd raamwerk. Het platform demonstreerde een hoge validatienauwkeurigheid, terwijl de latentie van operationele besluitvorming en de uitvoeringstijd van de workflow werden verminderd in vergelijking met conventionele benaderingen.
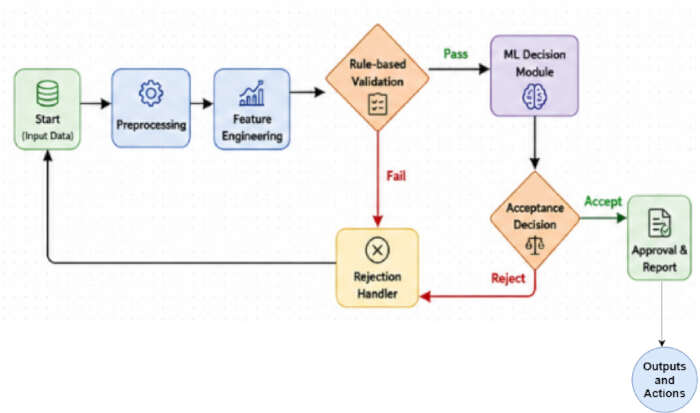
Figuur 1. Workflow-georiënteerde architectuur van het voorgestelde automatiseringsplatform voor laagspanningsacceptatie. Hoogwaardige architectuur van het voorgestelde procesgestuurde automatiseringsplatform voor laagspanningsacceptatie (LV). Het raamwerk illustreert de sequentiële integratie van IoT-gestuurde gegevensverwerving, gegevensvoorbewerking, feature engineering, workflow-orkestratie, intelligente besluitvorming, cloud-edge samenwerking en geautomatiseerde acceptatie voor de validatie van LV-distributienetwerken. IoT = Internet of Things; LV = laagspanning; ML = machine learning. Klik hier om een grotere versie van deze figuur te bekijken.
Toegang beperkt. Log in of start een proefperiode om deze inhoud te bekijken.
Protocol
This study did not involve human participants, animals, or identifiable personal data. The analyses were performed using a publicly available dataset (UK Power Networks Open LV Network & Smart Meter dataset) together with synthetically generated data for validation; therefore, ethics committee approval and informed consent were not required. The research tools used in the protocol are listed in the Table of Materials.
1. Data acquisition
The Low-Voltage (LV) Acceptance Automation Platform was developed using electrical measurements acquired from smart meters, IoT sensors, and the Open LV Network & Smart Meter Dataset. Electrical parameters, including voltage, current, active power, reactive power, and energy consumption, were collected through Wi-Fi-, PLC-, and RS-485-based communication protocols. Real-time measurements were used for live system monitoring, whereas historical data supported model development and validation.
The proposed framework used the Open LV Network & Smart Meter Dataset provided by UK Power Networks42. The dataset comprises household smart meter consumption, feeder-level load profiles, and feeder voltage measurements. Time-series subsets containing load consumption and voltage data were selected for model training and evaluation. In addition, a simulated smart meter dataset was generated to represent operational conditions and fault scenarios required for workflow validation and machine learning model evaluation. The simulated dataset included timestamped measurements of voltage, current, active power, reactive power, energy consumption, total harmonic distortion (THD), and voltage imbalance. Fault samples were generated by simulating undervoltage, overvoltage, excessive harmonic distortion, and voltage imbalance based on established low-voltage operational thresholds. The dataset characteristics are summarized in Table 1.
| Attribute | Description |
| Dataset Name | Open LV Network & Smart Meter Dataset |
| Simulated Smart Meter Dataset | Geneated 1000 smaples for Fault simulation and workflow validation |
| Data Type | Time-series (historical smart meter data) |
| Data Granularity | Household-level and feeder-level measurements |
| Key Features | Voltage, current, active power, reactive power, energy consumption, timestamps |
| Data Frequency | High-resolution (e.g., half-hourly / minute-level depending on subset) |
| Coverage | Residential low-voltage distribution networks |
| Usage in Proposed Work | Model training, validation, load behavior analysis, and acceptance workflow evaluation |
Table 1: Dataset description. Summary of the Open LV Network & Smart Meter dataset used for model development and performance evaluation. The table presents the dataset components, measured electrical variables, sampling characteristics, and dataset partitioning for training, validation, and testing.
Because the Open LV Network & Smart Meter Dataset does not contain predefined fault labels, a rule-based labeling strategy was applied to both the real and simulated datasets. Samples satisfying normal operating limits were assigned a label of 0 (Normal), whereas samples exceeding operational thresholds (e.g., voltage deviations greater than ±10% of the nominal voltage, THD > 5%, or voltage unbalance > 2%) were assigned a label of 1 (Fault). These labels served as the ground truth during model training, validation, and testing. The proposed rule engine also allows threshold values to be configured in accordance with regional standards or utility-specific acceptance criteria.
The dataset was partitioned into training (70%), validation (15%), and testing (15%) subsets. Missing values were addressed using linear interpolation, mean imputation, and forward-fill techniques as described in the preprocessing stage. To ensure statistical robustness and reproducibility, all experiments were repeated five times using different random seeds.
2. Data preprocessing
Raw data from the Open LV Network & Smart Meter Dataset and IoT sensor measurements were preprocessed to improve data quality prior to feature extraction and model development. Missing values, noise, and inconsistencies caused by communication interruptions and sensor malfunctions were identified and corrected using interpolation, mean imputation, and forward-fill techniques. The detailed mathematical derivations are provided in Supplementary File 1 (Section S1).
The preprocessed time-series data were segmented into representative operational intervals (S₁–S₅ and Sk). Statistical and electrical features, including average load, peak load, minimum load, standard deviation, voltage deviation, and power consumption, were extracted from each segment. The extracted features are summarized in Table 2 and served as inputs for the subsequent feature engineering stage.
| Segment ID | Mean Load (kW) | Peak Load (kW) | Min Load (kW) | Std Deviation (kW) | Voltage Deviation (p.u.) | Power Consumption (kWh) | Time Interval |
| S₁ | 2.45 | 3.8 | 1.2 | 0.65 | 0.032 | 58.4 | 00:00–01:00 |
| S₂ | 2.9 | 4.1 | 1.5 | 0.72 | 0.028 | 64.2 | 01:00–02:00 |
| S₃ | 3.25 | 4.85 | 1.8 | 0.81 | 0.035 | 71.6 | 02:00–03:00 |
| S₄ | 3.8 | 5.2 | 2.1 | 0.9 | 0.041 | 78.9 | 03:00–04:00 |
| S₅ | 4.1 | 5.75 | 2.4 | 0.95 | 0.045 | 85.3 | 04:00–05:00 |
| Sk | 3.6 | 5.1 | 2 | 0.88 | 0.038 | 76.5 | tk |
Table 2: Representative feature representation extracted from time-series segments. Representative statistical, electrical, load behavior, voltage stability, and power quality features extracted from segmented LV time-series data during feature engineering. The values illustrate the engineered feature representation and are not experimental performance results. LF = Load Factor; PAR = Peak-to-Average Ratio; VSI = Voltage Stability Index; PF = Power Factor; THD = Total Harmonic Distortion.
3. Feature engineering
Feature engineering was performed to improve the representation of the preprocessed data for workflow orchestration and intelligent decision-making. Principal Component Analysis (PCA)^43 was applied to reduce data dimensionality by removing redundant and highly correlated variables while retaining the most informative feature components. The mathematical derivations are provided in Supplementary File 1 (Section S2).
Statistical descriptors, load behavior indicators, voltage stability indices, and power quality metrics were derived from the segmented time-series data. These engineered features included Load Factor (LF), Peak-to-Average Ratio (PAR), Voltage Stability Index (VSI), Voltage Unbalance Index, Power Factor (PF), and Total Harmonic Distortion (THD). The resulting feature set was used as the input to the workflow orchestration and intelligent decision-making modules.
The feature engineering workflow is summarized in Supplementary File 1 (Supplementary Algorithm 1). The procedure consisted of segmenting the preprocessed data, extracting statistical and electrical features, calculating load behavior, voltage stability, and power quality indicators, and applying PCA to generate the final feature vector used for model training and validation.
4. Visualized process canvas design
The Visualized Process Canvas was developed as a graph-based workflow orchestration framework for automating low-voltage (LV) acceptance procedures. The workflow was represented as a directed graph, G = (N, E), where N = {n1, n2, …, nm}denotes the workflow nodes corresponding to individual processing stages (e.g., data input, preprocessing, validation, and decision-making), and E = {eij}represents the directed edges defining the execution sequence between nodes. This graph-based representation enabled the creation of configurable workflows and their automated execution without manual coding.
Each workflow node performed a specific processing task by receiving input data, executing predefined operations, and forwarding the processed output to subsequent nodes. Acceptance criteria, including voltage and load thresholds, were implemented as configurable validation rules that could be updated without modifying the workflow structure. The workflow supported both sequential and parallel execution to improve computational efficiency. Machine learning models were integrated into designated workflow nodes to perform anomaly detection and automated acceptance validation (Figure 2).
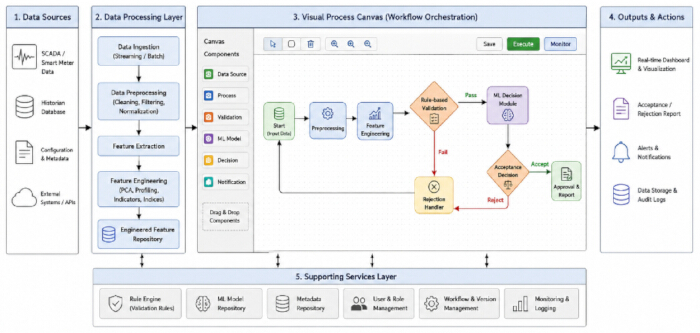
Figure 2: Visualized process canvas architecture for LV acceptance automation. Overview of the visual workflow orchestration framework used for LV acceptance automation. The process canvas illustrates the graphical organization of workflow nodes for data processing, feature engineering, rule-based validation, intelligent decision-making, and output generation to support workflow design, execution, and monitoring. Please click here to view a larger version of this figure.
The mathematical formulation describing information flow through the workflow graph is provided in Supplementary File 1 (Section S3). Supplementary File 1 (Supplementary Algorithm 2) describes the workflow orchestration procedure, including workflow traversal, node execution, rule validation, decision generation, and output aggregation.
The Visualized Process Canvas was implemented using a microservice-oriented software architecture to support scalability and modular deployment. The graphical workflow interface was developed using React.js to provide drag-and-drop workflow configuration. Backend orchestration services were implemented using Flask/FastAPI, while Eclipse Mosquitto served as the MQTT message broker for communication between workflow modules. EdgeX Foundry provided edge device management and IoT integration. Machine learning services were implemented with Scikit-learn, TensorFlow, and PyTorch, and containerized with Docker and Kubernetes.
5. Workflow orchestration engine
The workflow orchestration engine coordinated execution of the configured acceptance workflow. A detailed description is provided in Supplementary File 1 (Section S4), and the execution sequence is summarized in Supplementary Figure 1.
The workflow execution process consisted of validating the workflow definition, initializing the execution environment, scheduling workflow nodes according to their dependencies, executing nodes sequentially or in parallel, applying rule-based validation, aggregating intermediate outputs, and generating the final acceptance or rejection decision based on rule-based and machine learning evaluation. Execution results were published through dashboards, reports, application programming interfaces (APIs), and data storage services. The overall workflow orchestration process is illustrated in Figure 3.
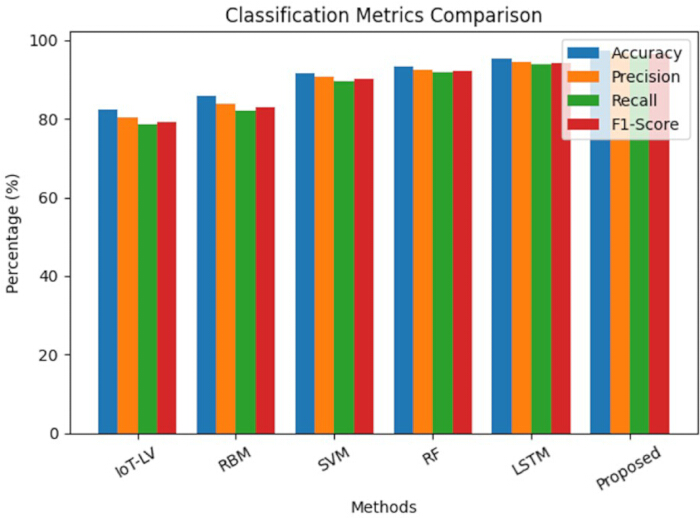
Figure 3: Comparison of classification performance metrics across different methods. Comparison of the classification performance of IoT-LV, RBM, Support Vector Machine (SVM), Random Forest (RF), Long Short-Term Memory (LSTM), and the proposed framework using the Open LV Network & Smart Meter dataset. Performance is evaluated using Accuracy, Precision, Recall, and F1-score. Results are presented as mean ± standard deviation (SD) from five independent experimental runs using a 70%/15%/15% training/validation/testing split. Error bars represent one standard deviation. Please click here to view a larger version of this figure.
6. Intelligent decision module
The Intelligent Decision Module was developed to automate low-voltage (LV) acceptance decisions using supervised machine learning models. Classification and regression algorithms were applied to the engineered feature vectors to support operational decision-making. Classification models identified normal and abnormal operating conditions, whereas regression models estimated future energy consumption and operational trends.
The input feature vector, X ∈ ℝd, comprised the statistical, voltage stability, load behavior, and power quality features extracted during the feature engineering stage. Standalone Support Vector Machine (SVM)44, Random Forest (RF)45, and Long Short-Term Memory (LSTM)46 models were implemented as baseline classifiers for comparative evaluation. The mathematical formulation of the learning models is provided in Supplementary File 1 (Section S5).
For classification, the output variable y ∈ {0,1} represented normal (0) and abnormal (1) operating conditions. When abnormal operating conditions or overload events were detected, the workflow generated a fault notification and flagged the acceptance process as invalid; otherwise, the process was classified as accepted.
The workflow orchestration engine integrated machine-learning predictions with rule-based validation, using a priority-based conflict-resolution strategy. Safety-critical operational rules and regulatory acceptance criteria were treated as hard constraints and therefore took precedence over machine-learning predictions when conflicts occurred. Final acceptance decisions were generated using the combined outputs of the rule-based validation and intelligent decision modules.
7. Cloud–edge integration and visualization dashboard
A cloud-edge computing architecture was implemented to support scalable data processing, storage, and visualization for the LV acceptance automation platform. Smart meters, SCADA systems, and IoT devices continuously collect electrical measurements, which are processed at the edge layer via filtering, normalization, feature extraction, and real-time inference to reduce communication overhead and enable low-latency decision-making. The mathematical derivations are provided in Supplementary File 1 (Section S6).
Processed data were transmitted to the cloud layer for long-term storage, advanced analytics, feature engineering, model training, and model management. Interactive dashboards provided real-time system monitoring, alerts, reporting, and operational decision support. The cloud-edge architecture is illustrated in Supplementary Figure 2, and the implementation details are summarized in Table 3.
| Layer | Component | Hardware / Software | Specification / Version | Purpose / Description |
| Edge Layer | Edge Device | Raspberry Pi 4 / NVIDIA Jetson Nano | Quad-core CPU, 4–8 GB RAM | Real-time data acquisition and local processing |
| IoT Gateway | Industrial IoT Gateway | MQTT / Modbus / OPC-UA support | Communication between sensors and edge/cloud | |
| Sensors / Smart Meters | Digital Smart Meters | Voltage, Current, Power Measurement | Data collection from LV network | |
| Edge Software | Python, EdgeX Foundry, MQTT Broker | Python 3.x | Data preprocessing, filtering, local inference | |
| Communication Protocols | Wi-Fi / PLC / RS-485 | Standard protocols | Data transmission to cloud layer | |
| Cloud Layer | Cloud Platform | AWS / Microsoft Azure / Google Cloud | Scalable cloud services | Data storage, analytics, and model training |
| Storage | AWS S3 / Azure Blob / InfluxDB | Time-series database | Storing historical and real-time data | |
| Compute & ML | Python, TensorFlow, PyTorch, Scikit-learn | ML libraries (latest versions) | Model training, evaluation, deployment | |
| Containerization | Docker, Kubernetes | Latest stable versions | Workflow orchestration and scalability | |
| Data Processing | Apache Spark / Pandas | Distributed processing | Large-scale data analytics | |
| Visualization Layer | Dashboard Tools | Grafana / Apache Superset / Plotly Dash | Web-based tools | Real-time monitoring and visualization |
| Web Framework | React.js / Angular / Flask / FastAPI | Modern web stack | UI development and API integration | |
| Notification System | Email / SMS Gateway / Push Notifications | Twilio / Firebase | Alert generation and communication | |
| API Services | REST APIs | JSON-based communication | Integration between modules |
Table 3: System implementation details. Summary of the hardware configuration, software environment, communication protocols, and cloud–edge computing components used for implementing the proposed LV acceptance automation platform.
Toegang beperkt. Log in of start een proefperiode om deze inhoud te bekijken.
Resultaten
The performance of the proposed Low-Voltage (LV) Acceptance Automation Platform was evaluated using the Open LV Network & Smart Meter Dataset together with a synthetic smart meter dataset generated to represent additional operating conditions and fault scenarios. The synthetic dataset enabled controlled evaluation of workflow orchestration, intelligent decision-making, and fault detection under abnormal operating conditions. The Open LV Network & Smart Meter Dataset comprised household smart meter measurements, f...
Toegang beperkt. Log in of start een proefperiode om deze inhoud te bekijken.
Discussie
De experimentele evaluatie toonde aan dat het voorgestelde workflow-georiënteerde Low-Voltage (LV) Acceptance Automation Platform consistent beter presteerde dan de benchmark-benaderingen op het gebied van classificatie, voorspelling, foutdetectie, latentie van operationele besluitvorming en schaalbaarheid. Deze prestatieverbeteringen waren het resultaat van de integratie van geavanceerde feature engineering, workflow-orchestratie, cloud-edge-samenwerking en hybride regelgebaseerde en machine learning-besluitvorming, in ...
Toegang beperkt. Log in of start een proefperiode om deze inhoud te bekijken.
Openbaarmakingen
De auteurs verklaren dat zij geen concurrerende financiële of niet-financiële belangen hebben.
Dankbetuigingen
The authors thank the UK Power Networks Open Data Portal for providing the publicly available Open LV Network & Smart Meter dataset used in this study. This research received no external funding.
Toegang beperkt. Log in of start een proefperiode om deze inhoud te bekijken.
Materialen
| Naam | Bedrijf | Catalogusnummer | Opmerkingen |
|---|---|---|---|
| Apache Spark | Apache Software Foundation | Versie 3.4+ | Grootschalige data-analyse |
| Apache Superset | Apache Software Foundation | Versie 3.x | Analytics-dashboard |
| Docker Engine | Docker Inc. | Versie 24.x | Implementatie van applicaties |
| Eclipse Mosquitto MQTT-broker | Eclipse Foundation | Versie 2.x | Gegevensuitwisseling |
| EdgeX Foundry (Jakarta Release of later) | LF Edge (Linux Foundation) | Versie Jakarta / Genève | Beheer van edge-apparaten |
| Flask / FastAPI | Pallets Projecten / Sebastián RamíSinds u geen brontekst heeft verstrekt, kan ik geen vertaling uitvoeren. Voer a.u.b. de Engelse tekst in die u vertaald wilt hebben naar het Nederlands. | Flask 2.3+ / FastAPI 0.100+ | Integratie van de backend-API |
| Grafana | Grafana Labs | Versie 10.x | Visualisatie en monitoring |
| Industriële IoT-gateway | Advantech / Siemens | ECU-1251 / SIMATIC IOT2040 | Sensor-naar-cloud-communicatie |
| IoT-sensoren (spannings-/stroomsensoren) | Texas Instruments / Analog Devices | INA219 / ACS712 | Real-time netwerkmonitoring |
| Jetson Nano Developer Kit | NVIDIA Corporation | 945-13450-0000-100 | Edge AI-inferentie |
| Kubernetes | Cloud Native Computing Foundation (CNCF) | Versie 1.27+ | Schaalbaarheid van de workflow |
| LSTM-model (Keras/TensorFlow) | Google (TensorFlow/Keras) | Inbegrepen in TF 2.12+ | Belastingsvoorspelling en prognose |
| PLC-module (Power Line Communication) | STMicroelectronics | ST7580 | Communicatie in slimme netwerken |
| Plotly Dash | Plotly Inc. | Versie 2.x | Interactieve visualisatie |
| Python 3.10 | Python Software Foundation | Versie 3.10.x | Gegevensverwerking en analyse |
| PyTorch | Meta AI | Versie 2.0+ | Implementatie van deep learning |
| Random Forest-algoritme | Scikit-learn | Inbegrepen in v1.3+ | Foutclassificatie |
| Raspberry Pi 4 Model B (4 GB RAM) | Raspberry Pi Foundation | RPI4-MODBP-4GB | Edge-verwerking |
| React.js / Angular | Meta / Google | React 18.x / Angular 16+ | Ontwikkeling van de gebruikersinterface |
| RS-485-transceivermodule | Maxim Integrated (Analog Devices) | MAX485 | Connectiviteit van industriële apparaten |
| Scikit-learn | Scikit-learn-ontwikkelaars | Versie 1.3+ | Machine learning-modellen |
| Support Vector Machine (SVM) | Scikit-learn | Inbegrepen in v1.3+ | Classificatie en validatie |
| TensorFlow | Google LLC | Versie 2.12+ | Modeltraining |
| Twilio / Firebase Cloud Messaging | Twilio Inc. / Google | Niet van toepassing | Waarschuwingen en meldingen |
| Wi-Fi-module | Espressif Systems | ESP8266 / ESP32 | Gegevensoverdracht |
| XGBoost | DMLC (Distributed ML Community) | Versie 1.7+ | Intelligente beslissingsondersteuning |
Referenties
- Tong L, Zhou J, Li J. IoT-based low-voltage power distribution system management and control platform. Front Energy Res. 2022;10:902715. https://doi.org/10.3389/fenrg.2022.902715
- Babayigit B, Abubaker M. Industrial Internet of Things: A review of improvements over traditional SCADA systems for industrial automation. IEEE Syst J. 2023;18:120–133.
- Nakagawa EY, et al. Industry 4.0 reference architectures: State of the art and future trends. Comput Ind Eng. 2021;156:107241. https://doi.org/10.1016/j.cie.2021.107241
- Ladegourdie M, Kua J. Performance analysis of OPC UA for industrial interoperability towards Industry 4.0. Internet Things. 2022;3:507–525.
- Bader SR, Maleshkova M, Lohmann S. Structuring reference architectures for the industrial Internet of Things. Future Internet. 2019;11:151. https://doi.org/10.3390/fi11070151
- Fun TS, Samsudin A. Recent technologies, security countermeasure and ongoing challenges of industrial Internet of Things (IIoT): A survey. Sensors (Basel). 2021;21:6647. https://doi.org/10.3390/s21196647
- Mirani AA, et al. Key challenges and emerging technologies in industrial IoT architectures: A review. Sensors (Basel). 2022;22:5836. https://doi.org/10.3390/s22155836
- Fraile F, et al. Reference models for digital manufacturing platforms. Appl Sci. 2019;9:4433. https://doi.org/10.3390/app9204433
- Serôdio C, et al. Software and architecture orchestration for process control in Industry 4.0 enabled by cyber-physical systems technologies. Appl Sci. 2024;14:2160. https://doi.org/10.3390/app14052160
- Ungurean I, Gaitan NC. A software architecture for the industrial Internet of Things—A conceptual model. Sensors (Basel). 2020;20:5603. https://doi.org/10.3390/s20195603
- Hsiao CH, Lee WP. OPIIoT: Design and implementation of an open communication protocol platform for industrial Internet of Things. Internet Things. 2021;16:100441. https://doi.org/10.1016/j.iot.2021.100441
- Domínguez-Bolaño T, et al. An overview of IoT architectures, technologies, and existing open-source projects. Internet Things. 2022;20:100626. https://doi.org/10.1016/j.iot.2022.100626
- Sasiain J, et al. Towards flexible integration of 5G and IIoT technologies in Industry 4.0: A practical use case. Appl Sci. 2020;10:7670. https://doi.org/10.3390/app10217670
- Cañas H, et al. A conceptual framework for smart production planning and control in Industry 4.0. Comput Ind Eng. 2022;173:108659. https://doi.org/10.1016/j.cie.2022.108659
- Cabrini FH, et al. Enabling the industrial Internet of Things to cloud continuum in a real city environment. Sensors (Basel). 2021;21:7707. https://doi.org/10.3390/s21227707
- Gabriel MF, et al. Implementation of an IoT architecture for promoting healthy air quality in 84 homes of families with children. Build Environ. 2024;266:112040. https://doi.org/10.1016/j.buildenv.2024.112040
- Silva BN, Khan M, Han K. Internet of Things: A comprehensive review of enabling technologies, architecture, and challenges. IETE Tech Rev. 2018;35:205–220.
- Dhaou ISB, et al. Internet of Things technologies for smart grid. In: Research Anthology on Smart Grid and Microgrid Development. IGI Global; Hershey; 2022. p. 805–832.
- Kondoro A, et al. A low latency secure communication architecture for microgrid control. Energies. 2021;14:6262. https://doi.org/10.3390/en14196262
- Tightiz L, Yang H. A comprehensive review on IoT protocols' features in smart grid communication. Energies. 2020;13:2762. https://doi.org/10.3390/en13112762
- Kondoro A, et al. Real-time performance analysis of secure IoT protocols for microgrid communication. Future Gener Comput Syst. 2021;116:1–12.
- Rodrigues R, et al. A review of solid-state circuit breakers. IEEE Trans Power Electron. 2020;36:364–377.
- IEEE. IEEE Std 1159-2019: IEEE recommended practice for monitoring electric power quality. IEEE; Piscataway (NJ); 2019. https://doi.org/10.1109/IEEESTD.2019.8800097
- Otcenasova A, et al. The influence of power quality indices on active power losses in a local distribution grid. Energies. 2019;12:1389. https://doi.org/10.3390/en12071389
- Ma K, et al. Review of distribution network phase unbalance: Scale, causes, consequences, solutions, and future research direction. CSEE J Power Energy Syst. 2020;6:479–488.
- Peppanen J, et al. Modeling power electronic equipment to improve distribution feeder current and voltage balance [Presentation]. Presented at: IEEE PES Transmission and Distribution Conference and Exposition (T&D); Denver, CO; 2018. Available from: https://ieeexplore.ieee.org/ https://doi.org/10.1109/TDC.2018.8440261
- Sayed S, et al. Design and realization of an open-source and modular smart meter. Energy Sci Eng. 2019;7:1405–1422.
- Satapathy LM, et al. Arduino based home automation using Internet of Things (IoT). Int J Pure Appl Math. 2018;118:769–778.
- Shaban M, et al. Design of a partially grid-connected photovoltaic microgrid using IoT technology. Appl Sci. 2021;11:11651. https://doi.org/10.3390/app112411651
- Shaban M, Dhaou IB. Design of an IoT-enabled microgrid architecture for a partial grid-connected mode [Presentation]. Presented at: 18th International Multi-Conference on Systems, Signals and Devices (SSD); Virtual; 2021. Available from: https://ieeexplore.ieee.org/ https://doi.org/10.1109/SSD52085.2021.9429443
- Taye BZ, et al. Rural electrification planning using geographic information system (GIS). Cogent Eng. 2020;7:1836730. https://doi.org/10.1080/23311916.2020.1836730
- Huld T, et al. Geospatial analysis of photovoltaic mini-grid system performance. Energies. 2017;10:218. https://doi.org/10.3390/en10020218
- Domínguez J, et al. IntiGIS-Local: A geospatial approach to assessing rural electrification alternatives for sustainable socio-economic development in isolated communities—A case study of Guasasa, Cuba. Energies. 2024;17:3835. https://doi.org/10.3390/en17153835
- Tafula JE, et al. Multicriteria decision-making approach for optimum site selection for off-grid solar photovoltaic microgrids in Mozambique. Energies. 2023;16:2894. https://doi.org/10.3390/en16062894
- Isihak S, et al. Evolution of GIS-based rural electrification planning models and an application of OnSSET in Nigeria. Renew Sustain Energy Transit. 2022;2:100019. https://doi.org/10.1016/j.rset.2022.100019
- Korkovelos A, et al. The role of open access data in geospatial electrification planning and the achievement of SDG7: An OnSSET-based case study for Malawi. Energies. 2019;12:1395. https://doi.org/10.3390/en12071395
- Cicilio P, et al. uGrid: Reliable minigrid design and planning toolset for rural electrification. IEEE Access. 2019;7:163988–163999.
- Nasir M, et al. Optimal planning and design of low-voltage low-power solar DC microgrids. IEEE Trans Power Syst. 2018;33:2919–2928.
- Vai V, et al. Optimal low-voltage distribution topology with integration of PV and storage for rural electrification in developing countries: A case study of Cambodia. J Mod Power Syst Clean Energy. 2020;8:531–539.
- Banad Y, Sharif S, Rezaei Z. Artificial intelligence and machine learning for smart grids: from foundational paradigms to emerging technologies with digital twin and large language model-driven intelligence. Energy Convers Manag X. 2025;28:101329. https://doi.org/10.1016/j.ecmx.2025.101329
- Álvarez-López C, González-Briones A, Li T. Explainable AI and multi-agent systems for energy management in IoT-edge environments: a state-of-the-art review. Electronics. 2026;15(2):385. https://doi.org/10.3390/electronics15020385
- UK Power Networks. Open data portal [Online]. Available from: https://www.ukpowernetworks.co.uk/our-company/open-data-portal (Accessed June 2026).
- Jolliffe IT. Principal Component Analysis. 2nd ed. Springer; New York; 2002. https://doi.org/10.1007/b98835
- Cortes C, Vapnik V. Support-vector networks. Mach Learn. 1995;20:273–297.
- Breiman L. Random forests. Mach Learn. 2001;45:5–32.
- Hochreiter S, Schmidhuber J. Long short-term memory. Neural Comput. 1997;9:1735–1780.
- Fawcett T. An introduction to ROC analysis. Pattern Recognit Lett. 2006;27:861–874.
- Montgomery DC, Runger GC. Applied Statistics and Probability for Engineers. 8th ed. John Wiley & Sons; Hoboken (NJ); 2020.
- Montgomery DC. Design and Analysis of Experiments. 10th ed. John Wiley & Sons; Hoboken (NJ); 2020.
Toegang beperkt. Log in of start een proefperiode om deze inhoud te bekijken.