This study investigates NOTCH2-driven colorectal cancer progression using TCGA analysis, clinical samples, HCT116 functional assays, and macrophage co-culture. NOTCH2 overexpression promotes epithelial-mesenchymal transition and is accompanied by coordinated GATA3/IL-4 changes. IL-4 contributes to M2-like macrophage polarization, supporting NOTCH2 as a candidate regulator of tumor-cell plasticity and immune-microenvironment remodeling in CRC.
Onderzoeksartikel
Notch Receptor 2 Drives Epithelial-Mesenchymal Transition and M2-Like Macrophage Polarization in Human Colorectal Cancer Tissues and HCT116 Cells
* These authors contributed equally
In dit artikel
Samenvatting
Samenvatting
Despite advances in understanding colorectal cancer (CRC) biology, how tumor-cell signaling coordinates epithelial-mesenchymal transition (EMT) with macrophage polarization remains incompletely defined. We investigated whether NOTCH2 expression is associated with EMT and with a GATA3/IL-4-dependent macrophage-polarizing phenotype in CRC. NOTCH2 expression and prognostic associations were analyzed using TCGA data and validated in 20 paired CRC and adjacent normal tissue (ANT) specimens. Gain- and loss-of-function experiments in HCT116 cells assessed proliferation, migration, invasion, EMT markers, GATA3, and IL-4. A Transwell co-culture system containing transfected HCT116 cells and peripheral blood mononuclear cells (PBMCs) was used to evaluate CD206-positive M2-like macrophage polarization, and IL-4 neutralization was used to test the contribution of IL-4. NOTCH2 was increased in CRC tissues, and higher NOTCH2 expression was associated with poorer overall survival. NOTCH2 overexpression increased CRC-cell proliferation, migration, invasion, Vimentin, GATA3, and IL-4, while reducing E-cadherin; NOTCH2 silencing produced the opposite changes. Clinical tissues showed increased NOTCH2, GATA3, IL-4, CD163, and Vimentin, together with reduced E-cadherin. In co-culture, NOTCH2 overexpression increased the proportion of CD206-positive M2-like cells, whereas NOTCH2 knockdown reduced it. IL-4 neutralization significantly attenuated the increase in CD206-positive cells induced by NOTCH2 overexpression. These findings support associations among NOTCH2-associated malignant phenotypes, EMT, altered GATA3/IL-4 expression, and IL-4-dependent M2-like macrophage polarization in CRC, while direct transcriptional regulation of the GATA3/IL-4 axis remains to be established.
Inleiding
CRC remains one of the leading causes of cancer-related mortality worldwide, with metastasis accounting for the majority of deaths1. Metastasis is driven by EMT, a dynamic process through which tumor cells lose epithelial characteristics and acquire mesenchymal features, thereby gaining enhanced migratory and invasive capacities2,3. Beyond its well-established role in metastasis, EMT has emerged as a critical regulator of the tumor microenvironment (TME)4,5. EMT-programmed tumor cells and surrounding stromal and immune cells can engage in reciprocal cytokine and chemokine signaling that supports tumor progression6. Tumor-associated macrophages (TAMs) are abundant components of the TME and exhibit heterogeneous activation states7,8. Although the M1/M2 framework is an oversimplification, M1-like states are generally associated with inflammatory or antitumor functions, whereas M2-like states often support tumor progression9. In CRC, increased M2-like TAMs infiltration, particularly at the invasive front, has been associated with aggressive clinicopathologic features and poorer outcomes10. However, the molecular mechanisms by which EMT in CRC cells regulates the secretion of specific factors to drive M2-like TAM polarization remain incompletely understood.
The Notch signaling pathway regulates biological processes such as cell growth, lineage differentiation, and EMT11,12. NOTCH2 has received increasing attention due to its role in tumor progression. Upon activation by Delta-like or Jagged family ligands, NOTCH2 undergoes a series of proteolytic cleavages, releasing its intracellular domain (N2ICD). The N2ICD enters the nucleus and assembles with RBPJ and coactivators to form a transcription factor complex, thereby driving the transcription of target genes13,14. In CRC, experimental work has linked JAG1/NOTCH2 signaling to EMT and metastatic behavior15. In CRC, clinical studies have also reported associations between NOTCH2 expression and CRC differentiation and patient outcome16,17. These observations suggest that NOTCH2 requires evaluation in defined molecular and clinical settings. More broadly, epithelial Notch signaling can remodel the CRC microenvironment and promote metastatic progression in experimental models18. Together, these findings support further investigation of NOTCH2 as a potential regulator of both tumor-cell plasticity and the surrounding microenvironment.
IL-4 is a cytokine that can induce M2-like macrophage polarization through the IL-4Rα/JAK/STAT6 signaling pathway19,20. While Th2 cells are classically considered the primary source of IL-4, emerging evidence suggests that tumor cells of various origins can also produce IL-4, thereby contributing to an immunosuppressive TME20. In CRC, cancer cells have been reported to release IL-4 in co-culture, where IL-4 was implicated in a shift toward an M2-like macrophage phenotype21. The Notch signaling pathway has been shown to regulate IL-4 expression in several cellular contexts. For instance, Notch activation cooperates with GATA3 to promote IL-4 transcription in T helper cells22,23. EMT transcription factors also have pleiotropic functions beyond cell motility, including effects on cellular signaling and the tumor microenvironment24. These observations provide a rationale for testing whether tumor-cell NOTCH2 is associated with coordinated EMT and GATA3/IL-4 changes that functionally influence M2-like macrophage polarization in CRC. However, prior evidence does not establish a direct NOTCH2-GATA3-IL4 transcriptional cascade in CRC cells. The present study therefore combines NOTCH2 gain- and loss-of-function with PBMC co-culture and IL-4 neutralization to test this linkage experimentally.
In the present study, we investigated the role of the NOTCH2/EMT/IL-4 axis in modulating M2-like TAM polarization in CRC. We hypothesized that NOTCH2 overexpression in CRC cells simultaneously drives EMT and upregulates IL-4 expression to promote M2-like macrophage polarization, contributing to an immunosuppressive tumor microenvironment. Using HCT116 CRC cells as the experimental model, the specific objectives were to: characterize NOTCH2 expression patterns and prognostic significance in clinical CRC specimens; determine the functional consequences of NOTCH2 manipulation on EMT markers and IL-4 production; and investigate whether NOTCH2-driven IL-4 expression functionally induces M2-like polarization of co-cultured macrophages.
Protocol
The study was approved by the Medical Ethics Committee of Zhongnan Hospital, Wuhan University (approval number: 2018005). All human experiments were conducted in accordance with institutional guidelines. All patients signed informed consent forms.
Bioinformatics analysis
Colon adenocarcinoma (COAD) and rectal adenocarcinoma (READ) RNA-sequencing data (level-3 FPKM, log2-transformed) and corresponding clinical annotations were downloaded from The Cancer Genome Atlas (TCGA) through the Genomic Data Commons (GDC) Data Portal. A total of 280 patients with complete RNA-seq and clinical data were included and stratified into NOTCH2-high and NOTCH2-low groups using the median NOTCH2 expression value as the threshold (129 high-NOTCH2, 151 low-NOTCH2). Overall survival was compared between groups using Kaplan-Meier analysis and the log-rank test, and the hazard ratio (HR) with its 95% confidence interval (CI) was estimated by Cox proportional-hazards regression. The full dataset information is provided in Supplementary Table 1. Gene set enrichment analysis (GSEA) was performed using the GSEA software and the Molecular Signatures Database. For the NOTCH2-associated analysis, the 280 patients were divided into low- and high-NOTCH2 groups according to the median NOTCH2 expression level, with the high-NOTCH2 group listed first in the phenotype file. The log2-transformed expression matrix was used as input. Genes were ranked using the signal-to-noise ratio, and the weighted enrichment statistic was applied. Gene sets containing 15–500 genes after mapping to the input dataset were retained for analysis. Statistical significance was assessed using 1,000 phenotype-label permutations. The enrichment score (ES) was normalized according to gene-set size to obtain the normalized enrichment score (NES). Nominal P values were calculated from the permutation distribution, and empirical false discovery rate (FDR) q values were calculated across all gene sets tested. Gene sets with a nominal P value <0.05 and an FDR q value <0.25 were considered suggestively enriched in this exploratory analysis, whereas gene sets with an FDR q value <0.05 were considered strongly supported. Positive NES values indicated enrichment in the high-NOTCH2 group, whereas negative NES values indicated enrichment in the low-NOTCH2 group.
Clinical tissue specimens preparation
Twenty pairs of human CRC specimens were procured. Their paired adjacent normal tissues (ANT) were also harvested. Sample collection was performed immediately post-surgery. Post-excision, every individual specimen was swiftly bisected. Two separate parts were generated from each sample. The initial part underwent flash-freezing in liquid nitrogen. This part was then preserved at -80 °C. The second part was fixed in 4% paraformaldehyde. This fixation process occurred at room temperature. It lasted for at least 24 h. This time frame guaranteed sufficient fixation. Ethical clearance for this investigation was obtained.
Cell culture and transient transfection
HCT116 human CRC cells were grown in basal medium. This medium was enriched with 10% FBS. Antibiotics (1% penicillin-streptomycin) were also incorporated. Cells were cultivated within a humidified incubator. A constant temperature of 37 °C was set. A 5% CO2 atmosphere was maintained throughout. For transfection purposes, cells were plated. They were cultured until 70-80% confluence was achieved. Transfection complexes were subsequently prepared. 10 µL of 5 µM NOTCH2-specific siRNA (or 1 µg of NOTCH2 overexpression plasmid) was diluted in 500 µL of serum-free medium. Next, 10 µL of cationic lipid-based transfection reagent was added. The resulting mixture was gently vortexed. It was then incubated at room temperature. This incubation lasted for 20 min. The duration was sufficient for complex formation. The final mixture was added to the cells dropwise. Six h after transfection, the medium was changed. Fresh complete medium was used for replacement.
RNA extraction and quantitative real-time PCR (qRT-PCR)
Cells or tissues were lysed with 1 mL of RNA extraction reagent. Following lysis, 100 µL of auxiliary reagent was added. The mixture was then vortexed for 30 s. An incubation step was performed at room temperature. This incubation lasted for 5 min. The RNA-containing aqueous phase was isolated by centrifugation. The centrifugation parameters were set at 12,000 × g at 4 °C. The duration was 15 min. RNA precipitation was then initiated. The aqueous phase (500 µL) was mixed with isopropanol (500 µL). The mixture was incubated for 5 min. Precipitation was finalized via centrifugation. This step was performed at 12,000 × g at 4 °C for 15 min. The supernatant was carefully aspirated. The RNA pellet was retained for subsequent steps. The pellet was rinsed twice. Each rinse was performed with 1 mL of 75% ethanol. After each rinse, a 15 min centrifugation was carried out. The condition was 12,000 × g at 4 °C. The supernatant was removed after each wash. Any residual liquid was pipetted out. The RNA pellet was finally resuspended. A volume of 15 µL of RNase-free water was used for dissolution. Reverse transcription was subsequently conducted. Total RNA (1 µg) was combined with 2 µL of RT master mix. Nuclease-free water was added to adjust the final volume. The final volume was set at 10 µL. Quantitative real-time PCR was executed. SYBR Green qPCR master mix was employed for this detection. A real-time PCR system was utilized for the reaction. Thermal cycling conditions were established. Initial denaturation was performed at 95 °C for 5 min. This was followed by 40 amplification cycles. Each cycle included denaturation at 95 °C for 15 s. Annealing and extension occurred at 60 °C. Each annealing/extension step lasted for 30 s. Gene-specific primers were created. Specialized software was applied for primer design. The primer details are listed in Table 1.
Protein extraction and western blot analysis
Tissue (or cells) was lysed on ice for 30 min using a lysis buffer containing protease and phosphatase inhibitors. Protein supernatant was obtained by centrifugation at 12,000 × g for 15 min at 4 °C. Total protein concentration was determined using the BCA method. For gel electrophoresis, the sample was first mixed with 5× SDS loading buffer (4:1). The mixture was then boiled at 100 °C for 10 min. Separation of proteins was accomplished by SDS-PAGE. Proteins were next transferred onto PVDF membranes by electroblotting. To block non-specific sites, the membranes were incubated with 10 mL of blocking reagent for 1 h at ambient temperature. Primary antibodies targeting NOTCH2, N-cadherin, E-cadherin, Occludin, Vimentin, GATA3, IL-4, and GAPDH were then applied. The incubation was carried out overnight at 4 °C on a platform with gentle rocking. After three washes with TBST, the corresponding species' secondary antibody was added. Incubation was performed at room temperature for 1 h. The signal was visualized using an ECL substrate, and the results were observed via a digital imaging system. Band intensity was quantified using densitometry. All values were normalized using GAPDH as a reference control.
Cell proliferation assay
Cell proliferation was quantified by the EdU incorporation assay. Transfected cells were seeded into 96-well plates and left to adhere overnight. The culture medium was then spiked with 1 µL of EdU labeling solution, after which cells were incubated for an additional 2 h. Following this treatment, cell fixation was performed with 4% paraformaldehyde for 15 min. Permeabilization was subsequently achieved using 100 µL of 0.3% Triton X-100 for 10 min at ambient temperature. A 100 µL aliquot of azide-coupled fluorescent dye cocktail was subsequently introduced. The reaction mixture was kept in the dark for 30 min to label the incorporated EdU. Nuclei were then counterstained with DAPI for 10 min. Fluorescence imaging was carried out with a microscope. The proliferation rate was determined by calculating the ratio of EdU-positive nuclei to the total DAPI-stained nuclei.
Transwell migration and invasion assays
Cell motility was assessed via transwell inserts with 8-µm pore polycarbonate membranes. These inserts were placed into 24-well plates. For invasion assays, the upper membrane was pre-coated with diluted Matrigel. A 2 h incubation was carried out at 37 °C for gelation. This coating step was excluded for migration assays. Following harvest, transfected cells were digested and resuspended in serum-free medium. The resulting cell suspension was seeded into pre-coated Matrigel chambers (8 µm pores). Complete culture medium was added to the wells. After incubation for 48 h, residual cells on the upper membrane were removed with a cotton swab. Cells transferred to the lower membrane were fixed with 4% paraformaldehyde for 15 min, then stained with 0.1% crystal violet for 15 min. Residual staining was gently rinsed with enzyme-free water and then air-dried. The stained cells were observed under a bright-field microscope. Five fields of view were randomly selected from each chamber for cell counting.
PBMC isolation and tumor cell-macrophage transwell co-culture
Donor blood specimens were mixed 1:1 with PBS. The diluted samples were then gently overlaid onto the separation gradient contained within 50-mL tubes. The centrifugation process was performed at 800 × g under ambient conditions for 25 min, with the deceleration brake disabled. The distinct buffy coat layer at the interface was carefully aspirated with a sterile pipette. Following this, the cell suspensions were transferred into fresh 50-mL tubes. A subsequent wash step involved 30 mL of PBS rinsing, followed by centrifugation at 300 × g for 10 min. After two such washes, the cell precipitates were resuspended in RPMI-1640 medium with 10% FBS and 1% penicillin-streptomycin. For the co-culture assay, 5 × 10^5 PBMCs were dispensed into the six-well plates. The six-well plates were supplied with 1.5 mL of RPMI-1640 complete medium. In parallel, HCT116 cells (transfected 48 h earlier with OE-NC, OE-NOTCH2, si-NC, or si-NOTCH2) were detached with trypsin and enumerated. Subsequently, 2 × 10^5 cells were plated in the upper compartments of 0.4-µm Transwell chambers. Each upper compartment received 2.5 mL of the identical complete medium. The Transwell inserts were subsequently placed into the six-well plates. The co-cultures were maintained for 48 h at 37 °C with 5% CO2, and no medium replacement was performed during this period. For IL-4 neutralization experiments, co-cultures containing OE-NOTCH2 HCT116 cells were treated at the start of co-culture with an IL-4-neutralizing antibody at a final concentration of 10 µg/mL, and the treatment was maintained for 48 h. Matched co-cultures received the corresponding isotype-control IgG at the same concentration.
Flow cytometry analysis of macrophage polarization
Following the 48-h co-culture period, the PBMCs in the six-well plates were gently resuspended by pipetting. The harvested cells were washed twice with PBS (2 mL per wash). Each wash was followed by centrifugation at 300 × g for 5 min at 4 °C. The final cell pellet was resuspended in 100 µL of staining buffer. This buffer consisted of PBS containing 2% FBS and 0.05% sodium azide. Prior to staining, cells were treated with 5 µL of Fc receptor blocking reagent. This blocking step lasted for 15 min at 4 °C to minimize non-specific binding. Subsequently, cells were incubated with 5 µL of fluorophore-conjugated anti-CD206 antibody (M2 marker, FITC-conjugated). The incubation was carried out for 30 min at 4 °C in the dark. After staining, two additional washes were performed. Each wash utilized 2 mL of staining buffer. The final pellet was re-suspended in 300 µL of staining buffer for prompt analysis. Unstained cell samples and single-color compensation controls were prepared in parallel. Data acquisition was performed using a flow cytometer. For each sample, at least 10,000 events were collected within the macrophage gate. The gating strategy relied on forward and side scatter properties. FlowJo software was utilized for subsequent data analysis. The proportion of CD206-positive (M2-like) cells among the gated macrophage population was quantified for each co-culture condition.
Immunofluorescence (IF) and immunohistochemistry (IHC)
For IF, tissue deparaffinization was first conducted in xylene. The sections were then rehydrated through graded ethanol. Heat-induced antigen retrieval was subsequently performed in citrate buffer (pH 6.0). Non-specific binding sites were blocked with 5% BSA. This treatment lasted for 1 h at room temperature. Primary antibody incubation was carried out overnight at 4 °C. Afterward, fluorophore-conjugated secondary antibodies were applied and allowed to react for 1 h in the dark. Counterstaining was performed with DAPI. The slides were subsequently mounted using an anti-fade medium. Image acquisition was performed with a confocal laser scanning microscope.
For IHC, serial tissue sections were prepared following the protocol described above. Endogenous peroxidase activity was eliminated by treating the sections with 3% hydrogen peroxide for 10 min. After this blocking step, primary antibodies were applied. These specific antibodies targeted NOTCH2, GATA3, IL-4, Vimentin, and E-cadherin. The incubation was performed overnight at 4 °C. HRP-conjugated secondary antibodies were then introduced. Chromogenic development was achieved using 3,3'-diaminobenzidine (DAB) substrate solution. The slides were counterstained with hematoxylin. Subsequent steps involved dehydration and clearing. Finally, a resinous mounting medium was applied. Bright-field microscopy was utilized for final observation.
For quantitative IHC analysis, five non-overlapping fields were randomly selected from representative viable tissue regions of each section and analyzed using ImageJ software. The same image-acquisition conditions were used for all samples. DAB-positive staining was identified using a fixed threshold, which was established based on background staining and then applied uniformly to all images within the same staining experiment. The positive area percentage was calculated as the DAB-positive area divided by the total tissue area of the analyzed field × 100%. For NOTCH2 staining, integrated optical density (IOD) was additionally measured, and the average optical density (AOD) was calculated as IOD divided by the corresponding DAB-positive area. The mean value from five fields was used as the quantitative value for each specimen.
Statistical analysis
Statistical assessments were conducted with standard software tools. Data derived from at least three independent experiments are presented as the mean ± SEM. For comparisons between two independent groups, an unpaired two-tailed Student's t-test was applied. For paired clinical specimens (CRC vs. ANT), a two-tailed paired Student's t-test was chosen. For multi-group analyses, a one-way analysis of variance (ANOVA) was performed, followed by Tukey post-hoc tests. A P-value below 0.05 was set as the threshold for statistical significance.
Resultaten
Gene set enrichment analysis (GSEA) revealed that the epithelial-mesenchymal transition (EMT), KEGG Notch, and p53 signaling pathways were enriched in the NOTCH2-high expression group, indicating activation of key pathways associated with tumor invasion and cellular stress (Figure 1A). Regarding clinical prognosis, Kaplan-Meier survival analysis further demonstrated that colorectal cancer patients in the NOTCH2 high-expression group had significantly poorer overall survival than those in the low-expression group (Log-rank P = 0.0383; Cox HR = 0.4875, 95% CI 0.30–0.80, P = 0.004, low- vs. high-NOTCH2 group), suggesting that elevated NOTCH2 expression is associated with poorer prognosis (Figure 1B).
To further validate these bioinformatic findings, we collected 20 pairs of clinical CRC and adjacent normal tissue (ANT) samples. Consistent with the database results, Real-time quantitative PCR (qRT-PCR) analysis demonstrated that the expression of NOTCH2 mRNA was markedly increased in CRC tissues compared with the corresponding ANT (Figure 1C). Consistently, Western blot analysis confirmed that NOTCH2 protein levels were markedly upregulated in CRC tissues compared with matched ANT tissues, showing an approximate 2-fold increase (P < 0.001) (Figure 1D). Collectively, these data indicate that NOTCH2 is an overexpressed oncogenic factor in CRC and may serve as a reliable prognostic biomarker.
NOTCH2 promotes proliferation, and enhances migration and invasion by inducing EMT in CRC cells
To further investigate the biological function of NOTCH2, we performed gain- and loss-of-function assays using NOTCH2 overexpression vectors (OE-NOTCH2) and specific siRNAs (si-NOTCH2) (Figure 2A). As shown by the EdU assay, NOTCH2 overexpression significantly enhanced cell proliferation compared with the negative control (OE-NC) (P < 0.01). Conversely, silencing NOTCH2 markedly reduced cell proliferation compared with si-NC (P < 0.01) (Figure 2B).
Next, Transwell assays were performed to evaluate cell motility. The migration assay indicated that the relative migratory capacity of CRC cells was significantly increased in the OE-NOTCH2 group (P < 0.001) and notably suppressed in the si-NOTCH2 group (P < 0.01) (Figure 2C). Similarly, the invasion assay demonstrated that the relative invasiveness was significantly promoted upon NOTCH2 overexpression (P < 0.001) and significantly attenuated following NOTCH2 knockdown (P < 0.05) (Figure 2D).
To verify whether these enhanced metastatic phenotypes were driven by the EMT program, we examined the expression levels of EMT-related proteins via Western blotting. The results indicated that NOTCH2 overexpression significantly reduced the protein level of the epithelial marker E-cadherin (P < 0.01) while increasing the expression of the mesenchymal marker vimentin (P < 0.001); conversely, NOTCH2 knockdown significantly upregulated E-cadherin and downregulated vimentin (Figure 2E). These findings suggest that NOTCH2 actively drives the migration and invasion of colorectal cancer cells by initiating the EMT process.
Given the critical role of the tumor microenvironment, we first sought to explore the relationship between NOTCH2 and M2-like tumor-associated macrophages (TAMs). Immunofluorescence (IF) staining of clinical tissues revealed that CRC tissues exhibited higher co-expression of NOTCH2 and the M2-like macrophage marker CD163 compared with adjacent normal tissues (ANT), suggesting a potential correlation between NOTCH2 expression and M2-like (CD163-positive) macrophage infiltration (Figure 3A).
To examine whether similar changes occur in clinical tissues, we performed Western blot analysis on clinical patient samples (P1-P6). Western blot analysis of clinical tissue samples further confirmed that the protein levels of IL-4 (P < 0.001), GATA3 (P < 0.001), and NOTCH2 (P < 0.001) were significantly higher in the CRC group than in the ANT group (Figure 3B).
Subsequently, we performed in vitro assays in the HCT116 CRC cell line to examine whether NOTCH2 manipulation is accompanied by coordinated GATA3 and IL-4 changes. Western blot results showed that overexpression of NOTCH2 significantly increased the protein levels of GATA3 (P < 0.05) and IL-4 (P < 0.01), whereas NOTCH2 silencing resulted in a dramatic reduction of GATA3 (P < 0.01) and IL-4 expression (P < 0.05) (Figure 3C). These findings indicate that NOTCH2 gain- and loss-of-function are accompanied by concordant changes in GATA3 and IL-4 expression.
Finally, to comprehensively confirm the differential expression of these targets in clinical tissues, we performed immunohistochemistry (IHC) on serial sections of CRC and ANT samples. The IHC analysis verified that the positive area proportions of CD163 (P < 0.001), GATA3 (P < 0.001), IL-4 (P < 0.01), and the mesenchymal marker Vimentin (P < 0.001) were significantly increased in CRC tissues. Additionally, while the change in the positive area proportion of NOTCH2 was not significant, its average optical density for protein expression was significantly upregulated in CRC tissues (P < 0.001) (Figure 3D). Taken together, these data indicate that NOTCH2 overexpression is accompanied by EMT progression and coordinated GATA3/IL-4 changes, and is associated with M2-like TAM infiltration in the CRC microenvironment.
To investigate the effect of NOTCH2 expression levels in colorectal cancer cells on macrophage polarization, we conducted a co-culture experiment using the HCT116 colorectal cancer cell line and peripheral blood mononuclear cells (PBMCs) and evaluated the proportion of CD206-positive (M2-like) cells via flow cytometry. The results demonstrated that, compared with the OE-NC group, co-culture with NOTCH2-overexpressing colorectal cancer cells (OE-NOTCH2) significantly increased the proportion of CD206-positive M2-like cells (P < 0.001); conversely, NOTCH2 knockdown (si-NOTCH2) significantly reduced this proportion (P < 0.05) (Figure 4A). Given our previous confirmation that NOTCH2 upregulates the expression of the cytokine IL-4, we further introduced an IL-4 neutralizing antibody (anti-IL-4) for a blocking experiment. Flow cytometric analysis confirmed that, compared with the isotype control antibody group (OE-NOTCH2+IgG), the addition of the IL-4 neutralizing antibody significantly reversed the increase in CD206-positive M2-like cells induced by NOTCH2 overexpression (P < 0.001) (Figure 4B). Taken together, these results indicate that elevated NOTCH2 expression in colorectal cancer cells may promote CD206-positive M2-like polarization through an IL-4-dependent mechanism.
This study demonstrates that NOTCH2 is significantly overexpressed in CRC and correlates with poor patient prognosis. Functional experiments revealed that NOTCH2 promotes CRC cell proliferation, migration, and invasion by inducing EMT. NOTCH2 manipulation was accompanied by coordinated GATA3/IL-4 changes, and Transwell co-culture assays with flow cytometric validation confirmed that NOTCH2-associated IL-4 expression contributes to M2-like macrophage polarization. Clinical tissue analysis further validated the coordinated upregulation of NOTCH2, GATA3, IL-4, CD163, and Vimentin, alongside E-cadherin downregulation, in CRC specimens. Collectively, these findings position NOTCH2 as a candidate driver of EMT that is associated with remodeling of the immune microenvironment toward an immunosuppressive state in CRC.
DATA AVAILABILITY:
The data provided in this study are stored in ScienceDB: https://www.scidb.cn/s/7F3Eju.
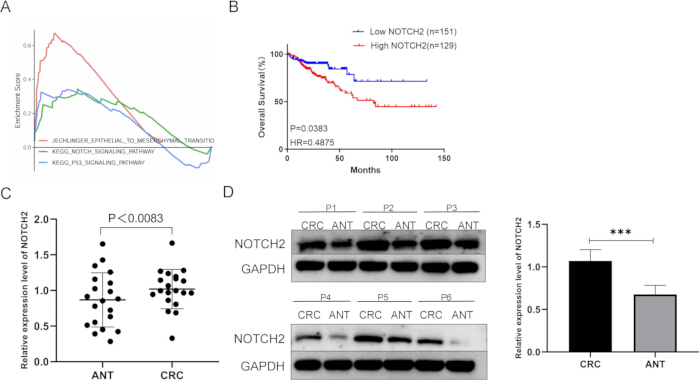
Figure 1: NOTCH2 is upregulated in CRC and correlates with EMT signaling pathways and poor prognosis. (A) GSEA shows enrichment of the EMT, NOTCH, and p53 signaling pathways in the NOTCH2-high expression group. (B) Kaplan-Meier survival analysis of OS in CRC patients with high (n = 129) and low (n = 151) NOTCH2 expression (P = 0.0383, HR = 0.4875, 95% CI 0.30–0.80; low- vs. high-NOTCH2 group). (C) The relative mRNA expression levels of NOTCH2 in paired clinical CRC tissues and adjacent normal tissues (ANT) (P = 0.0083). (D) Western blot analysis evaluating NOTCH2 protein expression in 6 representative paired clinical specimens (P1-P6, left panel) and the corresponding quantitative analysis of relative protein levels (right panel). GAPDH served as the internal loading control. Data are presented as the mean ± SEM. ***P < 0.001 versus the ANT group. Please click here to view a larger version of this figure.
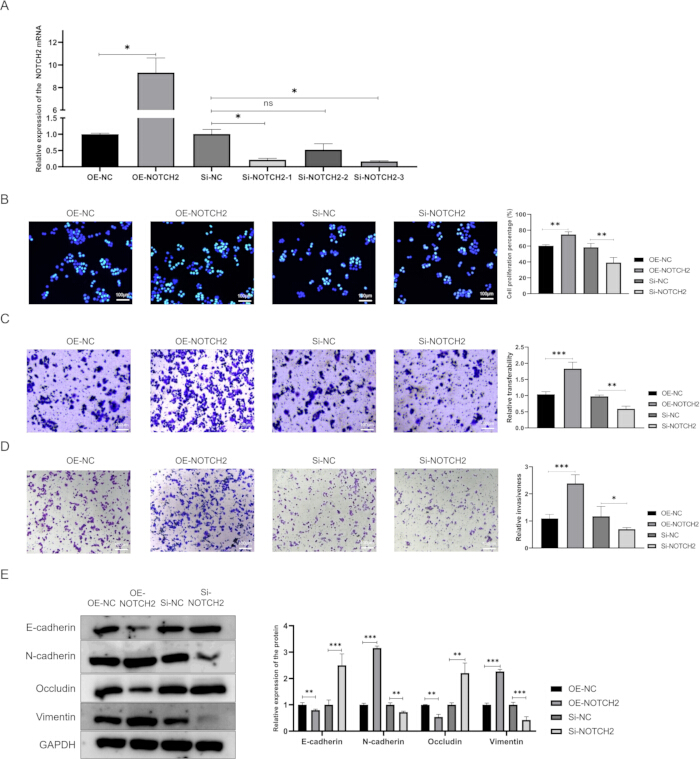
Figure 2: NOTCH2 promotes EMT in vitro. (A) qRT-PCR analysis of NOTCH2 mRNA expression following NOTCH2 overexpression or knockdown. (B) Representative images and quantitative analysis of the cell proliferation percentage evaluated by the EdU incorporation assay following transfection with OE-NOTCH2, si-NOTCH2, or their respective negative controls (OE-NC, si-NC). (C) Representative images and quantitative analysis of relative migratory capacity (migration) utilizing the Transwell assay. (D) Representative images and quantitative analysis of relative invasiveness utilizing the Transwell invasion assay. (E) Western blot analysis and corresponding quantitative results of EMT-related markers. The protein expression levels of E-cadherin, N-cadherin, Occludin, and Vimentin were evaluated in cells with NOTCH2 overexpression or knockdown. Data are presented as the mean ± SEM of three independent experiments. *P < 0.05, **P < 0.01, ***P < 0.001 versus the respective control group. Scale bar: 100 µm. Please click here to view a larger version of this figure.
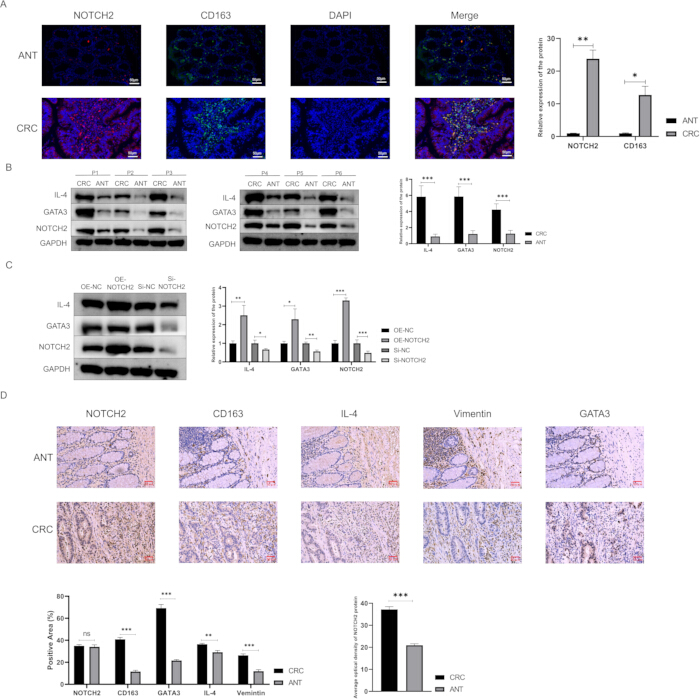
Figure 3: NOTCH2 correlates with the GATA3/IL-4 axis, M2-like macrophage infiltration, and EMT in clinical CRC tissues. (A) Representative immunofluorescence (IF) images and quantitative analysis showing the co-localization and expression levels of NOTCH2 (red) and the M2-like macrophage marker CD163 (green). Nuclei were counterstained with DAPI (blue). (B) Western blot analysis and corresponding quantitative results of IL-4, GATA3, and NOTCH2 protein expression in 6 paired clinical patient specimens (CRC tissues and ANT, P1-P6). (C) Western blot analysis and quantitative evaluation of IL-4, GATA3, and NOTCH2 protein levels in CRC cells following transfection with OE-NOTCH2, si-NOTCH2, or their respective negative controls. (D) Representative immunohistochemistry (IHC) images demonstrating the expression and localization of NOTCH2, CD163, IL-4, Vimentin, and GATA3 in human CRC tissues and ANT. The lower panels show the quantitative analysis of the positive area percentage for each respective marker and the average optical density specifically for NOTCH2 protein. Data are presented as the mean ± SEM. *P < 0.05, **P < 0.01, ***P < 0.001 versus the respective control group; ns, not significant. Scale bar: 50 µm. Please click here to view a larger version of this figure.
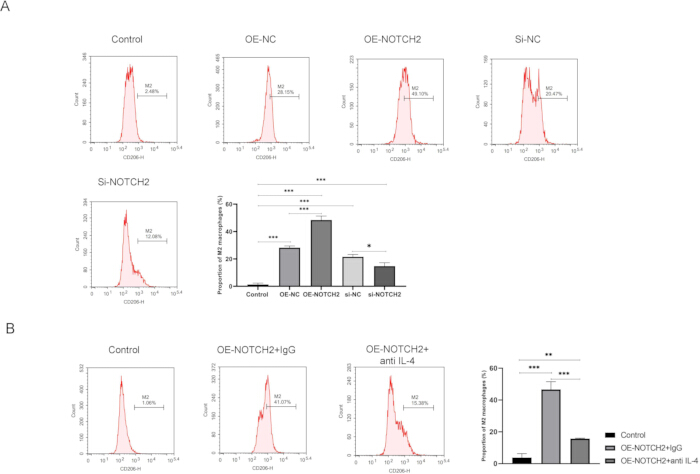
Figure 4: NOTCH2-associated IL-4 expression contributes to M2-like macrophage polarization. (A) Representative flow cytometry plots showing the percentage of CD206+ (M2-like) macrophages after 48 h of co-culture with OE-NC, OE-NOTCH2, si-NC, or si-NOTCH2 HCT116 cells in Transwell chambers. (B) Percentage of CD206+ (M2-like) macrophages after 48 h of co-culture with OE-NOTCH2 HCT116 cells in the presence of an IL-4-neutralizing antibody or an isotype control antibody. Data are presented as the mean ± SEM of three independent experiments. *P < 0.05, **P < 0.01, ***P < 0.001 versus the respective control group. Please click here to view a larger version of this figure.
| GAPDH-Forward | 5’-GGAGCGAGATCCCTCCAAAAT-3’ |
| GAPDH-Reverse | 5’-GGCTGTTGTCATACTTCTCATGG-3’ |
| NOTCH2-Forward | 5’-ACTGTGGACGAGTGTCTGTTG-3’ |
| NOTCH2-Reverse | 5’-GCAACAGCGAATAGCCTCTTG-3’ |
Table 1: The sequences of primers.
Supplementary Table 1: TCGA colorectal cancer cohort data used for NOTCH2 expression and survival analyses. Please click here to download this file.
Discussie
In this study, NOTCH2 expression was associated with CRC EMT-related phenotypes and with changes in the immune microenvironment. NOTCH2 overexpression enhanced proliferation, migration, invasion, and an EMT-associated shift in E-cadherin and Vimentin, whereas NOTCH2 knockdown produced the opposite effects. In parallel, NOTCH2 manipulation was accompanied by changes in GATA3 and IL-4 expression, and IL-4 neutralization attenuated the increase in CD206-positive M2-like cells observed in the NOTCH2-overexpression co-culture condition. These findings are consistent with broader evidence linking Notch signaling to EMT and tumor-microenvironment remodeling in CRC12, 15, 18. Collectively, our data support an association between NOTCH2 activity, EMT-associated phenotypes, GATA3/IL-4 expression, and M2-like macrophage polarization. However, the present experiments do not establish direct transcriptional regulation of GATA3 or IL4 by NOTCH2.
Beyond its intrinsic effects on tumor cells, our findings suggest that NOTCH2 may also participate in remodeling the immune microenvironment. Classical immunological studies have shown that Notch signaling can promote Th2 differentiation and IL-4 expression through GATA3-dependent mechanisms and regulation of IL4-associated regulatory elements22, 23. However, these mechanisms were established primarily in immune cells and cannot be directly extrapolated to CRC cells. In cancer, IL-4 can influence TAM phenotypes20, and CRC-cell-derived IL-4 has been implicated in M2-like macrophage changes21. In the present study, NOTCH2 gain- and loss-of-function were accompanied by concordant changes in GATA3 and IL-4 expression, while IL-4 neutralization attenuated the CD206-positive M2-like shift associated with NOTCH2 overexpression. These observations suggest that IL-4 contributes functionally to NOTCH2-associated macrophage polarization, whereas the molecular relationship between NOTCH2, GATA3, and IL4 transcription remains to be defined.
TAMs are major components of the TME and can contribute to immune suppression, angiogenesis, extracellular matrix remodeling, and metastatic progression7, 25. In CRC, CD163-positive TAMs, particularly at the invasive front, have been associated with EMT, metastatic behavior, and poor prognosis10, 26. In our clinical specimens, NOTCH2, GATA3, IL-4, and CD163 showed coordinated expression changes, while the co-culture and IL-4-neutralization experiments provided functional evidence that IL-4 contributes to the NOTCH2-associated increase in M2-like polarization in vitro. The tissue data, however, demonstrate association and co-expression only and should not be interpreted as evidence of a causal macrophage-polarization mechanism in patients.
Several experimental approaches could further define these relationships. Additional CRC cell lines with diverse mutational backgrounds, such as SW480, HT-29, and DLD-1, should be examined to assess the generalizability of the observed associations among NOTCH2, GATA3, IL-4, and macrophage polarization. CRISPR-Cas9-mediated NOTCH2 knockout combined with GATA3 rescue experiments would help determine whether GATA3 is required for the NOTCH2-associated changes in IL-4 expression. Three-dimensional tumor organoid-macrophage co-culture systems and orthotopic models with macrophage profiling would provide additional physiological validation. Pharmacological studies using gamma-secretase inhibitors could evaluate therapeutic tractability while accounting for the context-dependent biology and toxicity of pathway-level Notch inhibition. Furthermore, ChIP-qPCR and reporter assays targeting candidate IL4 regulatory elements would be required to determine whether GATA3 directly regulates IL4 transcription in CRC cells.
Despite these findings, our study has several limitations. First, the macrophage experiments were performed in an in vitro PBMC Transwell co-culture system, including IL-4 neutralization, but the immune-microenvironment findings were not validated in an immunocompetent in vivo CRC model. Such models would be important for evaluating macrophage polarization in the context of systemic immunity. Second, the clinical tissue-validation cohort was relatively small, and larger independent or multicenter cohorts are required to evaluate the prognostic robustness of NOTCH2 and its associated markers. Third, although GATA3 and IL-4 expression changed following NOTCH2 gain- and loss-of-function, the present experiments do not establish the molecular hierarchy among NOTCH2, GATA3, and IL4. ChIP-qPCR, reporter assays, genetic rescue experiments, and other mechanistic studies would be required to determine whether these relationships involve direct transcriptional regulation. Finally, the current study relies primarily on HCT116 cells; validation in additional CRC cell lines with different molecular backgrounds and in organoid models would strengthen generalizability.
Regarding translational relevance, the observed association between NOTCH2, EMT-related phenotypes, GATA3/IL-4 expression, and M2-like macrophage polarization identifies a candidate molecular relationship that warrants further validation as a potential biomarker or therapeutic target. However, this study did not test NOTCH2-directed therapy, effects on metastasis in vivo, or therapeutic reprogramming of the tumor microenvironment. Future pharmacological and animal studies are therefore required before concluding that NOTCH2 targeting can suppress CRC metastasis or remodel antitumor immunity.
Openbaarmakingen
The authors declare no conflict of interest. Generative AI tools were used during manuscript revision for language editing and editorial assistance. The authors reviewed and verified the revised content and take full responsibility for the accuracy, integrity, and final wording of the manuscript.
Dankbetuigingen
The authors appreciate each participant providing assistance in this study. This work was supported by the National Natural Science Foundation of China (81572874), National Natural Science Fund Youth Fund of China (81702411), Zhongnan Hospital of Wuhan University, and Technology and Innovation Seed Fund (znpy2016058).
Materialen
| Naam | Bedrijf | Catalogusnummer | Opmerkingen |
|---|---|---|---|
| Alexa Fluor 488-conjugated Goat Anti-Rabbit IgG | Affinity Biosciences | S0011; RRID: AB_2844800 | |
| Alexa Fluor 594-conjugated Goat Anti-Mouse IgG | Affinity Biosciences | S0016; RRID: AB_2844804 | |
| Anti-CD163 antibody | Affinity Biosciences | DF8235; RRID: AB_2841532 | |
| Anti-E-cadherin antibody | Affinity Biosciences | BF3043; https://www.affbiotech.cn/goods-22490-BF3043-E_cadherin_Recombinant_Rabbit _mAb.html | |
| Anti-GAPDH antibody | Affinity Biosciences | AF7021; RRID: AB_2839421 | |
| Anti-GATA3 antibody | Affinity Biosciences | AF6233; RRID: AB_2834800 | |
| Anti-IL-4 antibody | Affinity Biosciences | AF5142; RRID: AB_2837628 | |
| Anti-IL-4 Neutralizing Antibody | R&D Systems | MAB204 | |
| Anti-N-cadherin antibody | Affinity Biosciences | AF6710; RRID: AB_2847433 | |
| Anti-NOTCH2 antibody | Affinity Biosciences | DF7188; RRID: AB_2839140 | |
| Anti-Occludin antibody | Affinity Biosciences | DF7504; RRID: AB_2841004 | |
| Anti-Vimentin antibody | Affinity Biosciences | AF7013; RRID: AB_2835318 | |
| BCA Protein Assay Kit | GZYXbio | SJ1054A | |
| BD FACSCanto II Flow Cytometer | BD Biosciences | FACSCanto II | |
| Bovine Serum Albumin (BSA) | GZYXbio | SJ7906 | |
| Cell Culture Medium | Gibco | 11965092 | |
| CFX96 Real-Time PCR Detection System | Bio-Rad | N/A | |
| ChemiDoc Imaging System | Bio-Rad | N/A | |
| Corning Matrigel Basement Membrane Matrix | Corning | 356234 | |
| Crystal Violet (0.1%) | Sigma-Aldrich | C0775 | |
| DAB Substrate Kit (for IHC) | biosharp | BL4571A | |
| DAPI (Nucleic acid stain) | Sigma-Aldrich | D9542 | |
| EdU Cell Proliferation Assay Kit | biosharp | BL915A | |
| Empty vector control (OE-NC) | GZYXbio | PCDNA3.1 | |
| Enhanced Chemiluminescence (ECL) Substrate Kit | biosharp | BL520A | |
| Fetal Bovine Serum (FBS) | Gibco | 10099141 | |
| FITC Anti-Human CD206/MMR Antibody[15-2] | Elabscience | FITC Anti-Human CD206 MMR Antibody[15-2] | |
| FlowJo Software | FlowJo, LLC | Version 10.8.1 | |
| Gene Set Enrichment Analysis (GSEA) software | Broad Institute | Version 4.3.2 | |
| GraphPad Prism | GraphPad Software | Version 9.5.0 | |
| HRP-conjugated Goat Anti-Mouse IgG (H+L) | Affinity Biosciences | S0002; RRID: AB_2839430 | |
| HRP-conjugated Goat Anti-Rabbit IgG (H+L) | Affinity Biosciences | S0001; RRID: AB_2839429 | |
| Human colorectal cancer cell line HCT116 | ATCC | CCL-247 | |
| Human TruStain FcX (Fc Receptor Blocking Reagent) | BioLegend | 422302 | |
| ImageJ software | NIH | Version 1.53c | |
| Leica TCS SP8 Confocal Laser Scanning Microscope | Leica | TCS SP8 | |
| Lipofectamine 2000 Transfection Reagent | Invitrogen | 11668019 | |
| Negative control siRNA (Si-NC) | GZYXbio | Sense:UUCUCCGAACGUGUCAC GUdTdT,Antisense:ACGUGACAC GUUCGGAGAAdTdT | |
| NOTCH2 overexpression plasmid (OE-NOTCH2) | GZYXbio | NM_001200001.2 | |
| Olympus BX53 Bright-Field Microscope | Olympus | BX53 | |
| Olympus IX73 Fluorescence/Bright-Field Microscope | Olympus | IX73 | |
| Paraformaldehyde (4%) | GZYXbio | S19942 | |
| PCR Primers (GAPDH, NOTCH2, E-cadherin, Vimentin, GATA3, IL-4) | GZYXbio | N/A | |
| Penicillin-Streptomycin (100X) | Gibco | 15140122 | |
| Phorbol 12-Myristate 13-Acetate (PMA) | Sigma-Aldrich | P8139 | |
| PrimeScript RT Master Mix (Reverse Transcription Kit) | TaKaRa | RR047A | |
| Protease and Phosphatase Inhibitor Cocktail | GZYXbio | 784401 | |
| PVDF Membrane | Millipore | IPVH00010 | |
| R software | R Foundation for Statistical Computing | Version 4.2.2 | |
| RIPA Lysis Buffer | GZYXbio | 899001 | |
| RPMI-1640 Medium | Gibco | 11965092 | |
| Small interfering RNA targeting NOTCH2 (Si-NOTCH2) | GZYXbio | Sense:GGCAUCUGCCUACUACA ACdTdT,Antisense:GUUGUAG UAGGCAGAUGCCdTdT | |
| TB Green Premix Ex Taq II (SYBR Green Master Mix) | TaKaRa | RR820A | |
| The Cancer Genome Atlas (TCGA) database | NIH / NCI | https://portal.gdc.cancer.gov/ | |
| Transwell Inserts (8-μm pore size) | Corning | 3422 | |
| Triton X-100 (0.3%) | GZYXbio | SJ8787 | |
| TRIzol Reagent | Invitrogen | 15596026 |
Referenties
- Sung H et al. Global Cancer Statistics 2020: GLOBOCAN Estimates of Incidence and Mortality Worldwide for 36 Cancers in 185 Countries. CA Cancer J Clin. 2021;71(3):209-249.
- Dongre A, Weinberg RA. New insights into the mechanisms of epithelial-mesenchymal transition and implications for cancer. Nat Rev Mol Cell Biol. 2019;20(2):69-84.
- Nieto MA, Huang RY, Jackson RA, Thiery JP. EMT: 2016. Cell. 2016;166(1):21-45.
- Bakir B, Chiarella AM, Pitarresi JR, Rustgi AK. EMT, MET, Plasticity, and Tumor Metastasis. Trends Cell Biol. 2020;30(10):764-776.
- Lu W, Kang Y. Epithelial-Mesenchymal Plasticity in Cancer Progression and Metastasis. Dev Cell. 2019;49(3):361-374.
- Su S et al. A positive feedback loop between mesenchymal-like cancer cells and macrophages is essential to breast cancer metastasis. Cancer Cell. 2014;25(5):605-620.
- Mantovani A, Allavena P, Marchesi F, Garlanda C. Macrophages as tools and targets in cancer therapy. Nat Rev Drug Discov. 2022;21(11):799-820.
- Wang H, Tian T, Zhang J. Tumor-Associated Macrophages (TAMs) in Colorectal Cancer (CRC): From Mechanism to Therapy and Prognosis. Int J Mol Sci. 2021;22(16):8470.
- Murray PJ et al. Macrophage activation and polarization: nomenclature and experimental guidelines. Immunity. 2014;41(1):14-20.
- Yang C et al. Elevated CD163+/CD68+ Ratio at Tumor Invasive Front is Closely Associated with Aggressive Phenotype and Poor Prognosis in Colorectal Cancer. Int J Biol Sci. 2019;15(5):984-998.
- Zhou B et al. Notch signaling pathway: architecture, disease, and therapeutics. Signal Transduct Target Ther. 2022;7(1):95.
- Shi Q et al. Notch signaling pathway in cancer: from mechanistic insights to targeted therapies. Signal Transduct Target Ther. 2024;9(1):128.
- Kovall RA, Gebelein B, Sprinzak D, Kopan R. The Canonical Notch Signaling Pathway: Structural and Biochemical Insights into Shape, Sugar, and Force. Dev Cell. 2017;41(3):228-241.
- Kopan R, Ilagan MX. The canonical Notch signaling pathway: unfolding the activation mechanism. Cell. 2009;137(2):216-233.
- Chen J et al. miR-598 inhibits metastasis in colorectal cancer by suppressing JAG1/Notch2 pathway stimulating EMT. Exp Cell Res. 2017;352(1):104-112.
- Chu D et al. Notch2 expression is decreased in colorectal cancer and related to tumor differentiation status. Ann Surg Oncol. 2009;16(12):3259-3266.
- Wang WJ et al. Increased LEF1 expression and decreased Notch2 expression are strong predictors of poor outcomes in colorectal cancer patients. Dis Markers. 2013;35(5):395-405.
- Jackstadt R et al. Epithelial NOTCH Signaling Rewires the Tumor Microenvironment of Colorectal Cancer to Drive Poor-Prognosis Subtypes and Metastasis. Cancer Cell. 2019;36(3):319-336.e7.
- Gordon S. Alternative activation of macrophages. Nat Rev Immunol. 2003;3(1):23-35.
- Wang HW, Joyce JA. Alternative activation of tumor-associated macrophages by IL-4: priming for protumoral functions. Cell Cycle. 2010;9(24):4824-4835.
- Zhu X et al. Tumor-associated macrophage-specific CD155 contributes to M2-phenotype transition, immunosuppression, and tumor progression in colorectal cancer. J Immunother Cancer. 2022;10(9):e004219.
- Amsen D et al. Instruction of distinct CD4 T helper cell fates by different notch ligands on antigen-presenting cells. Cell. 2004;117(4):515-526.
- Fang TC et al. Notch directly regulates Gata3 expression during T helper 2 cell differentiation. Immunity. 2007;27(1):100-110.
- Goossens S, Vandamme N, Van Vlierberghe P, Berx G. EMT transcription factors in cancer development re-evaluated: Beyond EMT and MET. Biochim Biophys Acta Rev Cancer. 2017;1868(2):584-591.
- Greten FR, Grivennikov SI. Inflammation and Cancer: Triggers, Mechanisms, and Consequences. Immunity. 2019;51(1):27-41.
- Wei C et al. Crosstalk between cancer cells and tumor associated macrophages is required for mesenchymal circulating tumor cell-mediated colorectal cancer metastasis. Mol Cancer. 2019;18(1):64.