Deze studie toont aan dat Qiming Granule (QMG) diabetische retinopathie (DR) verbetert door de darm-retina-as te moduleren. QMG hervormde de darmmicrobiota, onderdrukte systemische inflammatie en herstelde het op CMKLR1 gecentreerde regulatienetwerk, waardoor histopathologische schade aan het netvlies werd omgekeerd. Deze bevindingen positioneren QMG als een veelbelovende darm-retina therapeutische strategie voor DR.
Onderzoeksartikel
Correlationele analyse van Qiming Granule met het CMKLR1-gecentreerde netwerk en systemische inflammatie via de darm-retina-as bij diabetische retinopathie
In dit artikel
Samenvatting
Samenvatting
Diabetische retinopathie (DR) is een neurovasculaire complicatie die wordt gedreven door chronische hyperglykemie en systemische inflammatie, waarbij opkomend bewijs de darm-retina-as markeert als een kritiek maar onderbenut therapeutisch doelwit. Deze studie onderzoekt of Qiming Granule (QMG) zijn beschermende werking tegen DR uitoefent door de darm-retina-as te moduleren. C57BL/6-muizen werden gerandomiseerd in experimentele groepen en onderworpen aan verschillende interventies. Retinale histopathologische veranderingen werden beoordeeld via hematoxyline-eosin (HE)-kleuring. Serumspiegels van inflammatoire cytokinen (IL-1β, IL-6, TNF-α) werden gemeten met een enzyme-linked immunosorbent assay (ELISA). De expressie van belangrijke regulatoire eiwitten (CMKLR1, Wnt5a, PPAR-γ, AP-1, TP53) in zowel retinale als coloniweefsels werd gedetecteerd via Western blot (WB). De samenstelling en diversiteit van het darmmicrobioom werden gekarakteriseerd door full-length 16S rDNA-sequencing. Correlationele analyses werden uitgevoerd om de relaties tussen het darmmicrobioom en inflammatoire factoren of belangrijke eiwitten te beoordelen. QMG-behandeling verbeterde retinale histopathologische abnormaliteiten, getuige de herstel van de laminaire architectuur van de retina, gedeeltige herstel van het aantal retinale ganglioncellen (P < 0,001) en het omkeren van retinale verdunning (P < 0,01). Het verlaagde daarnaast significant de serumspiegels van IL-1β, IL-6 en TNF-α (P < 0,0001). Langs de darm-retina-as keerde QMG de abnormale expressie van belangrijke regulatoire eiwitten om, in het bijzonder het CMKLR1-gecentreerde netwerk (Wnt5a, PPAR-γ, AP-1, TP53). Bovendien herstelde QMG de samenstelling, diversiteit en functie van het darmmicrobioom, en correlationele analyses onthulden dat QMG systemische inflammatie koppelt aan deze regulatoire eiwitten om de darm-retina-as te moduleren. Deze studie levert preliminaire farmacologische bewijzen dat QMG DR verbetert door het CMKLR1-gecentreerde regulatoire netwerk (inclusief Wnt5a, PPAR-γ, AP-1 en TP53) en systemische inflammatie te koppelen via de darm-retina-as, waardoor QMG wordt gepositioneerd als een veelbelovende therapeutische strategie via de darm-retina-as voor DR.
Inleiding
Diabetische retinopathie (DR), een van de meest voorkomende microvasculaire complicaties van diabetes mellitus (DM), is wereldwijd een belangrijke oorzaak van blindheid bij volwassenen in de werkende leeftijd1. Wereldwijd treft DR ongeveer 20–30% van de DM-populatie2. Chronische hyperglykemie drijft de pathogenese van DR aan door een cascade van pathologische gebeurtenissen te triggeren, waaronder een verslechterde neurovasculaire koppeling, verhoogde ontstekingsreacties en oxidatieve stress3. Onlangs zijn veranderingen in de diversiteit en samenstelling van de darmmicrobiota waargenomen bij diabetische patiënten met retinopathie in vergelijking met patiënten zonder deze aandoening4,5. Bijgevolg is de darm-retina-as — een bidirectioneel communicatienetwerk dat intestinale homeostase verbindt met de gezondheid van het netvlies — naar voren gekomen als een nieuwe factor die bijdraagt aan de progressie van DR. De specifieke moleculaire mediatoren die darm-retina-signalen vertalen naar retinopathologie zijn echter grotendeels onbekend, wat de identificatie van betrouwbare biomarkers en therapeutische doelwitten beperkt.
De darm-retina-as beschrijft een complex bidirectioneel communicatienetwerk tussen de intestinale microbiota en hun metabolieten enerzijds en het retinale weefsel anderzijds via immunologische, metabole, neuroendocriene en vasculaire routes, waardoor hun homeostatisch evenwicht wordt gemoduleerd6. Op moleculair niveau wordt de darm-retina-as gekenmerkt door de dysregulatie van belangrijke stress-responsieve en celbestemmingsbepalende eiwitten, in het bijzonder AP-1 en TP537,8,9. Daarnaast blijkt CMKLR1, een belangrijke chemokine-receptor, een cruciale mediator te zijn van endotheeldisfunctie en metabole dysregulatie, wat een kritieke verbinding vormt tussen veranderingen in de darmmicrobiota en de pathogenese van diabetische retinopathie10. Belangrijk is dat Wnt-signalering een dubbele regulerende rol vervult bij het handhaven van de vasculaire homeostase van de retina en de functie van de intestinale epitheliale barrière11, terwijl PPAR-signalering fungeert als een hoofdregulator van inflammatoire reacties en metabole processen in zowel oculair als intestinaal weefsel12,13. Deze moleculaire spelers vormen gezamenlijk een onderling verbonden signaleringsnetwerk binnen de darm-retina-as, wat nieuwe mechanistische inzichten en therapeutische mogelijkheden biedt voor diabetesgerelateerde complicaties. Het targeten van structurele en functionele veranderingen langs deze as vormt daarom een veelbelovende strategie voor het beheer van DR.
Traditionele Chinese Geneeskunde (TCM) heeft historisch gezien een belangrijke rol gespeeld bij de behandeling van diabetes en de daarmee samenhangende retinopathie, waarbij therapeutische beslissingen gebaseerd zijn op syndroomdifferentiatie14. Qiming Granule (QMG), bestaande uit Astragalus membranaceus, Pueraria lobata, Rehmannia glutinosa, Lycium barbarum, Senna obtusifolia, Leonurus japonicus, Typha angustifolia, en Whitmania pigra, wordt op brede schaal toegepast bij de behandeling van DR. QMG is goedgekeurd door de National Medical Products Administration van China (Goedkeuringsnr. Z20090036), heeft klinische studies succesvol afgerond en heeft een handelsvergunning ontvangen. QMG vertoont beschermende effecten door de verdikking van het basaalmembraan in de capillairen van het netvlies te voorkomen, schade aan pericyten en de microvasculatuur van het netvlies te verminderen en de lokale pathologische morfologie van het oog te behouden15, waardoor het een veelbelovende therapie is voor de aanpak van DR. Door zich te richten op sleutelproteïnen en inflammatoire factoren, oefenen de actieve componenten van QMG anti-inflammatoire, antioxidatieve en anti-apoptotische effecten uit, wat een mechanistische basis biedt voor de modulatie van de darm-retina-as16. Deze eigenschappen vormen een mechanistische basis voor de potentiële modulatie van de darm-retina-as door QMG, maar weinig studies hebben deze link onderzocht. Daarom is deze studie erop gericht de effectiviteit van QMG bij het moduleren van de darm-retina-as te valideren, om experimenteel bewijs te leveren voor het therapeutische potentieel bij DR.
Deze studie slaat een brug tussen theoretische voorspellingen en in vivo experimentele gegevens om de werkzaamheid van QMG bij het moduleren van de darm-retina-as te valideren. Deze bevindingen tonen aan dat QMG DR verbetert door het CMKLR1-gecentreerde regulatoire netwerk (inclusief Wnt5a, PPAR-γ, AP-1 en TP53) te koppelen aan systemische inflammatie via de darm-retina-as, waardoor QMG wordt gepositioneerd als een veelbelovende, op de darm-retina-as gerichte therapeutische strategie voor DR. De grafische samenvatting wordt getoond in Figuur 1.
Protocol
Alle dierproeven werden uitgevoerd in overeenstemming met de ARRIVE-richtlijnen. De studie werd goedgekeurd door de Ethische Toetsingscommissie van Sichuan Scientist Biotechnology Co., Ltd. (IACUC ISSUE SYST-2024-011). Een gedetailleerde experimentele tijdlijn die het studieontwerp samenvat, is weergegeven in Aanvullende Figuur 1.
Voorbereiding en behandeling van dieren
Muizen werden diep genarceerd met 2% isofluraan via inhalatie. Onder diepe anesthesie werd bloed afgenomen via retro-orbitale enucleatie. Direct na de bloedafname werden de oogballen geënucleerd voor het oogsten van retinaal weefsel. Vervolgens werd onder diepe anesthesie cervicale dislocatie uitgevoerd om euthanasie te waarborgen. Colonweefsels werden daarna onmiddellijk gedisseceerd. Dieren die bijwerkingen vertoonden, werden prompt uit de studie verwijderd en kregen de passende veterinaire zorg.
Randomisatie en blindering
Mannelijke C57BL/6-muizen, 5 weken oud en met een gewicht tussen 20 en 30 gram, werden gehuisvest onder strikt gereguleerde omstandigheden, waaronder temperatuur en luchtvochtigheid. Na één week acclimatisatie werden de C57BL/6-muizen via een door de computer gegenereerde willekeurige reeks in drie groepen verdeeld (controle-, model- en interventiegroepen). De randomisatiesequentie werd gegenereerd door een onderzoeker die niet betrokken was bij de verzorging van de dieren of de beoordeling van de resultaten.
Om blindering te waarborgen, werden alle dierverzorging, toediening van geneesmiddelen en gegevensverzameling uitgevoerd door onderzoekers die niet op de hoogte waren van de groepsindeling. De gecodeerde groepstoewijzingen werden pas onthuld na voltooiing van alle experimenten en statistische analyses. De blindering was van toepassing op: de technicus die de orale gavage uitvoerde; de patholoog die de histologie van het netvlies evalueerde; en de analist die de Western blot (WB) banden kwantificeerde.
Berekening van de steekproefomvang
De steekproefomvang werd bepaald op basis van een voorlopig experiment waarin de aantallen retinale ganglioncellen (RGC) werden geëvalueerd onder dezelfde experimentele omstandigheden. Uitgaande van een tweezijdige significantieniveau (α) van 0,05 en een statistische power (1-β) van 0,80, waren minimaal 5 muizen per groep nodig om een klinisch relevant verschil in RGC-aantallen tussen de model- en interventiegroepen te detecteren. Rekening houdend met een potentieel uitvalpercentage van ongeveer 20%, werd elke groep vastgesteld op 6 muizen.
Opzetten van diabetische dieren
De controlegroep kreeg een standaarddieet, terwijl de interventie- en modelgroepen gedurende vier weken een vet- en suikerrijk dieet (HFHSD) kregen. Na deze dieetperiode ondergingen de interventie- en modelgroepen een intraperitoneale injectie met een 1% streptozotocine (STZ)-oplossing in een dosering van 35 mg/kg17,18,19,20. Na zeventig twee uur na de injectie werden muizen met een nuchtere bloedglucosewaarde van meer dan 16,7 mmol/L beschouwd als een succesvol geïnduceerd DM-model en geselecteerd voor verdere experimenten. De DM-dieren bleven nog vier maanden een vet- en suikerrijk dieet volgen, terwijl de controlegroep hun standaarddieet behield.
Taxonomische validatie en kwaliteitsbeoordeling
De acht ingrediënten in QMG werden taxonomisch gevalideerd met behulp van de Modernized Plant Names Search (MPNS, http://mpns.kew.org/mpns-portal/). De kwaliteit van de rapportage over de samenstelling van de QMG werd geëvalueerd met de ConPhYMP-tool.
Toedieningsmethoden
In de interventiegroep kregen de dieren QMG oraal toegediend. QMG werd gekocht bij Zhejiang Sansheng Mandi Pharmaceutical Co., Ltd. (Chinese National Drug Approval No. Z20090036). De QMG-suspensie werd bereid door QMG gelijkmatig te mengen met gedestilleerd water. Muizen in de interventiegroep kregen de suspensie via orale gavage toegediend in een volume dat gelijk was aan dat van de model- en blanco-groepen. De dosering werd berekend op basis van de klinische enkelvoudige therapeutische dosis van 4,5 g per 60 kg volwassene (de standaard eenheidsdosis van de op de markt verkrijgbare formulering) met behulp van de normalisatiemethode voor het lichaamsoppervlak (BSA), zoals aanbevolen door de FDA en Reagan-Shaw21. De conversiefactor tussen volwassen mensen (Km = 37) en muizen (Km = 3) was 12,33, wat resulteerde in een muisendosis van 0,9 g/kg lichaamsgewicht. De modelgroep en de blancogroep kregen een gelijk volume fysiologisch zout via orale gavage. De toediening vond dagelijks plaats tussen 9:00 en 11:00 uur gedurende een aaneengesloten periode van 3 maanden.
Observatie en testindicatoren
Algemene monitoring van vitale functies
De algemene vitale functies en fysiologische indicatoren, waaronder lichaamsgewicht, bloedglucosewaarden, water- en voedselconsumptie, urineproductie, activiteitsniveaus en gedrag, lichaamstemperatuur, alsook de conditie van de vacht en huid, werden systematisch waargenomen en vastgelegd om therapeutische interventies uitgebreid te beoordelen en potentiële complicaties op te sporen.
Observatie van morfologische veranderingen in het netvlies door HE-kleuringsanalyse
Alle specimens werden na fixatie verwerkt via een automatische dehydrator met behulp van een serie ethanol- en xyleenoplossingen, gevolgd door inbedding in paraffine. Vervolgens werden paraffinecoupes van 4 µm gesneden en gekleurd met HE, om daarna te worden gemonteerd met neutrale gom. Retinale beelden werden gescand met een 3DHISTECH Pannoramic SCAN scanner. Beeldanalyse en datametingen werden uitgevoerd met Image-Pro Plus.
Detectie van serum IL-6, TNF-α en IL-1β via ELISA-analyse
Bloedmonsters werden verzameld via retro-orbitale enucleatie. Serum werd gescheiden door centrifugatie bij 1,000 × g gedurende 15 min bij 4 °C en bewaard bij -80 °C tot aan de analyse. Serumspiegels van IL‑1β, IL‑6 en TNF‑α werden gemeten volgens standaardprocedures, inclusief equilibratie van reagentia, toevoeging van monsters, incubatie, wassen, toevoeging van conjugaat en substraat, beëindiging van de reactie, meting van de optische dichtheid en berekening van de concentratie op basis van een standaardcurve. De optische dichtheid werd afgelezen bij 450 nm met een microplatelezer, en cytokineconcentraties werden berekend aan de hand van standaardcurves.
Detectie van de belangrijkste regulerende eiwitten in het netvlies en de colon via WB-analyse
Drie onafhankelijke biologische replica's werden uitgevoerd op een enkel membraan en sequentieel gesondeerd op doeleiwitten. Alle replica's waren afkomstig van een enkele cohort dieren die gelijktijdig waren geofferd. Wanneer het molecuulgewicht van een doeleiwit te dicht bij dat van GAPDH lag (<5 kDa verschil), werden deze op onafhankelijke membranen geanalyseerd om signaaloverlap te voorkomen. Elk membraan werd uitsluitend gesondeerd op óf het doeleiwit óf GAPDH om een nauwkeurige kwantificering te garanderen. De volgende primaire antilichamen werden gebruikt: GAPDH polyclonaal antilichaam (1:5000), CMKLR1 polyclonaal antilichaam (1:1000), Wnt5a polyclonaal antilichaam (1:1000), TP53 polyclonaal antilichaam (1:1000), AP-1 monoklonaal antilichaam (1:5000) en PPAR gamma (PPAR-γ) polyclonaal antilichaam (1:1000). Totale eiwitten werden verkregen door cellysis gevolgd door centrifugatie. Eiwitconcentraties werden bepaald met de BCA-assay. De geëxtraheerde eiwitten werden gescheiden via SDS-PAGE met een scheidingsgel van 12% en vervolgens overgebracht op membranen. De membranen werden geblokkeerd in TBST met 5% vetvrije melk en overnacht bij 4 °C geïncubeerd met de juiste primaire antilichamen. Na het wassen werden de membranen geïncubeerd met HRP-geconjugeerde anti-konijn of anti-muis secundaire antilichamen bij een verdunning van 1:10.000. Tot slot werden de eiwitbanden gevisualiseerd en geanalyseerd via chemiluminescentie-imaging. Tijdens de visualisatie en gegevensverwerking werden de blots horizontaal bijgesneden om irrelevante molecuulgewichtregio's te verwijderen, waarbij alle monsterbanen werden behouden zonder verwijdering van de gebieden tussen de banen. Er kan lichte vervorming van de randen optreden tijdens het bijsnijden om irrelevante gelregio's te verwijderen.
Detectie van darmmicrobiota door middel van 16S rDNA-sequencinganalyse
Verse fecesmonsters werden van elke muis verzameld voorafgaand aan de terminale procedures. Muizen werden individueel gedurende 10–15 min in steriele kooien geplaatst om spontane defecatie mogelijk te maken. Fecespellets werden onmiddellijk met steriele pincetten verzameld, overgebracht naar steriele 1,5 mL buisjes, snel bevroren in vloeibare stikstof en bewaard bij -80 °C tot de DNA-extractie. Alle procedures werden onder steriele omstandigheden uitgevoerd om kruiscontaminatie te minimaliseren. Het interval tussen defecatie en invriezen werd beperkt tot 10 min om de microbiële integriteit te waarborgen. De fecale genomische DNA (gDNA)-monsters werden gezuiverd met de Fecal gDNA extraction kit, gevolgd door amplificatie van het volledige 16S rDNA-gen via de polymerasekettingreactie (PCR) met de universele primers 8F (5’-AGAGTTTGATCATGGCTCAG-3’) en 1492R (5’-CGGTTACCTTGTTACGACTT-3’). De PCR-producten werden vervolgens geanalyseerd via agarosegelelektroforese, gezuiverd en gekwantificeerd voor verdere toepassingen. High-throughput sequencing werd uitgevoerd op de Nanopore GridION sequencer. Het proces van data-analyse omvatte basecalling, kwaliteitscontrole van de data, soortannotatie, constructie van fylogenetische bomen, community-analyse, Alpha- en Beta-diversiteitsanalyse, analyse van differentieel abundante soorten en voorspelling van de communityfunctie. Tijdens de analyse werden diverse tools en databases gebruikt, zoals NanoFilt, Usearch, de programmeertaal R, Python en de SILVA-database.
Correlatieanalyse van de darm-retina-as met systemische inflammatie en microbiota van de darmen op meerdere niveaus
Om de potentiële associaties tussen de darmmicrobiota op verschillende niveaus en serum-inflammatoire cytokinen en belangrijke regulatoire eiwitten te onderzoeken, is een correlatieanalyse uitgevoerd met behulp van het Luoning Bio-Cloud platform. In eerste instantie werden de abundantiegegevens van soorten op het niveau van koninkrijk, stam, klasse, orde, familie, genus en soort geëxtraheerd uit de sequeneringsresultaten. Fysisch-chemische factoren, waaronder serum-inflammatoire cytokinen en eiwitexpressieniveaus, werden samengesteld in een bestand met omgevingsfactoren. Om de betrouwbaarheid en visualisatie van de correlaties te waarborgen, werden de gegevens genormaliseerd om de schaalverschillen tussen microbiële abundantie en klinische meeteenheden te elimineren. De correlatiecoëfficiënten (R-waarden) en de bijbehorende significantieniveaus (P-waarden) werden berekend. De resultaten werden gevisualiseerd met een correlatie-heatmap, waarbij kleurgradiënten de sterkte en richting van de correlatie aangeven (rood staat voor een positieve correlatie, blauw voor een negatieve correlatie) en sterretjes (**) de statistische significantie aangeven (P < 0,01).
Statistische methoden
Alle statistische analyses en visualisaties zijn uitgevoerd met GraphPad Prism. De t-test om gemiddelden te vergelijken werd toegepast op gegevens die voldeden aan een normale verdeling. In gevallen waarin de gegevens afweken van normaliteit, werd de Kruskal-Wallis-test gebruikt. Voor de relaties tussen variabelen werd de correlatie van Spearman of Pearson berekend. Alle statistische tests zijn tweezijdig uitgevoerd, waarbij de statistische significantie is vastgesteld op 0,05.
Resultaten
General situation of experimental animals
Blood glucose levels were significantly elevated in the model group (27.21 ± 6.03 mmol/L) compared with the blank group (P < 0.001), indicating the successful induction of the DM model. During the study period, the experimental animals showed stable body weight, continuous water and food intake, normal urine output, body temperature, healthy fur and skin condition, and normal behavior during the experiment.
Composition and validation of QMG
QMG, a proprietary Chinese medicine that passed Phase III clinical trials, encompasses Astragalus membranaceus (Fisch.) Bunge [Fabaceae, Astragali radix], Pueraria lobata (Willd.) Ohwi [Fabaceae, Puerariae lobatae radix], Rehmannia glutinosa (Gaertn.) Libosch. Ex Fisch. & C.A. Mey. [Orobanchaceae; Rehmanniae radix], Lycium barbarum L. [Solanaceae; Lycii fructus], Senna obtusifolia (L.) H.S. Irwin & Barneby [Fabaceae; Cassiae semen], Leonurus japonicus Houtt. [Lamiaceae, Leonuri herba], Typha angustifolia L. [Typhaceae; Typhae pollen], Whitmania pigra Whitman [Hirudinidae; Hirudo]15. The detailed information, including the Chinese name, scientific name by MPNS validation, species, family, part used, representative bioactive compounds, was summarized in Table 1, which defined the QMG and provided a transparent, scientifically grounded basis for the formulas under investigation.
| No. | Chinese name | Scientific name by MPNS validation | Species | Family | Part Used | Representative bioactive compounds | |||||||
| 1 | HuangQi | Astragalus membranaceus (Fisch.) Bunge [Fabaceae, Astragali radix] | Astragalus mongholicus (Fisch.) Bunge | Fabaceae | Radix | Astragaloside IV, Calycosin | |||||||
| 2 | GeGen | Pueraria lobata (Willd.) Ohwi [Fabaceae, Puerariae lobatae radix] | Pueraria lobata (Willd.) | Fabaceae | Radix | Puerarin, Daidzin | |||||||
| 3 | DiHuang | Rehmannia glutinosa (Gaertn.) Libosch. Ex Fisch. & C.A. Mey. [Orobanchaceae; Rehmanniae radix] | Rehmannia glutinosa (Gaertn.) Libosch. Ex Fisch. & C.A. Mey. | Orobanchaceae | Radix | Catalpol, Rehmannioside D | |||||||
| 4 | GouQiZi | Lycium barbarum L. [Solanaceae; Lycii fructus] | Lycium barbarum L. | Solanaceae | Fructus | Lycium barbarum polysaccharides, Betaine | |||||||
| 5 | JueMingZi | Senna obtusifolia (L.) H.S. Irwin & Barneby [Fabaceae; Cassiae semen] | Senna obtusifolia (L.) H.S. Irwin & Barneby | Fabaceae | Semen | Aurantio-obtusin, Emodin | |||||||
| 6 | Chong WeiZi | Leonurus japonicus Houtt. [Lamiaceae, Leonuri fructus] | Leonurus japonicus Houtt. | Lamiaceae | Fructus | Stachydrine, Leonurine | |||||||
| 7 | PuHuang | Typha angustifolia L. [Typhaceae; Typhae pollen] | Typha angustifolia L. | Typhaceae | Pollen | Isorhamnetin, Kaempferol | |||||||
| 8 | ShuiZhi | Whitmania pigra Whitman [Hirudinidae; Hirudo] | Whitmania pigra Whitman | Hirudinidae | Body | Hirudin, Calin | |||||||
Table 1: The composition and quality information of QMG ingredients. Detailed information on the composition and quality information of QMG ingredients, including the Chinese name, scientific name by MPNS validation, species, family, part used, and representative bioactive compounds.
QMG ameliorates the retinal morphology
As depicted in Figure 2A, the retina of the blank group exhibited a well-organized structure. The cellular arrangement was dense and orderly across all layers, with no evidence of structural disruption, exudation, or inflammatory infiltration. Compared with the blank group, retinal sections from the model group (Figure 2B) exhibited marked structural disorganization, characterized by disordered cellular arrangement, a significant reduction in RGC counts (P < 0.0001, Table 2, Figure 3A), and pronounced thinning of the total retinal thickness (P < 0.0001, Figure 3B). Notably, neovascular tufts penetrating the inner limiting membrane were observed (indicated by a red arrow), confirming successful establishment of the DR model. In contrast, the intervention group (Figure 2C) demonstrated significant attenuation of histopathological abnormalities relative to the model group, as evidenced by restoration of retinal laminar architecture, partial recovery of RGC numbers (P < 0.001, Table 2, Figure 3A), and reversal of retinal thinning (P < 0.01, Table 2, Figure 3B). These data provide strong evidence for QMG as an effective intervention for DR.
QMG attenuates systemic inflammatory response in DR
Compared with the blank group, the expression levels of IL-1β, IL-6, and TNF-α were significantly upregulated in the model group (P < 0.0001), confirming that the modeling procedure successfully induced a marked inflammatory response. Conversely, compared with the model group, the expression levels of IL-1β, IL-6, and TNF-α were significantly downregulated in the intervention group (p < 0.0001), indicating a potent inhibitory effect of QMG on systemic inflammation. The serum concentrations of IL-1β, IL-6, and TNF-α across the three groups are summarized in Table 3 and illustrated in Figure 4A–C.
QMG modulates the CMKLR1-centered regulatory network along the gut–retina axis
As shown in Figure 5, Figure 6, Figure 7, and Supplementary Figure 2, the results of this study showed that in DR model mice, the expression levels of five key regulatory proteins—AP-1, Wnt5a, CMKLR1, TP53, and PPAR-γ—exhibited a consistent downward trend in both colonic and retinal tissues. Following QMG intervention, the expression of these proteins showed varying degrees of recovery, with some proteins reaching statistical significance. Specifically, after QMG intervention, the expression of AP-1, Wnt5a, and CMKLR1 in colonic tissue was significantly higher than that in the model group (P < 0.05), while in retinal tissue, the expression of CMKLR1 and TP53 was significantly higher than that in the model group (P < 0.01). These findings may suggest that AP-1 and Wnt5a are more sensitive responders in the colon, whereas TP53, as an apoptosis regulator, plays a more critical role in retinal neuroprotection. Notably, CMKLR1 was the only protein that achieved significant recovery in both tissues, indicating that QMG may facilitate bidirectional communication along the gut–retina axis through systemic regulation of CMKLR1 expression.
The consistent directionality of expression changes for these five proteins in both colonic and retinal tissues holds important biological significance. As the primary habitat of the gut microbiota, changes in colonic protein expression reflect the state of the intestinal microenvironment, while the retina is the effector organ of DR. The consistency of expression patterns between these two tissues strongly supports the gut–retina axis as an important participant in the pathophysiological processes of DR.
QMG restores and improves the composition, diversity, and function of gut microbiota
The results of the community composition
Hierarchical clustering analysis revealed distinct shifts in gut microbial composition and clustering at multiple taxonomic levels following QMG intervention. At the phylum level (Figure 8A), the model group exhibited a marked reduction in Firmicutes abundance and a significant enrichment of Bacteroidetes compared with the blank group, indicating a diabetes-driven shift in the Firmicutes/Bacteroidetes ratio; notably, the intervention restored the proportions of both Firmicutes and Bacteroidetes to levels approaching those of the blank group, accompanied by an elevated relative abundance of Proteobacteria. At the class level (Figure 8B), the model group manifested an elevation in Bacteroidia and Clostridia and a lessening in Bacilli and Erysipelotrichia compared with the blank group; in contrast, the intervention group showed restoration in Bacteroidia and Erysipelotrichia to levels approaching those of the blank group, accompanied by elevated relative abundance of Clostridia and Alphaproteobacteria. At the order level (Figure 8C), the model group demonstrated an elevated proportion of Bacteroidales, and a decreased proportion of Erysipelotrichales and Lactobacillales compared with the blank group; conversely, the intervention group restored the proportions of Bacteroidales and Erysipelotrichales to levels approaching those of the blank group, accompanied by an elevated relative abundance of Clostridiales. At the family level (Figure 8D), the model group presented a growth in Odoribacteraceae, Peptostreptococcaceae, Rikenellaceae, and Tannerellaceae, and a decrease in Erysipelotrichaceae, Lactobacillaceae, Muribaculaceae, and Ruminococcaceae compared with the blank group; in contrast, the intervention group downregulated the proportions of Odoribacteraceae and Peptostreptococcaceae compared with the model group; restored the proportions of Erysipelotrichaceae and Ruminococcaceae to levels approaching those of the blank group, accompanied by an elevated relative abundance of Lachnospiraceae. At the genus level (Figure 8E), the model group exhibited an upward trend in Odoribacter, Paeniclostridium, Alistipes, Parabacteroides, and Clostridioides, and a decrease trend in Lactobacillus, Faecalibaculum, Ruminococcus, Bacteroides, and Muribaculum compared with the blank group; notably, the intervention group downregulated the proportions of Odoribacter, Clostridioides, and Paeniclostridium compared with the model group; restored the proportions of Faecalibaculum and Ruminococcus to levels approaching those of the blank group; and increased the relative abundance of Lachnoclostridium, Sphingomonas, Flavonifractor, and Blautia. At the species level (Figure 8F), the model group showed an increase in Odoribacter splanchnicus, Clostridioides difficile, and Paeniclostridium sordellii, and a decrease in Faecalibaculum rodentium, Bacteroides salanitronis, Muribaculum intestinale compared with the blank group; in contrast, the intervention group downregulated the proportion of Odoribacter splanchnicus and Clostridioides difficile compared with the model group; restored the proportions of Faecalibaculum rodentium, and Muribaculum intestinale, accompanied by elevated relative abundance of Lachnoclostridium phocaeense, and Flavonifractor plautii. Collectively, these findings indicate that QMG restored gut microbial composition across multiple taxonomic levels, shifting the community structure toward a homeostatic state.
The results of the Alpha diversity and Beta diversity
As indicated by the Alpha diversity results (Figure 9A), the intervention group exhibited the highest Chao1, PD, Simpson, and Shannon indices, while the model group displayed the lowest, with the blank group showing intermediate levels. These findings underscore the detrimental impact of DR on gut microbiota diversity and demonstrate that QMG intervention effectively restores and enhances microbial richness and evenness in DR mice.
As indicated by the Beta diversity representative results (Figure 9B,C), the principal coordinates analysis (PCoA) plots revealed a distinct separation of microbial communities across the three groups, which was statistically supported by the Permutational Multivariate Analysis of Variance (PERMANOVA). Specifically, the Bray-Curtis-based analysis indicated a significant structural divergence (PERMANOVA: R2 = 0.67, P < 0.001), suggesting that the DR model and QMG intervention accounted for a substantial proportion of the variation in microbial community composition. Consistent with this, the analysis based on Weighted unique fraction (UniFrac) distance, which incorporates phylogenetic relationships between taxa, further confirmed the significant community shift (PERMANOVA: R2 = 0.58, P < 0.01).
As displayed by the Beta diversity results (Figure 9D), the non-metric multidimensional scaling (NMDS) ordination plot demonstrated a clear spatial clustering of samples according to the respective groups, with a stress value of 0.04. Given that a stress value below 0.05 is generally considered to represent an excellent representation of the community structure in a reduced-dimensional space, these results collectively suggest that the QMG intervention significantly altered the global composition of the gut microbiota.
The results of the differential abundance analysis
According to the linear discriminant analysis effect size (LEfSe) analysis (Figure 9E), the results revealed that Clostridia, Clostridiales, Lachnospiraceae, and Lachnoclostridium were remarkably enriched in the intervention group, whereas Odoribacteraceae, Odoribacter, Peptostreptococcaceae, and Paeniclostridium were notably enriched in the model group. Therefore, the above gut microbiota might be the primary differential microbiota responsible for the intergroup differences between the model and intervention groups.
The results of community function prediction
The predicted functional profiles at Level 2 and Level 3 showed distinct clustering patterns across the three groups (Figure 9F,G). Specifically, compared with the blank group, the model group exhibited a significant deviation in the relative abundance of metabolic pathways. Notably, this functional perturbation in the model group was largely ameliorated in the intervention group. The functional composition of the intervention group showed a substantial shift back towards the profile observed in the blank group, indicating that the QMG intervention effectively modulated the gut microbial functional structure. These results suggest that the intervention not only reshaped the taxonomic composition and structure of the gut microbiota but also restored its functional metabolic capacity toward a homeostatic state.
QMG modulates the gut–retina axis by coupling systemic inflammation and key regulatory proteins
Associations at global levels
At the kingdom level (Figure 10A–C), QMG improved the CMKLR1-centered network mainly by modulating Bacteria along the gut-retina axis. Specifically, Bacteria positively correlated with retinal PPAR-γ in the blank group (P < 0.01), but this association was not observed in the model group. Following QMG intervention, bacterial abundance positively correlated with retinal CMKLR1 and Wnt5a yet negatively correlated with colonic TP53 and PPAR-γ (P < 0.01).
At the phylum level (Figure 10D–F), QMG improved the CMKLR1-centered network mainly by modulating Candidatus and Bacteroidetes along the gut-retina axis. Specifically, the positive correlation between Candidatus and colonic CMKLR1 observed in the blank group was lost following DR induction, but was restored by QMG intervention, which was accompanied by a negative correlation with serum IL-1β and TNF-α, while positively correlated with retinal PPAR-γ, AP-1, TP53, colonic AP-1, and serum IL-6 (P < 0.01). Proteobacteria in the model group negatively correlated with colonic CMKLR1 (P < 0.01), a trend that persisted following QMG intervention. Meanwhile, Firmicutes were positively correlated with retinal CMKLR1 in the model group, whereas Bacteroidetes and Tenericutes were negatively correlated with retinal CMKLR1 (P < 0.01). Following QMG intervention, Bacteroidetes shifted to positive correlations with retinal PPAR-γ, AP-1, TP53, and colonic CMKLR1 (P < 0.01). Additionally, Actinobacteria positively correlated with retinal CMKLR1 and Wnt5a (P < 0.01).
At the class level (Figure 10G–I), QMG improved the CMKLR1-centered network mainly by regulating Cytophagia and Bacteroidia along the gut-retina axis. Specifically, Cytophagia and Chitinophagia negatively correlated with retinal CMKLR1 in the blank group (P < 0.01). In the model group, Cytophagia, Bacteroidia, and Mollicutes negatively correlated with retinal CMKLR1, while colonic CMKLR1 positively correlated with Flavobacteriia and Epsilonproteobacteria, yet negatively with Tissierellia, Alphaproteobacteria, Clostridia, and Bacilli (P < 0.01). Following QMG intervention, Bacteroidia and Cytophagia positively correlated with colonic CMKLR1, retinal PPAR-γ, AP-1, TP53, colonic AP-1 and serum IL-6, whereas Mollicutes, Deltaproteobacteria, Alphaproteobacteria, and Gammaproteobacteria showed the opposite pattern (P < 0.01). Moreover, Chlamydiia, Actinobacteria, Tissierellia, Bacilli, and Negativicute negatively correlated with retinal CMKLR1 and Wnt5a, while Coriobacteriia exhibited the reverse correlation (P < 0.01).
At the order level (Figure 10J–L), QMG improved the CMKLR1-centered network mainly by modulating Bacteroidales, Bacillales, and Clostridiales along the gut–retina axis. Specifically, Cytophagales and Chitinophagales negatively correlated with retinal CMKLR1, whereas Marinilabiliales positively correlated with colonic CMKLR1 in the blank group (P < 0.01). In the model group, Mycoplasmatales, Cytophagales, Bacteroidales, and Marinilabiliales negatively correlated with retinal CMKLR1, while colonic CMKLR1 positively correlated with Flavobacteriales and Campylobacterales, yet negatively with Tissierellales, Bacillales, Sphingomonadales, Clostridiales, and Lactobacillales (P < 0.01). Following QMG intervention, Bacteroidales and Clostridiales positively correlated with colonic CMKLR1, AP-1, retinal PPAR-γ, AP-1, TP53, and serum IL-6, whereas Desulfovibrionales, Rhizobiales, Sphingomonadales, and Enterobacterales showed the opposite pattern (P < 0.01). Moreover, Eggerthellales and Coriobacteriales positively correlated with retinal CMKLR1 and Wnt5a, yet negatively with colonic TP53 and PPAR-γ, whereas Chlamydiales, Thermoanaerobacterales, Corynebacteriales, Tissierellales, and Bacillales exhibited the reverse correlation (P < 0.01).
Associations at Fine levels
At the family level (Figure 11A–C), QMG improved the CMKLR1-centered network primarily by modulating Lachnospiraceae, Bacteroidaceae, and Lactobacillaceae along the gut–retina axis. Specifically, Ruminococcaceae negatively correlated with retinal CMKLR1, whereas Lachnospiraceae positively correlated with retinal CMKLR1 in the blank group (P < 0.01). In the model group, Peptostreptococcaceae positively correlated with retinal CMKLR1, while Tannerellaceae, Bacteroidaceae, Odoribacteraceae, and Lachnospiraceae showed the opposite pattern (P < 0.01). Meanwhile, colonic CMKLR1 positively correlated with Marinilabiliaceae, Rikenellaceae, and Flavobacteriaceae, yet negatively with Lachnospiraceae and Lactobacillaceae (P < 0.01). Following QMG intervention, Enterobacteriaceae, Sphingomonadaceae, and Oscillospiraceae negatively correlated with colonic CMKLR1, AP-1, and serum IL-6, as well as retinal PPAR-γ, AP-1, and TP53, while positively correlating with serum IL-1β and TNF-α, whereas Peptococcaceae, Bacteroidaceae, Muribaculaceae, and Rikenellaceae showed the opposite pattern (P < 0.01). Moreover, Veillonellaceae, Peptostreptococcaceae, Lactobacillaceae, and Ruminococcaceae negatively correlated with retinal CMKLR1 and Wnt5a, yet positively with colonic TP53 and PPAR-γ, whereas Eggerthellaceae, Lachnospiraceae, and Hungateiclostridiaceae exhibited the reverse correlation (P < 0.01).
At the genus level (Figure 11D–F), QMG improved the CMKLR1-centered network primarily by modulating Lachnoclostridium, Clostridioides, and Bacteroides along the gut–retina axis. Specifically, Ruminococcus negatively correlated with retinal CMKLR1, whereas Lachnoclostridium showed the opposite pattern in the blank group (P < 0.01). In the model group, Lactobacillus and Sphingomonas negatively correlated with colonic CMKLR1, while Alistipes and Croceibacter positively correlated with colonic CMKLR1 (P < 0.01). Meanwhile, retinal CMKLR1 positively correlated with Paeniclostridium and Clostridioides, yet negatively with Mucinivorans, Intestinimonas, Flavonifractor, Parabacteroides, Bacteroides, Odoribacter, and Lachnoclostridium (P < 0.01). Following QMG intervention, Sphingomonas and Oscillibacter negatively correlated with colonic CMKLR1, AP-1, and serum IL-6, as well as retinal PPAR-γ, AP-1, and TP53, while positively correlating with serum IL-1β and TNF-α, whereas Bacteroides, Muribaculum, and Alistipes showed the opposite pattern (P < 0.01). Moreover, Dialister, Flavonifractor, Clostridioides, Ruminococcus, and Paeniclostridium negatively correlated with retinal CMKLR1 and Wnt5a, yet positively with colonic TP53 and PPAR-γ, whereas Pseudoclostridium, Lachnoclostridium, and Blautia exhibited the reverse correlation (P < 0.01).
At the species level (Figure 11G–I), QMG improved the CMKLR1-centered network primarily by modulating Clostridioides difficile, Alistipes shahii, and Paeniclostridium sordellii along the gut–retina axis. Specifically, Ruminococcus bicirculans and endosymbiont 'TC1' of Trimyema compressum negatively correlated with retinal CMKLR1, whereas Lactobacillus fermentum and Lactobacillus helveticus displayed the opposite pattern in the blank group (P < 0.01). In the model group, Croceibacter atlanticus, Alkalitalea saponilacus, Alistipes finegoldii, and Alistipes shahii positively correlated with colonic CMKLR1, while Sphingomonas panacis, Paeniclostridium sordellii, Clostridioides difficile, and Lactobacillus murinus positively correlated with retinal CMKLR1, yet Odoribacter splanchnicus, Mucinivorans hirudinis, Lachnoclostridium phocaense, Flavonifractor plautii, and Intestinimonas butyriciproducens showed the opposite pattern (P < 0.01). Following QMG intervention, Alistipes shahii and Muribaculum intestinale positively correlated with colonic CMKLR1, AP-1, and serum IL-6, as well as retinal PPAR-γ, AP-1, and TP53, while negatively correlating with serum IL-1β and TNF-α, whereas Sphingomonas panacis, Oscillibacter sp. PEA192, and Oscillibacter valericigenes exhibited the reverse pattern (P < 0.01). Moreover, Pseudoclostridium thermosuccinogenes, Lachnoclostridium phocaense, Bacteroides salanitronis, and Blautia sp. N6H1-15 positively correlated with retinal CMKLR1 and Wnt5a, yet negatively with colonic TP53 and PPAR-γ, whereas Paeniclostridium sordellii, Flavonifractor plautii, endosymbiont 'TC1' of Trimyema compressum, Clostridioides difficile, and Dialister pneumosintes showed the reverse correlation (P < 0.01). The detailed correlation results at kingdom, phylum, class, order, family, genus, and species levels are presented in Supplementary File 1.
DATA AVAILABILITY:
The 16S rDNA sequencing datasets generated and analyzed during the current study are available in the National Center for Biotechnology Information (NCBI) Sequence Read Archive (SRA) repository under the BioProject accession number: PRJNA1281561. All other data generated or analyzed during this study are included in this article.
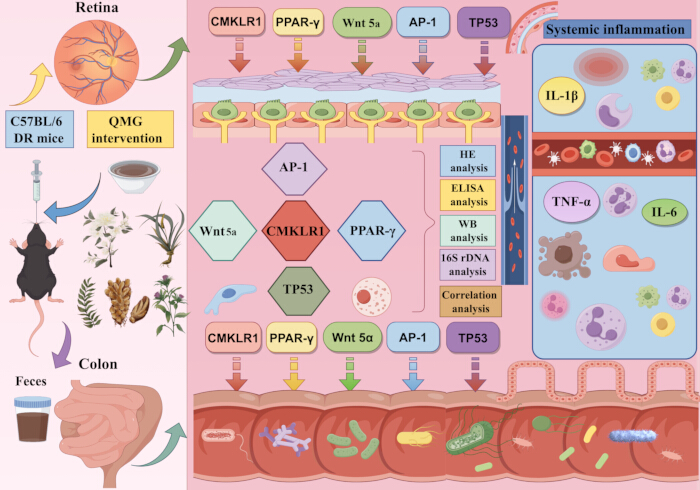
Figure 1: Graphical abstract. The graphical abstract shows the process of this study. Please click here to view a larger version of this figure.
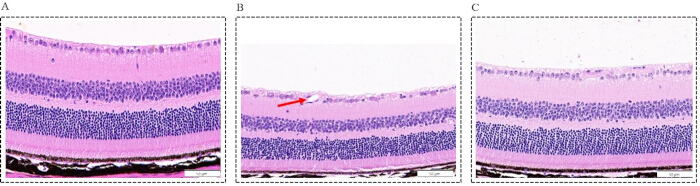
Figure 2: Morphological changes in the retina across the three groups (Scale bar = 50 µm, Magnification: ×400). (A) Blank group: representative photomicrographs of hematoxylin-eosin (HE)-stained retinal sections, showing an intact, well-organized retinal architecture with neatly arranged cellular layers; (B) Model group: representative photomicrographs of HE-stained retinal sections, showing marked structural disorganization, characterized by disordered cellular arrangement, a significant reduction in retinal ganglion cell (RGC) counts (P < 0.0001), pronounced thinning of the retinal thickness (P < 0.0001), and neovascular tufts penetrating the inner limiting membrane (indicated by a red arrow); (C) Intervention group: representative photomicrographs of HE-stained retinal sections, showing significant attenuation of histopathological abnormalities relative to the model group, as evidenced by restoration of retinal laminar architecture, partial recovery of RGC numbers (P < 0.001), and restoration of retinal thinning (P < 0.01). Please click here to view a larger version of this figure.
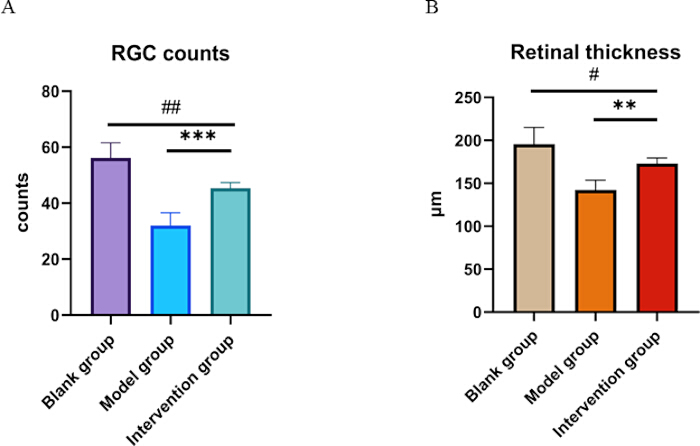
Figure 3: Histological quantification of RGC counts and retinal thickness. (A) Quantification of RGC counts in the ganglion cell layer. (B) Measurement of total retinal thickness (µm). Data are shown as mean ± SD (n = 6 per group). Compared with the blank group: #P <0.05, ##P <0.01; compared with the model group: **P <0.01, ***P <0.001. Please click here to view a larger version of this figure.
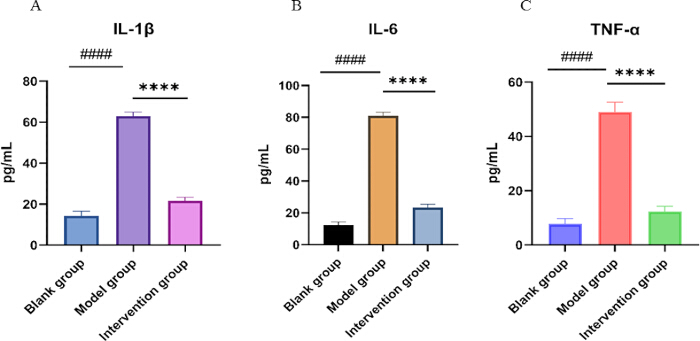
Figure 4: Serum concentrations of inflammatory cytokines in the three groups. Bar charts showing ELISA‑based quantification of serum IL‑1β (A), IL‑6 (B), and TNF‑α (C) levels in the blank control, model group, and intervention groups. Data are expressed as mean ± SD (n = 6 per group). Compared with the blank group: ####P < 0.0001; compared with the model group: ****P < 0.0001. Please click here to view a larger version of this figure.
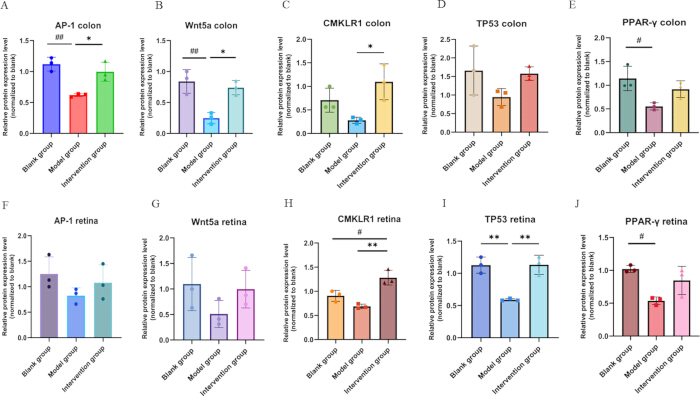
Figure 5: Bar chart of the expression levels of key regulatory proteins in the retina and colon. (A) Relative protein expression level (normalized to blank) of AP-1 in the colon (n = 3); (B) Relative protein expression level (normalized to blank) of Wnt5a in the colon (n = 3); (C) Relative protein expression level (normalized to blank) of CMKLR1 in the colon (n = 3); (D) Relative protein expression level (normalized to blank) of TP53 in the colon (n = 3); (E) Relative protein expression level (normalized to blank) of PPAR-γ in the colon (n = 3); (F) Relative protein expression level (normalized to blank) of AP-1 in the retina (n = 3); (G) Relative protein expression level (normalized to blank) of Wnt5a in the retina (n = 3); (H) Relative protein expression level (normalized to blank) of CMKLR1 in the retina (n = 3); (I) Relative protein expression level (normalized to blank) of TP53 in the retina (n = 3); (J) Relative protein expression level (normalized to blank) of PPAR-γ in the retina (n = 3). Compared with the blank group: #P < 0.05, ##P < 0.01; compared with the model group: *P < 0.05, **P < 0.01. Please click here to view a larger version of this figure.
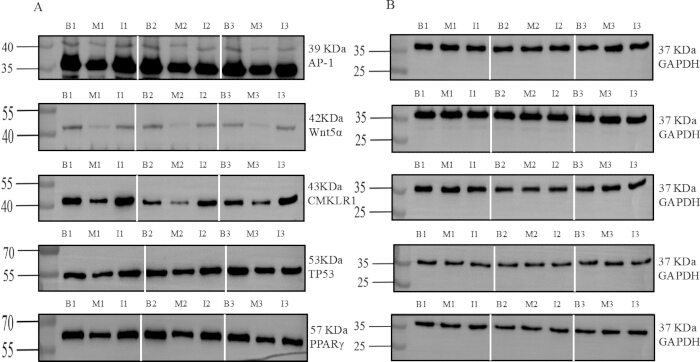
Figure 6: Representative WB grayscale blots of key regulatory proteins in the colon. (A) Target protein expression: AP-1, Wnt5a, CMKLR1, TP53, and PPAR-γ; (B) Loading control: GAPDH. Vertical white lines separate replicate sets (Rep1, Rep2, Rep3); Molecular weight markers (kDa) are indicated on the left, and protein names with corresponding kDa are shown on the right. Lanes are labeled as: B1 (Blank group 1), M1 (Model group 1), I1 (Intervention group 1); B2 (Blank group 2), M2 (Model group 2), I2 (Intervention group 2); B3 (Blank group 3), M3 (Model group 3), I3 (Intervention group 3). Full-length, uncropped Western blot (WB) images with visible molecular weight markers have been provided as Supplementary Figure 2. Please click here to view a larger version of this figure.
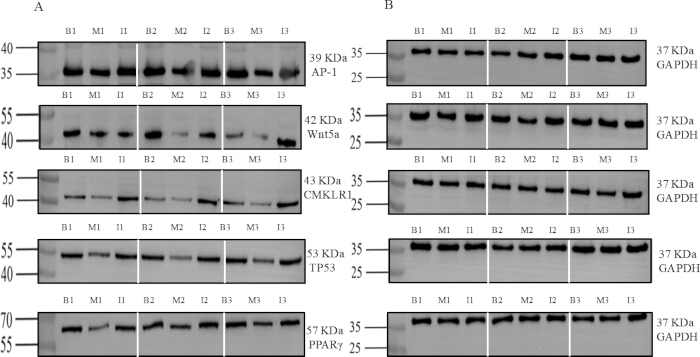
Figure 7: Representative WB grayscale blots of key regulatory proteins in the retina. (A) Target protein expression: AP-1, Wnt5a, CMKLR1, TP53, and PPAR-γ; (B) Loading control: GAPDH. Vertical white lines separate replicate sets (Rep1, Rep2, Rep3); Molecular weight markers (kDa) are indicated on the left, and protein names with corresponding kDa are shown on the right. Lanes are labeled as: B1 (Blank group 1), M1 (Model group 1), I1 (Intervention group 1); B2 (Blank group 2), M2 (Model group 2), I2 (Intervention group 2); B3 (Blank group 3), M3 (Model group 3), I3 (Intervention group 3). Full-length, uncropped WB images with visible molecular weight markers have been provided as Supplementary Figure 2. Please click here to view a larger version of this figure.
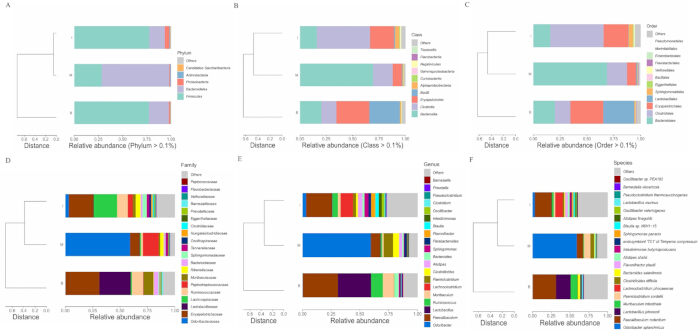
Figure 8: Hierarchical clustering of gut microbiota composition at different levels. Hierarchical clustering dendrogram based on Bray-Curtis dissimilarity among the blank control (B), model group(M), and intervention group (I). The branch length represents the degree of structural divergence. Stacked bar chart depicting the relative abundances of dominant phyla across the three groups. Phyla falling below the threshold are aggregated as “Others”. (A) Qiming granule (QMG) rebalances the gut microbiota composition at the phylum level; (B) QMG rebalances the gut microbiota composition at the class level; (C) QMG rebalances the gut microbiota composition at the order level; (D) QMG rebalances the gut microbiota composition at the family level; (E) QMG rebalances the gut microbiota composition at the genus level; (F) QMG rebalances the gut microbiota composition at the species level. Abbreviation: B, blank group; M, model group; I, intervention group. Please click here to view a larger version of this figure.
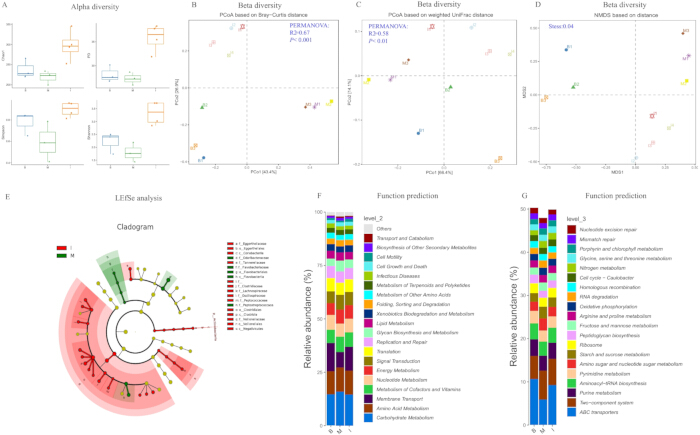
Figure 9: Analysis of gut microbiota diversity, differential abundance, and predicted functional pathways. (A) Alpha diversity analysis assessed by Chao1, PD, Simpson, and Shannon indices revealed that the intervention group exhibited higher microbial diversity than the model group, indicating that QMG treatment effectively restores gut microbial richness and evenness. (B) Beta diversity analysis assessed by principal coordinates analysis (PCoA) based on Bray-Curtis distance revealed significant differences among groups (PERMANOVA: R2=0.67, P < 0.001), indicating that the DR model and QMG intervention accounted for a substantial proportion of the variation in microbial community composition. (C) Beta diversity analysis assessed by PCoA based on weighted unique fraction (UniFrac) distance further confirmed the significant community shift (PERMANOVA: R2= 0.58, P < 0.01). (D) Beta diversity analysis assessed by non-metric multidimensional scaling (NMDS) ordination demonstrated a stress value of 0.04, suggesting that the QMG intervention significantly altered the global composition of the gut microbiota. (E) Cladogram of differential abundance analysis assessed by linear discriminant analysis effect size (LEfSe) revealed the primary differential microbiota between the model and intervention groups. Functional prediction of the gut microbiota at KEGG Level 2 (F) and KEGG Level 3 (G) suggested that the intervention not only reshaped the taxonomic composition and structure of the gut microbiota but also restored its functional metabolic capacity toward a homeostatic state. Please click here to view a larger version of this figure.
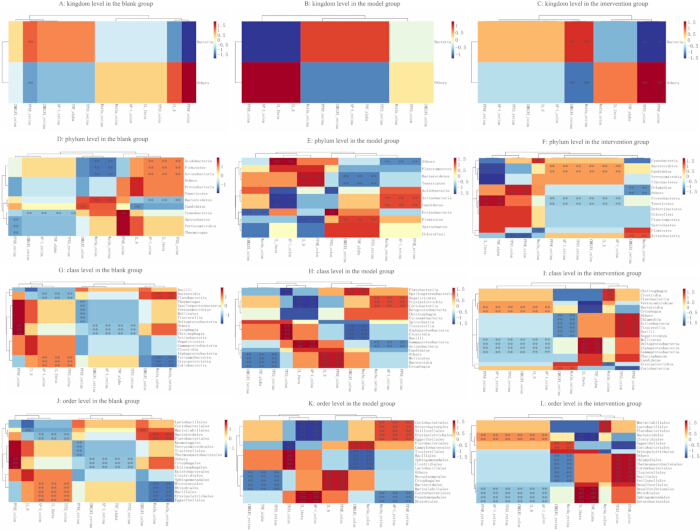
Figure 10: Global association of gut microbiota with inflammatory and regulatory factors. (A) Association of gut microbiota at kingdom level in the blank group; (B) Association of gut microbiota at kingdom level in the model group; (C) Association of gut microbiota at kingdom level in the intervention group; (D) Association of gut microbiota at phylum level in the blank group; (E) Association of gut microbiota at phylum level in the model group; (F) Association of gut microbiota at phylum level in the intervention group; (G) Association of gut microbiota at class level in the blank group; (H) Association of gut microbiota at class level in the model group; (I) Association of gut microbiota at class level in the intervention group; (J) Association of gut microbiota at order level in the blank group; (K) Association of gut microbiota at order level in the model group; (L) Association of gut microbiota at order level in the intervention group. Please click here to view a larger version of this figure.
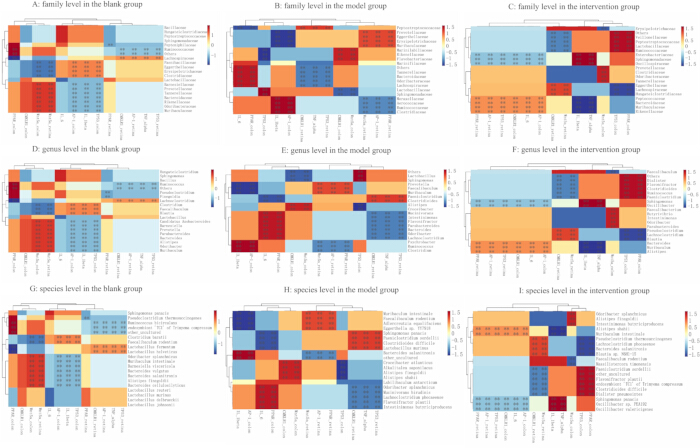
Figure 11: Fine association of gut microbiota with inflammatory and regulatory factors. (A) Association of gut microbiota at the family level in the blank group; (B) Association of gut microbiota at the family level in the model group. (C) Association of gut microbiota at family level in the intervention group; (D) Association of gut microbiota at genus level in the blank group; (E) Association of gut microbiota at genus level in the model group; (F) Association of gut microbiota at genus level in the intervention group; (G) Association of gut microbiota at species level in the blank group; (H) Association of gut microbiota at species level in the model group;(I) Association of gut microbiota at species level in the intervention group. Please click here to view a larger version of this figure.
| Groups (n = 6) | RGCs counts | Retinal thickness |
| Blank group | 56.17 ± 5.382 | 195.50 ± 19.54 μm |
| Model group | 32.00 ± 4.561#### | 142.30 ± 11.34 μm#### |
| Intervention group | 45.33 ± 2.066 ##*** | 173.00 ± 6.575 μm#** |
| p | <0.0001 | <0.0001 |
Table 2: Quantitative analysis of RGC counts and retinal thickness in the three experimental groups. Data are presented as Mean ± SD (n = 6 per group). Compared with the blank group: #P <0.05, ##P <0.01, ####P <0.0001; compared with the model group: **P <0.01, ***P <0.001.
| Groups (n = 6) | IL-1β | IL-6 | TNF-α |
| Blank group | 14.31 ± 2.28 | 12.48 ± 1.774 | 7.728 ± 2.048 |
| Model group | 62.88 ± 2.01#### | 80.95 ± 2.247#### | 49.00 ± 3.647#### |
| Intervention group | 21.7 ± 1.654**** | 23.27 ± 2.074**** | 12.35 ± 1.891**** |
| P | <0.0001 | <0.0001 | <0.0001 |
Table 3: Serum expression levels of IL-1β, IL-6, and TNF-α in the three experimental groups. Data are presented as Mean ± SD (n = 6 per group). Cytokine concentrations were determined by enzyme‑linked immunosorbent assay (ELISA) and are reported in pg/mL. Compared with the blank group: ####P < 0.0001; compared with the model group: ****P < 0.0001.
Supplementary Figure 1: Experimental Design and Study Timeline. Schematic overview of the experimental design.Please click here to download this file.
Supplementary Figure 2: Original, full-length, uncropped WB images corresponding to Figure 6 and Figure 7. Raw images without modification contain all molecular weight markers in colon and retina blots for AP-1, Wnt5a, TP53, CMKLR1, PPAR-γ, and loading control GAPDH. Molecular weight markers (kDa) are indicated. Lanes are labeled: B1 (Blank group 1), M1 (Model group 1), I1 (Intervention group 1); B2 (Blank group 2), M2(Model group 2), I2 (Intervention group 2); B3 (Blank group 3), M3 (Model group 3), I3 (Intervention group 3). The original blots were not subjected to high-contrast adjustments.Please click here to download this file.
Supplementary File 1: Detailed correlation analyses of gut microbiota with inflammatory and regulatory factors.Please click here to download this file.
Discussie
Diabetische retinopathie (DR) is een complexe neurovasculaire complicatie die wordt aangestuurd door chronische hyperglykemie, ontsteking en metabole ontregeling22. De American Academy of Ophthalmology categoriseert DR in non-proliferatieve DR en proliferatieve DR, gekenmerkt door het ontstaan van neovascularisatie23. Gezien de beperkingen van huidige therapeutische strategieën is het verkennen van nieuwe mechanismen een veelbelovende richting gebleken voor de aanpak van DR. Opvallend is dat recente doorbraken de darm-retina-as hebben geïdentificeerd als een kritiek, maar nog onderbenut, therapeutisch doelwit voor DR. De darm-retina-as, die voor het eerst werd geïntroduceerd en beschreven door Sheldon Rowan in 20176, heeft aan populariteit gewonnen in de pathofysiologische processen van oogziekten. De specifieke moleculaire mechanismen die ten grondslag liggen aan de rol van de darm-retina-as bij de pathogenese en progressie van DR blijven echter onduidelijk, wat de ontwikkeling en klinische toepassing van therapeutische strategieën die op deze as zijn gericht, belemmert.
In deze studie hebben we systematisch de werkzaamheid en de onderliggende mechanismen van QMG tegen DR geëvalueerd. Deze bevindingen leveren preliminaire bewijzen dat QMG retinale histopathologische schade verlicht, systemische inflammatie onderdrukt, de homeostase van het darmmicrobioom herstelt en belangrijke regulerende eiwitten (het CMKLR1-gecentreerde regulerende netwerk) in zowel het colon als het retina bidirectioneel moduleert, waardoor QMG wordt gepositioneerd als een potentiële modulator van de darm-retina-as. Chronische, laaggradige systemische inflammatie is een kenmerk van DM en een belangrijke drijver van retinale microvasculaire schade en de progressie van DR24. De ELISA-resultaten toonden aan dat de serumspiegels van IL-1β, IL-6 en TNF-α significant verhoogd waren bij DR-modelmuizen (P < 0,0001), wat de aanwezigheid van een robuuste systemische inflammatoire respons in de DR-toestand bevestigt. Ongecontroleerde afgifte van deze cytokines kan de bloed-retina-barrière verstoren, apoptose van RGC's bevorderen en pathologische neovascularisatie stimuleren. Na interventie met QMG waren de spiegels van deze cytokines significant verlaagd (P < 0,0001), terwijl de structurele integriteit van het retina werd hersteld, de overleving van RGC's toenam en de retinadikte behouden bleef. Deze resultaten geven aan dat de retinabeschermende effecten van QMG nauw verbonden zijn met de krachtige systemische anti-inflammatoire activiteit ervan. Opmerkelijk is dat dit systemische anti-inflammatoire effect niet geïsoleerd optreedt, maar gekoppeld is aan de door QMG gemedieerde modulatie van het darmmicrobioom en het herstel van belangrijke regulerende eiwitten in het colon, wat suggereert dat QMG zijn therapeutische effecten kan uitoefenen via een "darm-systemische inflammatie-retina"-as.
Om het moleculaire mechanisme verder te verduidelijken waarlangs QMG zijn anti-DR-effecten uitoefent via de darm-retina-as, werd de eiwitexpressie van het CMKLR1-gecentreerde regulatienetwerk (inclusief CMKLR1, Wnt5a, TP53, AP-1 en PPAR-γ) onderzocht in zowel colon- als retineweefsels. De resultaten toonden aan dat na inductie van het DR-model alle vijf de eiwitten een consistente dalende trend vertoonden in zowel de colon als de retina, wat suggereert dat de signaalcommunicatie tussen de darm en de retina systemisch geblokkeerd kan zijn onder DR-condities. Na interventie met QMG was CMKLR1 significant upgereguleerd in zowel de colon als de retina (P < 0,05 en P < 0,01), wat aangeeft dat QMG de bidirectionele communicatie langs de darm-retina-as kan herstellen via systemische activatie van CMKLR1. Bovendien herstelde QMG significant de expressie van AP-1 en Wnt5a in de colon, evenals de expressie van TP53 in de retina, wat suggereert dat verschillende eiwitten weefselspecifieke functionele rollen kunnen spelen langs de as: AP-1 en Wnt5a zijn gevoeliger responders op QMG in de colon, terwijl TP53, als apoptoseregulator, een kritiekere rol speelt bij retinal neuroprotectie. Verdere correlatieanalyse onthulde dat de colone expressie van AP-1, CMKLR1, PPAR-γ en Wnt5a significant negatief correleerde met systemische ontstekingscytokinespiegels (IL-1β, IL-6, TNF-α) (P < 0,05 tot P < 0,001), terwijl er geen directe correlatie werd waargenomen tussen serumcytokines en retinal eiwitexpressie. Dit verschil heeft belangrijke mechanistische implicaties: QMG kan primair werken op de darmmicro-omgeving door de expressie van sleutelregulatoreiwitten in de colon te herstellen, waardoor systemische ontsteking wordt onderdrukt; het herstel van retinal eiwitten kan daarentegen worden bereikt via indirecte paden, zoals de translocatie van door darmmicrobiota afgeleide metabolieten in de circulatie, die vervolgens op afstand retinal signaalcascades reguleren, in plaats van direct te worden gemedieerd door systemische ontstekingsfactoren. Deze bevinding ondersteunt een "darm-systemische ontsteking-retina" axiaal regulatiemodel en biedt cruciaal mechanistisch bewijs voor het therapeutische effect van QMG op DR via de darm-retina-as. Onder de onderzochte targets vertoonde CMKLR1 significante veranderingen in zowel retinal als colone weefsels, waardoor het naar voren komt als een potentiële primaire biomarker die de darm-retina-as verbindt. CMKLR1 is in eerdere studies betrokken gebleken bij glycolipidenmetabolisme, de ernst van DR en modulatie van de darmmicrobiota25,26,27,28,29,30, wat suggereert dat de differentiële expressie langs de darm-retina-as de betrokkenheid bij meerdere pathologische processen kan weerspiegelen. Deze bevindingen positioneren CMKLR1 als een veelbelovende kandidaat-biomarker voor DR-diagnostiek en therapeutische interventie, wat verdere mechanistische validatie rechtvaardigt.
Hoewel CMKLR1 fungeert als een centraal knooppunt in de darm-retina-as, wordt het therapeutische effect van QMG bereikt via een multidimensionaal reguleringsnetwerk waarin Wnt5a, TP53, AP-1 en PPAR-γ essentiële synergetische ondersteuning bieden. Wnt-signalering is cruciaal voor de homeostase van het darmepitheel en de gezondheid van het colon, inclusief de rollen bij de epitheliale integriteit, modulatie van inflammatie en microbiota-gemedieerde mucosale bescherming31,32,33,34. PPAR-γ reguleert inflammatoire responsen en is aangetoond in staat om lipide-geactiveerde fagocyten bij DR te remmen en het overleven van fotoreceptoren te bevorderen via microgliale modulatie35,36,37. AP-1 dient als transcriptiefactor waardoor microbiële darmmetabolieten, zoals deoxycholzuur, de inflammatoire en immuunhomeostase beïnvloeden38,39,40,41. TP53 is betrokken bij autofagie, apoptose en neuronale letsels in het netvlies onder hyperglykemische omstandigheden42,43,44,45. Gezamenlijk vormen deze signaleringsknooppunten een onderling verbonden netwerk dat de dynamiek van de darmmicrobiota koppelt aan retinapathologie, wat ons ertoe aanzette om te onderzoeken of QMG dit netwerk langs de darm-retina-as moduleert.
Een cruciaal mechanisme waarmee systemische inflammatie wordt gereguleerd, vindt zijn oorsprong in het ecosysteem van de darm. De 16S rDNA-sequencinganalyse onthulde een door diabetes gedreven structurele dysbiose in de modelgroep, gekenmerkt door een significante onbalans in de Firmicutes/Bacteroidetes-ratio, een verrijking van potentieel pathogene taxa (bijv. Odoribacter en Clostridioides) en een afname van gunstige taxa (bijv. Lactobacillus en Faecalibaculum). Opmerkelijk genoeg fungeerde de QMG-behandeling als een microbiota-herstelmiddel om deze pathologische veranderingen om te keren door: (i) het herstellen van de microbiële homeostase: het normaliseren van de proporties van sleutelfamilies en -geslachten (Faecalibaculum, Ruminococcus, Erysipelotrichaceae) richting de baseline van de blanco groep; (ii) gerichte modulatie van pathobionten: het downreguleren van de met diabetes geassocieerde overgroei van Odoribacter splanchnicus en Clostridioides difficile; (iii) het bevorderen van de assemblage van gunstige gemeenschappen: het induceren van de proliferatie van anti-inflammatoire of metaboliet-producerende taxa, zoals Lachnoclostridium, Blautia en Flavonifractor plautii. Bovendien gaven de diversiteitsanalyses en de Spearman-correlatieanalyse op meerdere niveaus aan dat de QMG-interventie de kerncompositie op meerdere niveaus effectief herbalanceert op een wijze die beschermende gastheer-microbe interacties langs de darm-retina-as bevordert. Dit resultaat bevestigt niet alleen het regulerende effect van QMG op de darmmicrobiota, maar onthult ook een potentiële therapeutische strategie waarbij QMG de remodellering van de microbiota coördineert met de activiteit van belangrijke regulatoire eiwitten (bijv. IL-6, TP53) om gezamenlijk systemische inflammatie te onderdrukken en daarmee diabetische retinopathie te verlichten.
Recente studies hebben bevestigd dat TCM een multi-target regulatie uitoefent op de microbiota-metabolisme-immunas, waardoor ze zich onderscheiden van farmaceutische middelen met een enkelvoudig target46. Toenemend bewijs heeft het therapeutische potentieel van QMG bij DR en aanverwante oogcondities aangetoond. Een multicenter gerandomiseerd gecontroleerd onderzoek toonde aan dat QMG de arterioveneuze circulatietijd van het netvlies bij DR-patiënten significant reduceerde, wat wijst op een verbeterde retinale bloedstroom en verminderde hypoxie47. Meta-analyses bevestigden verder dat QMG in combinatie met conventionele behandeling de centrale maculadikte, de visuele acuity en de algemene effectiviteitsgraad bij diabetisch macula-oedeem significant verbeterde48, en ook de traanfilm-break-up tijd verlengde en de traansecretie verhoogde bij patiënten met een droog oog syndroom49. Bij patiënten met NPDR-gerelateerd zenuwletsel bleek QMG niet-inferieur aan calciumdobesilaat in het behoud van de dikte van de retinale zenuwvezellaag en het oppervlak van de foveale avasculaire zone50. Mechanistische studies hebben onthuld dat QMG retinale schade beschermt via meerdere paden, waaronder inhibitie van Müller-cel pyroptose en immuuninflammatie via het P2X7R/NLRP3-pad51, activatie van het PI3K/Akt-signaleringspad om apoptose te verminderen, en modulatie van tight junction-eiwitten om de integriteit van de bloed-retinale barrière te behouden52. Netwerkfarmacologische analyses hebben meerdere bioactieve verbindingen in QMG geïdentificeerd die synergetisch werken op DR-gerelateerde targets16, en klinische studies hebben geen ernstige bijwerkingen gerapporteerd, wat duidt op een gunstig veiligheidsprofiel50. De therapeutische effectiviteit van QMG wordt toegeschreven aan de synergetische werking van de actieve componenten, waaronder quercetine, kaempferol, isorhamnetine, formononetine en β‑sitosterol, die collectief anti‑inflammatoire, antioxidatieve en anti‑apoptotische effecten uitoefenen door IL‑6, TNF‑α, TP53 en AP‑1 te targeten53,54,55,56,57,58,59. De huidige studie breidt deze kennis uit door aan te tonen dat de beschermende effecten van QMG ook worden gemedieerd via modulatie van de darm-retina-as, specifiek door het herstellen van de homeostase van de darmmicrobiota en het reguleren van het CMKLR1-gecentreerde moleculaire netwerk om systemische inflammatie te onderdrukken en retinale schade te verlichten.
Er moet worden opgemerkt dat deze studie enkele beperkingen heeft die verder onderzoek in toekomstige studies rechtvaardigen. Ten eerste moet de causale relatie tussen veranderingen in het darmmicrobioom en verbeteringen in de retina-functie verder worden gevalideerd. Hoewel sterke correlaties werden waargenomen tussen door QMG geïnduceerde remodellering van het microbiota en retina-beschermende fenotypen, zouden directe causale inferentie-experimenten, zoals fecale microbiotatransplantatie, kiemvrije diermodellen of antibiotica-geïnduceerde uitputting van het microbiota, waardevol zijn om deze relatie in toekomstige studies te bevestigen. Ten tweede werd 16S rDNA-sequencing gebruikt om de microbiële samenstelling te profileren, wat voldoende taxonomische resolutie biedt op genusniveau en hoger, maar een beperkt vermogen heeft om functionele informatie op stamniveau of het exacte metabole potentieel te leveren. Metagenomische sequencing of metabolomische analyses zullen in opvolgende studies worden uitgevoerd om de belangrijkste microbiële functionele routes te identificeren die door QMG worden gereguleerd. Ten derde werden microbiële veranderingen alleen beoordeeld aan het einde van het experiment, waardoor een dynamische monitoring van de temporele evolutie van de microbiota-reconstructie tijdens de QMG-interventie niet mogelijk was. Longitudinale bemonstering in toekomstige studies zal helpen bij het bepalen van de kinetiek van de door QMG gestuurde remodellering van het microbiota en de temporele relatie met retina-bescherming. Ten vierde, hoewel de histopathologische analyse retina-verdunning, verlies van RGC en neovasculaire poliepen waarnam, zouden toekomstige studies protocollen met meervoudige STZ-injecties en genetisch diabetische modellen moeten verkennen, evenals een meer uitgebreide karakterisering van het DR-fenotype moeten bieden.
Samenvattend demonstreert deze studie dat QMG diabetische retinopathie (DR) verbetert door het CMKLR1-gecentreerde moleculaire netwerk te koppelen aan systemische ontsteking via de darm-retina-as. Het werkingsmechanisme van QMG manifesteert zich op drie niveaus: op microbiële niveau keert QMG diabetes-geïnduceerde dysbiose in de darmen om (bijv. door de Firmicutes/Bacteroidetes-ratio te herstellen, Odoribacter en Clostridioides te onderdrukken en gunstige bacteriën zoals Faecalibaculum te bevorderen); op moleculair niveau reguleert QMG het CMKLR1/Wnt5a/PPAR-γ/AP-1/TP53-pad en verlicht het systemische ontsteking; op weefselniveau beschermt QMG de retina-morfologie. Deze bevindingen ondersteunen QMG als een veelbelovende therapeutische darm-retina-strategie voor DR en bieden een mechanistische basis voor de toepassing van traditionele Chinese geneeskunde (TCM) bij de behandeling van diabetische complicaties.
Openbaarmakingen
De auteurs verklaren dat zij geen bekende concurrerende financiële belangen of persoonlijke relaties hebben die een invloed zouden kunnen hebben gehad op het in dit artikel beschreven werk.
Dankbetuigingen
De auteur wil graag alle teamleden erkennen die veel steun en hulp hebben geboden om dit onderzoek te voltooien.
Dit onderzoek werd ondersteund door de National Natural Science Foundation of China (Grant Number:82474580) en het Hospital Foundation Free Exploration Project in het Hospital of Chengdu University of Traditional Chinese Medicine (No. 23ZYTS1601).
Materialen
| Naam | Bedrijf | Catalogusnummer | Opmerkingen |
|---|---|---|---|
| AP-1 monoklonaal antilichaam | Proteintech | 66313-1-IG | 1:5000 |
| CMKLR1 polyklonaal antilichaam | Affinity | AF5291 | 1:1000 |
| GAPDH polyklonaal antilichaam | Affinity | AF7021 | 1:5000 |
| Geit Anti-Muis IgG(H+L) HRP | MULTI SCIENCES | GAM0072 | 1:10000 |
| Geit Anti-Konijn IgG(H+L) HRP | MULTI SCIENCES | GAR0072 | 1:10000 |
| GraphPad Prism | / | versie 9.5 | |
| Image-Pro Plus | Media Cybernetics, Inc., Rockville, MD, USA | versie 6.0 | |
| Luoning Bio-Cloud platform | http://www.biomediv.cn/login.html | ||
| Muis IL-1β(Interleukine 1 Beta) ELISA Kit | Elabscience | E-EL-M0037 | Detectie van serumcytokinen |
| Muis IL-6(Interleukine-6) ELISA Kit | Elabscience | E-EL-M0044 | Detectie van serumcytokinen |
| Muis TNF-α(Tumor Necrosis Factor Alpha) ELISA Kit | Elabscience | E-EL-M3063 | Detectie van serumcytokinen |
| NanoFilt | / | versie 2.7.1 | |
| Nanopore GridION sequencer | Oxford Nanopore Technologies | https://store.nanoporetech.com/gridion.html | |
| Pannoramic SCAN II | 3DHISTECH Pannoramic SCAN scanner | https://www.3dhistech.com/scanners/pannoramic-scan-ii-digital-scanner/ | |
| PPAR gamma (PPAR-γ) polyklonaal antilichaam | ImmunoWay | bs-0530R | 1:1000 |
| Python | / | versie 3.7.4 | |
| Qiming Granule | Zhejiang Sansheng Mandi Pharmaceutical Co., Ltd. | Chinese National Drug Approval No. Z20090036 | 0,9 g/kg, orale gavage |
| R programmeertaal | / | versie 4.0.3 | |
| SILVA database | / | versie 138 | |
| Streptozotocine (STZ) | Sigma-Aldrich | S0130 | 35 mg/kg, i.p. |
| TP53 polyklonaal antilichaam | Abcam | ab131442 | 1:1000 |
| Usearch | / | versie 10.0.240 | |
| Wnt5a polyklonaal antilichaam | Proteintech | 55184-1-AP | 1:1000 |
| Zymo Research BIOMICS DNA Microprep Kit | Zymo Research | D4301 | Extractie van fecaal gDNA |
Referenties
- Lei C, et al. Homocysteine and diabetic retinopathy. Exp Eye Res. 2026;262:110729.
- Owens DR, et al. IDF diabetes Atlas: A worldwide review of studies utilizing retinal photography to screen for diabetic retinopathy from 2017 to 2024 inclusive. Diabetes Res Clin Pract. 2025;226:112346.
- Zhu J, Huang J, Sun Y, Xu W, Qian H. Emerging role of extracellular vesicles in diabetic retinopathy. Theranostics. 2024;14(4):1631–1646.
- Xie L, Lin W. The role of gut microbiota dysbiosis in the inflammatory pathogenesis of diabetic retinopathy. Front Immunol. 2025;16:1604315.
- Niu J, Liu Y, Peng H, Chen J, Chen L. Early-stage diabetic retinopathy: gut-metabolic triggers, immune-neurodegeneration, and interventions. Graefes Arch Clin Exp Ophthalmol. 2025;263(10):2723–2736.
- Rowan S, et al. Involvement of a gut-retina axis in protection against dietary glycemia-induced age-related macular degeneration. Proc Natl Acad Sci U S A. 2017;114(22):E4472–E4481.
- Rzeczycki P, Pęciak O, Plust M, Droździk M. Gut Microbiota in the Regulation of Intestinal Drug Transporters: Molecular Mechanisms and Pharmacokinetic Implications. Int J Mol Sci. 2025;26(24):11897.
- Yang H, et al. Mediating role of aging and obesity in the relationship between dietary index for gut microbiota and metabolic syndrome and its potential regulatory mechanisms. Eur J Med Res. 2025;31(1):137.
- Zahavi EE, et al. Repeat-element RNAs integrate a neuronal growth circuit. Cell. 2025;188(16):4350–4365.e22.
- Dander E, et al. The chemerin/CMKLR1 axis regulates intestinal graft-versus-host disease. JCI Insight. 2023;8(5):e154440.
- Zhang J, et al. Therapeutic targets in the Wnt signaling pathway: Treating cancer with specificity. Biochem Pharmacol. 2025;236:116848.
- Liu M, Lim ST, Song W, Coffman TM, Wang X. Beyond lipids: fenofibrate in diabetic retinopathy and nephropathy. Trends Pharmacol Sci. 2026;47(3):325–341.
- Wu Y, et al. The active ingredient β-sitosterol in the anti-inflammatory agents alleviates perianal inflammation in rats by inhibiting the expression of Srebf2, activating the PPAR signaling pathway, and altering the composition of gut microbiota. Int Immunopharmacol. 2025;152:114470.
- Lin T, Chen C, Zhao LC, Zhu HY, Li W. The beneficial effects of Traditional Chinese Medicine on diabetic retinopathy: mechanisms, therapeutics, and prospects. Acupunct Herb Med 2026;6(2):188–204.
- Huo J, et al. Evaluation of individualized treatment of nonproliferative diabetic retinopathy: a multicenter, randomized, parallel-controlled study. J Tradit Chin Med. 2022;42(1):90–95.
- Huang Y, et al. Pharmacological mechanism and clinical study of Qiming granules in treating diabetic retinopathy based on network pharmacology and literature review. J Ethnopharmacol. 2023;302(Pt A):115861.
- Salma B, et al. Ameliorative Efficacy of the Cassia auriculata Root Against High-Fat-Diet + STZ-Induced Type-2 Diabetes in C57BL/6 Mice. ACS Omega. 2020;6(1):492–504.
- Srinivasan K, Viswanad B, Asrat L, Kaul CL, Ramarao P. Combination of high-fat diet-fed and low-dose streptozotocin-treated rat: a model for type 2 diabetes and pharmacological screening. Pharmacol Res. 2005;52(4):313–320.
- Liu Y, Deng J, Fan D. Ginsenoside Rk3 ameliorates high-fat-diet/streptozocin-induced type 2 diabetes mellitus in mice via the AMPK/Akt signaling pathway. Food Funct. 2019;10(5):2538–2551.
- Hu RY, et al. AFG Ameliorates Diabetic Retinopathy through AMPK-Dependent Autolysosomal Pathway: From Network Pharmacology to In Vivo and In Vitro Validation. J Agric Food Chem. 2026;74(2):2124–2139.
- Reagan-Shaw S, Nihal M, Ahmad N. Dose translation from animal to human studies revisited. FASEB J. 2008;22(3):659–661.
- Zou Q, et al. Oxidative stress in diabetic retinopathy. Clin Chim Acta. 2026;584:120871.
- Clements JN, Mesawich J, Twisdale C. Current and Emerging Pharmacologic Therapies for Diabetic Retinopathy. Pharmacotherapy. 2026;46(3):e70119.
- Rezvani Z, Khani F, Afarid M, Asadian F, Takhshid MA. Clinical values of systemic inflammatory indices in diabetic retinopathy. Clin Exp Optom. 2026;109(3):371–385.
- Zhu Z, et al. Targeting the CMKLR1-Mediated Signaling Rebalances Immunometabolism State in Middle-Age Testicular Macrophages. Adv Sci (Weinh). 2026;13(14):e15166.
- Lin Y, et al. Epithelial chemerin-CMKLR1 signaling restricts microbiota-driven colonic neutrophilia and tumorigenesis by up-regulating lactoperoxidase. Proc Natl Acad Sci U S A. 2022;119(29):e2205574119.
- Puthanmadhom Narayanan S, et al. Epigenetic Alterations Are Associated With Gastric Emptying Disturbances in Diabetes Mellitus. Clin Transl Gastroenterol. 2020;11(3):e00136.
- Wang L, et al. Chemerin/CMKLR1 Axis Promotes the Progression of Proliferative Diabetic Retinopathy. Int J Endocrinol. 2021;2021:4468625.
- Zheng C, et al. α-NETA down-regulates CMKLR1 mRNA expression in ileum and prevents body weight gains collaborating with ERK inhibitor PD98059 in turn to alleviate hepatic steatosis in HFD-induced obese mice but no impact on ileal mucosal integrity and steatohepatitis progression. BMC Endocr Disord. 2023;23(1):9.
- Dranse HJ, et al. The impact of chemerin or chemokine-like receptor 1 loss on the mouse gut microbiome. PeerJ. 2018;6:e5494.
- Flores-Hernández E, et al. Canonical and non-canonical Wnt signaling are simultaneously activated by Wnts in colon cancer cells. Cell Signal. 2020;72:109636.
- Qi Y, et al. Heat-inactivated Bifidobacterium adolescentis ameliorates colon senescence through Paneth-like-cell-mediated stem cell activation. Nat Commun. 2023;14(1):6121.
- Ou W, et al. Cooperation of Wnt/β-catenin and Dll1-mediated Notch pathway in Lgr5-positive intestinal stem cells regulates the mucosal injury and repair in DSS-induced colitis mice model. Gastroenterol Rep (Oxf). 2024;12:goae090.
- Dong Y, et al. Berberine ameliorates DSS-induced intestinal mucosal barrier dysfunction through microbiota-dependence and Wnt/β-catenin pathway. Int J Biol Sci. 2022;18(4):1381–1397.
- Escandon P, et al. The role of peroxisome proliferator-activated receptors in healthy and diseased eyes. Exp Eye Res. 2021;208:108617.
- Blot G, et al. Perilipin 2-positive mononuclear phagocytes accumulate in the diabetic retina and promote PPARγ-dependent vasodegeneration. J Clin Invest. 2023;133(19):e161348.
- Zhou W, et al. TREM2-dependent activation of microglial cell protects photoreceptor cell during retinal degeneration via PPARγ and CD36. Cell Death Dis. 2024;15(8):623.
- Bala Kumar S, et al. Gut microbial metabolites targeting JUN in renal cell carcinoma via IL-17 signaling pathway: network pharmacology approach. Mol Divers. 2026;30(1):613–632.
- Wang L, et al. Gut microbial bile acid metabolite skews macrophage polarization and contributes to high-fat diet-induced colonic inflammation. Gut Microbes. 2020;12(1):1–20.
- Hagan T, et al. Antibiotics-Driven Gut Microbiome Perturbation Alters Immunity to Vaccines in Humans. Cell. 2019;178(6):1313–1328.e13.
- Meng Y, et al. Jinlida ameliorates diabetic kidney disease via gut microbiota-dependent production of pyridoxamine targeting renal AGEs/RAGE and TGF-β pathways. Phytomedicine. 2026;150:157744.
- Zhou H, Zhang L, Ding C, Zhou Y, Li Y. Upregulation of HMOX1 associated with M2 macrophage infiltration and ferroptosis in proliferative diabetic retinopathy. Int Immunopharmacol. 2024;134:112231.
- Mohammad HMF, et al. Neuroprotective effect of levetiracetam in mouse diabetic retinopathy: Effect on glucose transporter-1 and GAP43 expression. Life Sci. 2019;232:116588.
- Peng H, et al. Autophagy and senescence of rat retinal precursor cells under high glucose. Front Endocrinol (Lausanne). 2023;13:1047642.
- Ding Y, Chen L, Xu J, Feng Y, Liu Q. APAF1 Silencing Ameliorates Diabetic Retinopathy by Suppressing Inflammation, Oxidative Stress, and Caspase-3/GSDME-Dependent Pyroptosis. Diabetes Metab Syndr Obes. 2024;17:1635–1649.
- Yang T, et al. Clinical study on the modulating effects of Jiaotaiwan on the modulating effects of microbiota–SCFAs–neurotransmitter/immune axis in patients with depression. Acupunct Herb Med 2025;5(4):456–468.
- Luo XX, et al. Effect of qiming granule on retinal blood circulation of diabetic retinopathy: a multicenter clinical trial. Chin J Integr Med. 2009;15(5):384–388.
- Hu Z, et al. Add-on effect of Qiming granule, a Chinese patent medicine, in treating diabetic macular edema: A systematic review and meta-analysis. Phytother Res. 2021;35(2):587–602.
- Yang M, et al. The Efficacy and Safety of Qiming Granule for Dry Eye Disease: A Systematic Review and Meta-Analysis. Front Pharmacol. 2020;11:580.
- Ma XF, et al. Efficacy and Safety of Qiming Granule for Nerve Injury Associated with Non-proliferative Diabetic Retinopathy: A Multicenter, Randomized, Non-inferiority, Active-Controlled Clinical Trial. Chin J Integr Med. 2026;32(3):195–203.
- Zhou Q, et al. Qiming granules regulate Müller cell pyroptosis and the P2X7R/NLRP3 immune inflammatory pathway in diabetic retinopathy. Chin Med. 2026;21(1):89.
- Zhou L, Qin T, Lv Y, Wu Z. Qiming Granules Ameliorate Diabetic Retinopathy by Regulating the PI3K/Akt Signaling Pathway. J Ocul Pharmacol Ther. 2026;42(3):202–212.
- Li HD, Li MX, Zhang WH, Zhang SW, Gong YB. Effectiveness and safety of traditional Chinese medicine for diabetic retinopathy: A systematic review and network meta-analysis of randomized clinical trials. World J Diabetes. 2023;14(9):1422–1449.
- Chen F, et al. Isorhamnetin promotes functional recovery in rats with spinal cord injury by abating oxidative stress and modulating M2 macrophages/microglia polarization. Eur J Pharmacol. 2021;895:173878.
- Naudhani M, Thakur K, Ni ZJ, Zhang JG, Wei ZJ. Formononetin reshapes the gut microbiota, prevents progression of obesity and improves host metabolism. Food Funct. 2021;12(24):12303–12324.
- Qu Y, et al. Kaempferol Alleviates Murine Experimental Colitis by Restoring Gut Microbiota and Inhibiting the LPS-TLR4-NF-κB Axis. Front Immunol. 2021;12:679897.
- Saikia L, et al. Therapeutic Potential of Quercetin in Diabetic Neuropathy and Retinopathy: Exploring Molecular Mechanisms. Curr Top Med Chem. 2024;24(27):2351–2361.
- Yao H, et al. Kaempferol Protects Blood Vessels From Damage Induced by Oxidative Stress and Inflammation in Association With the Nrf2/HO-1 Signaling Pathway. Front Pharmacol. 2020;11:1118.
- Zhang HX, Li YY, Liu ZJ, Wang JF. Quercetin effectively improves LPS-induced intestinal inflammation, pyroptosis, and disruption of the barrier function through the TLR4/NF-κB/NLRP3 signaling pathway in vivo and in vitro. Food Nutr Res. 2022;66:10.