This study presents a reproducible framework for developing and evaluating an LLM-driven virtual companion for older adults at risk of social isolation. A randomized trial of 160 participants demonstrated good usability and favorable changes in depressive symptoms and loneliness, supporting the use of AI-assisted psychosocial support in care settings.
Onderzoeksartikel
A Methodological Framework for a Large Language Model Virtual Companion for Older Adults at Risk of Social Isolation
In dit artikel
Samenvatting
Samenvatting
Social isolation is consistently associated with depressive symptoms, loneliness, reduced quality of life, and limited social connectedness in older adults; however, standardized approaches are lacking for developing and evaluating artificial intelligence–based psychosocial interventions. Here, we report an integrated methodology for developing and evaluating a large language model (LLM)-driven virtual companion system that delivers personalized emotional support to older adults at risk of social isolation. The methodology includes: participant recruitment and eligibility screening, system deployment, personalized conversational configuration, emotion-aware interaction, intervention implementation, longitudinal outcome assessment, and statistical evaluation. As a proof-of-concept demonstration of the framework, we conducted a randomized controlled trial involving 160 older adults recruited from community settings and long-term care institutions. Older adults were randomly allocated into one of two groups: the intervention group received an 8-week LLM-driven virtual companion intervention, while the control group participated in routine social activities. We evaluated outcomes at baseline, Week 4, Week 8, and Week 12 using the Geriatric Depression Scale (GDS-15), UCLA Loneliness Scale (UCLA-LS), the World Health Organization Quality of Life–Old Module (WHOQOL-OLD), Lubben Social Network Scale-6 (LSNS-6), and System Usability Scale (SUS). Representative findings showed good system usability (SUS = 78.6 ± 10.3) and favorable changes in depressive symptoms and loneliness, indicating the feasibility and practicality of the proposed methodological framework. The standardized workflow provides a reproducible protocol for the further development and evaluation of LLM-based digital mental health interventions for older adults in both community and long-term care settings.
Inleiding
As the global aging population grows rapidly, social isolation and its associations with depressive symptoms, loneliness, and reduced psychosocial well-being have become significant public health concerns for older adults1,2. Social isolation is consistently associated with higher risks of depressive symptoms, anxiety, cognitive decline, and all-cause mortality2,3,4. Group-based social activities, telephone outreach programs, and traditional social robots have shown some benefits; however, they are resource-intensive, not scalable, and not adaptable to individual emotional needs. The rigid interaction pattern of conventional digital interventions also hinders the establishment of long-term emotional engagement, leading to varied intervention outcomes5,6.
Recent advances in generative artificial intelligence, particularly large language models (LLMs), have created new opportunities for developing intelligent psychosocial interventions7,8,9. Owing to their capabilities in open-domain dialogue, contextual understanding, emotion-aware interaction, and personalized response generation, LLMs have the potential to provide more natural, adaptive, and continuous emotional support than conventional rule-based systems10,11,12. These characteristics make LLM-driven virtual companions particularly promising for addressing the long-term psychosocial needs of socially isolated older adults while improving accessibility and scalability in both community and institutional care settings13,14,15.
Although many advances have been made so far, most existing studies evaluate only the clinical effectiveness of LLM-based interventions, while standard methods for their design, implementation, and evaluation are poorly described. The lack of reproducible development workflows, intervention protocols, and multidimensional evaluation strategies hinders methodological transparency, reproducibility, and wider implementation across various care settings. In response, we propose herein an integrated methodology for developing and evaluating an LLM-driven virtual companion system for older adults who are at risk of social isolation that includes: (1) participant recruitment; (2) personalized system configuration; (3) emotion-aware conversational interaction; (4) intervention implementation; (5) longitudinal outcome assessment; and (6) statistical evaluation as part of a standardized workflow. We conducted a randomized controlled trial to demonstrate the feasibility and practical application of our framework. Our protocol serves as a reproducible methodology reference for the future development and evaluation of LLM-based digital mental health interventions in community and long-term care settings.
Protocol
The study was approved by the Institutional Review Board of China University of Geosciences Beijing (approval no. CUGB-IRB-2024-0127).
Study framework
This protocol presents a standardized methodological framework for the development and evaluation of a large language model (LLM)-driven virtual companion system designed to provide personalized psychosocial support for older adults at risk of social isolation. Rather than focusing solely on intervention outcomes, the framework emphasizes a reproducible workflow that integrates system development, participant recruitment, intervention implementation, outcome evaluation, and quality control into a unified protocol. The randomized controlled trial described in this study serves as a representative example demonstrating the feasibility and practical implementation of the proposed methodology.
The overall framework consists of five interconnected components: (1) Participant recruitment and eligibility screening; (2) Development and configuration of the LLM-driven virtual companion system; (3) Standardized intervention implementation and monitoring; (4) Multidimensional outcome evaluation; and (5) Data management and statistical analysis. These components aim to ensure methodological consistency, reproducibility, and adaptability among different community and long-term care settings. Collectively, they constitute a practical protocol for developing, implementing, and evaluating artificial intelligence (AI)-assisted virtual companion systems, which can serve as a methodological reference for future digital mental health interventions targeted toward socially isolated older adults. The overall architecture of the LLM-driven virtual companion system is illustrated in Figure 1.
Participant recruitment and eligibility screening
To standardize participant recruitment and eligibility screening across all study sites, we recruited older adults from community health service centers and long-term care institutions through posters, staff referrals, and community outreach. Participants had to be aged 60 years or older and at risk of social isolation, as indicated by a Lubben Social Network Scale-6 (LSNS-6) score <12 (indicating limited social networks). In addition, they needed to be able to speak Chinese, have normal or corrected vision, and have hearing adequate for interacting with our virtual companion system; they were also required to provide written informed consent. Those who met any of the following exclusion criteria: severe cognitive impairment, major psychiatric disorders, unstable medical condition, or prior experience with AI-based conversational systems were excluded to minimize potential confounders.
After eligibility assessment, participants provided written informed consent before enrolling in this study. Demographic and clinical data were obtained using standardized case report forms. Finally, eligible participants were randomized to either an intervention or a control group using computer-generated randomization to ensure equal allocation before implementing the study protocol.
Development of the LLM-driven virtual companion system
The LLM-driven virtual companion system was developed to provide personalized, continuous, and emotionally supportive interactions for older adults at risk of social isolation. The system integrates a large language model (GPT-4, OpenAI; accessed via application programming interface [API]) with a user-friendly conversational interface, enabling both text- and voice-based communication to accommodate varying levels of digital literacy. Voice interaction was supported by a commercial automatic speech recognition (ASR) module (Google Cloud Speech-to-Text, version 2.12.0; language model: cmn-Hans-CN) and a neural text-to-speech (TTS) module (Google Cloud Text-to-Speech, version 1.8.0; voice: cmn-CN-Wavenet-A). The ASR and TTS modules were integrated with the LLM engine through RESTful APIs. During system configuration, each participant created an individual profile that included demographic information, communication preferences, and personalized interaction settings, enabling the virtual companion to deliver context-aware and adaptive responses throughout the intervention period. The system employed a retrieval-augmented generation (RAG) architecture with a session-level memory buffer to maintain conversational continuity and personalize responses based on prior interactions.
To enhance emotional engagement, the system was designed to recognize users' emotional expressions from conversational context using a fine-tuned RoBERTa-based emotion classifier (accuracy = 0.86 on a held-out validation set) and generate empathetic responses using predefined prompting strategies and dialogue management rules. The prompts followed a structured template that incorporated participant profiles, conversation histories, and emotion labels. Daily interactions were guided by structured conversation themes, including emotional support, health-related discussions, reminiscence, leisure activities, and social encouragement, while remaining sufficiently flexible to accommodate spontaneous user-initiated conversations. All interaction records were securely stored for subsequent assessment of intervention adherence and system performance. Prior to implementation, the system underwent functional testing to verify interface stability, response consistency, and operational reliability. Testing included 50 scripted dialogue scenarios covering the five conversation themes, 20 voice-input trials under varied background noise conditions, and 10 repeated sessions to assess response consistency. Acceptance criteria were defined as ≥95% successful session completion, ≥90% appropriate emotion-response matching, and no critical interface failures across three consecutive test runs. All criteria were met before standardized deployment across study sites.
Intervention workflow
The intervention workflow was standardized to ensure consistent implementation across all study sites while allowing individualized interactions with the LLM-driven virtual companion system. After being randomized, those in the intervention group participated in an orientation session (face-to-face) led by trained research staff who explained how to use the system interface, its basic operations, and interaction guidelines. Participants also had a short hands-on practice session to familiarize them with initiating and maintaining conversation with their virtual companion prior to beginning the formal intervention.
Participants were encouraged during the intervention to interact with the virtual companion every day, using either text- or voice-based communication as they preferred. The system would prompt conversations regularly to encourage emotional expression, social engagement, health-related discussions, reminiscence, and enjoyment of daily activities; however, participants could start conversations whenever desired. Dynamic responses were provided based on the conversational context to ensure coherent, empathetic, and personalized interaction throughout the intervention.
All interactions (frequency, duration, and dialogue) were logged to monitor participant engagement and operational performance. Scheduled follow-ups by research staff addressed technical problems, encouraged participant continuation, and ensured data completeness without affecting conversational content. All interaction data at the end of the intervention period were securely archived, along with clinical outcome assessments, to evaluate the methodological framework and system performance. Interaction logs were encrypted (AES-256) and stored on a password-protected institutional server with access restricted to authorized research personnel. Audio recordings were transcribed and then deleted within 7 days; only de-identified transcripts were retained for analysis.
Implementation of control and intervention conditions
Standardized protocols were developed for implementing the intervention and control groups. Participants in the intervention group had access to the LLM-driven virtual companion system for 8 weeks; they were encouraged to engage in regular conversations (text or voice) while continuing their normal daily routines. Throughout the study, technical support was available to address any operational issues that did not affect participant behavior or the content of conversations.
The control group participants continued receiving routine social activities and traditional health services offered at their respective community centers or long-term care institutions. Access to the virtual companion system was not given during the intervention period. Apart from access to the intervention, the two groups followed the same schedule for participant management, follow-up assessment, and outcome data collection. Personnel coordinating participants underwent standard training to implement study procedures consistently across all sites and reduce procedural bias throughout the intervention period.
Outcome evaluation framework
A multidimensional evaluation framework was established to comprehensively assess the feasibility, usability, and potential effectiveness of the LLM-driven virtual companion system. Outcome assessments were conducted at baseline, Week 4, Week 8, and Week 12 by trained assessors using standardized evaluation procedures.
(1) Emotional health assessment: Depressive symptoms were evaluated using the 15-item Geriatric Depression Scale (GDS-15), while loneliness was assessed using the UCLA Loneliness Scale (UCLA-LS)16. These instruments served as the primary measures for monitoring changes in emotional well-being throughout the intervention. GDS-15 scores were interpreted as follows: 0–4 = normal; 5–7 = mild depressive symptoms; 8–11 = moderate depressive symptoms; and ≥12 = severe depressive symptoms. Given that the intervention group's baseline mean was 7.8, results should be interpreted as changes in subclinical depressive symptoms.
(2) Social functioning and quality of life assessment: The Lubben Social Network Scale-6 (LSNS-6) was used to evaluate participants' social connectedness and risk of social isolation. Quality of life was assessed using the World Health Organization Quality of Life–Old Module (WHOQOL-OLD)17, which provides complementary information regarding psychosocial functioning and overall well-being.
(3) System usability assessment: Participants in the intervention group completed the System Usability Scale (SUS)18 following completion of the intervention to evaluate system usability and learnability. SUS was not designed to measure acceptance; therefore, the results are interpreted only as usability outcomes.
(4) Assessment quality assurance: All assessments were administered by trained research personnel following standardized operating procedures. Uniform assessment schedules, data collection forms, and scoring criteria were adopted to ensure measurement consistency and facilitate reproducibility across different study sites.
(5) Post-intervention user experience questionnaire: A study-specific questionnaire was administered at T2 to collect qualitative feedback on user experience. The questionnaire included open-ended items on perceived benefits, ease of use, and technical difficulties. Responses were transcribed verbatim and categorized using thematic content analysis by two independent researchers.
Data management and quality control
Standardized data management and quality control processes ensured data integrity, protected participants' confidentiality, and maintained consistency in methods throughout this study. Clinical assessments and generated interaction data were documented on standardized case report forms and securely stored in a password-protected database accessible to authorized research personnel. Data were backed up weekly to an encrypted institutional server, and access logs were maintained. Participant identifiers have been substituted with unique study codes prior to any data analysis to protect their personal privacy. The completeness and accuracy of collected data were routinely monitored and double-checked against source documents. Missing or inconsistent records were reviewed and corrected in accordance with predefined quality control procedures. Standardized training was provided to research staff prior to initiating the study; uniform operating procedures were followed for managing participants, collecting data, and conducting follow-up assessments to reduce procedural variation and ensure reproducibility across all study sites.
Statistical analysis
Statistical analyses were performed according to a predefined analysis plan using standard statistical software. Continuous variables were summarized as mean ± standard deviation (SD), whereas categorical variables were presented as frequencies and percentages. Baseline characteristics were compared to assess group comparability before the implementation of the intervention. The final analyses were conducted using complete cases and included 148 participants who completed the study. Longitudinal changes in outcome measures were analyzed using linear mixed-effects models with group, time, and group-by-time interaction as fixed effects, and participant as a random effect. Simple-effects analyses were conducted to compare between-group differences at each time point. Quadratic trends were examined by including a quadratic term in the time variable. Effect sizes were calculated where appropriate to facilitate the interpretation of intervention-related changes. All statistical tests were two-tailed, and a p-value of < 0.05 was considered statistically significant. Analyses were performed using R version 4.3.1 (R Foundation for Statistical Computing) with the lme4 and emmeans packages. Prior to analysis, data quality was verified through routine consistency checks. The statistical analysis procedure was standardized to ensure the reproducibility, transparency, and comparability of the methodological framework across different implementation settings.
Resultaten
Participant flow and baseline characteristics
Representative implementation of the proposed methodological framework resulted in the recruitment of 206 older adults from community settings and long-term care institutions (Figure 2). Following eligibility screening, 160 participants met the inclusion criteria and were randomly assigned to either the intervention group (n = 80) or the control group (n = 80). During the intervention period, seven participants in the intervention group withdrew from the study, including four who were lost to follow-up, two who experienced difficulties adapting to the technology, and one who withdrew because of personal health issues. In the control group, five participants withdrew, including three who were lost to follow-up and two who voluntarily discontinued participation. The overall attrition rate was 7.5%. Consequently, a total of 148 participants completed the study and were included in the final analysis, comprising 73 participants in the intervention group and 75 participants in the control group. Baseline demographic and clinical characteristics of the two groups are presented in Table 1. No statistically significant differences were observed between the intervention and control groups with respect to age, sex, educational attainment, living alone status, Mini-Mental State Examination (MMSE) scores, or baseline scores on the GDS-15, UCLA-LS, WHOQOL-OLD, and LSNS-6 (p > 0.05 for all comparisons), indicating that baseline characteristics were comparable between groups.
Representative clinical outcomes
Changes in geriatric depression scale (GDS-15) scores
Representative analyses performed using the proposed evaluation framework demonstrated a significant group × time interaction effect (F = 8.34, p < 0.001) (Table 2 and Figure 3), indicating that the trajectories of GDS-15 scores differed significantly between the two groups over time. In the intervention group, the mean GDS-15 score decreased progressively from 7.8 ± 2.3 at baseline (T0) to 4.2 ± 1.9 at the end of the intervention (T2), then to 3.9 ± 1.8 at follow-up (T3). In contrast, the control group exhibited only a slight decrease from 7.6 ± 2.5 at baseline to 6.9 ± 2.4 at T2, followed by a modest increase to 7.1 ± 2.3 at T3. These representative findings demonstrate the proposed framework's ability to capture longitudinal changes in depressive symptoms. GDS-15 scores should be interpreted as subclinical depressive symptoms, given the baseline mean of 7.8.
Changes in UCLA loneliness scale (UCLA-LS) scores
Representative assessment of loneliness demonstrated a pattern similar to that observed for depressive symptoms. Mixed-effects model analysis demonstrated a significant group × time interaction effect (F = 7.96, p < 0.001) (Table 3 and Figure 4). In the intervention group, the mean UCLA-LS score decreased from 52.3 ± 8.1 at baseline to 38.6 ± 7.2 at the end of the intervention and remained stable at 37.9 ± 7.0 during the follow-up period. In contrast, the control group showed only minor fluctuations across assessment time points, with scores changing from 51.8 ± 7.9 at baseline to 49.2 ± 8.0 at follow-up. Between-group comparisons revealed that the intervention group exhibited significantly lower UCLA-LS scores than the control group beginning at T1 (p = 0.002). The between-group differences became more pronounced at T2 and T3 (p < 0.001 for both comparisons). Detailed data for each assessment time point are presented in Table 3 and Figure 4.
Representative effect size estimation
To quantify the effectiveness of the virtual companion system, Cohen’s d effect sizes were calculated for both within-group changes relative to baseline and between-group differences at each assessment time point. As shown in Table 4 and Figure 5, the intervention group demonstrated large within-group effect sizes at both T2 and T3. For GDS-15 scores, the within-group effect sizes were 1.67 (95% CI: 1.30–2.04) and 1.70 (95% CI: 1.33–2.07), respectively. For UCLA-LS scores, the corresponding effect sizes were 1.69 (95% CI: 1.32–2.06) and 1.78 (95% CI: 1.40–2.16), respectively. All values exceeded the threshold for a large effect (d > 0.8). The between-group effect sizes at T2 were also substantial, reaching 1.21 for GDS-15 and 1.43 for UCLA-LS, supporting the sensitivity of the proposed evaluation framework for quantifying intervention-related changes.
Additional evaluation outcomes
Changes in quality of life (WHOQOL-OLD) scores
Mixed-effects model analysis revealed a significant group × time interaction effect (F = 6.52, p < 0.001) (Table 5 and Figure 6). The mean WHOQOL-OLD score in the intervention group increased steadily from 52.6 ± 7.4 at baseline to 68.3 ± 6.9 at the end of the intervention (T2), then to 69.1 ± 7.0 at follow-up (T3). In contrast, the control group showed minimal changes over time, with scores increasing only slightly from 53.1 ± 7.2 at baseline to 54.5 ± 7.4 at follow-up. Between-group comparisons indicated that WHOQOL-OLD scores in the intervention group were significantly higher than those in the control group beginning at T1 (p = 0.008), with more pronounced differences observed at T2 and T3 (p < 0.001 for both comparisons). Among the six WHOQOL-OLD domains, the greatest improvements were observed in social participation (mean change from baseline to T2: +18.4 ± 6.2 in the intervention group vs. +1.1 ± 5.8 in the control group) and autonomy (mean change: +16.7 ± 5.9 vs. +0.9 ± 5.4), as presented in Table 5. These representative improvements demonstrate the proposed framework's ability to capture multidimensional psychosocial outcomes.
Changes in social network scores (LSNS-6)
Analysis of LSNS-6 scores demonstrated a significant group × time interaction effect (F = 4.87, p = 0.003) (Table 6 and Figure 7). The intervention group exhibited a marked increase in LSNS-6 scores, rising from 8.2 ± 2.1 at baseline to 12.4 ± 2.3 at T2 and remaining relatively stable at 12.1 ± 2.4 at T3. By comparison, the control group showed only modest changes, with scores increasing from 8.4 ± 2.0 at baseline to 9.0 ± 2.2 at follow-up. Between-group comparisons indicated that LSNS-6 scores were significantly higher in the intervention group than in the control group at both T2 and T3 (p < 0.001 for both comparisons). Notably, the mean LSNS-6 score in the intervention group exceeded the social isolation risk threshold of 12 points at both T2 and T3. At the individual level, the proportion of participants with LSNS-6 scores ≥12 increased from 0% at baseline to 54.8% (40/73) at T2 and 52.1% (38/73) at T3 in the intervention group, compared with 0% (0/75) at baseline, 1.3% (1/75) at T1 and T2, and 4.0% (3/75) at T3 in the control group. These findings demonstrate that the proposed evaluation framework effectively detected changes in social connectedness at both group and individual levels.
System usability and user experience
System usability was evaluated within the methodological framework using the System Usability Scale (SUS). As shown in Table 7, the mean SUS score was 78.6 ± 10.3, with scores ranging from 54 to 95. This value was significantly higher than the established usability benchmark of 68 (one-sample t-test, p < 0.001). According to standard SUS interpretation criteria, scores ≥68 indicate above-average usability, whereas scores ≥78 generally indicate good usability. Item-level analysis revealed that the highest mean scores were obtained for the statements “I think that I would like to use this system frequently” (Item 1; 4.2 ± 0.7) and “I found the system easy to use” (Item 3; 4.3 ± 0.6). In addition, subjective feedback was collected through a post-intervention questionnaire. Representative positive comments included: “It felt like having an additional friend to talk to,” “Talking every day improved my mood considerably,” and “The system was easy to operate, and the voice was pleasant to listen to.” A small proportion of participants (9/73 completers, 12.3%; 9/80 randomized, 11.3%) reported issues related to speech recognition accuracy or unstable internet connectivity. These findings support the feasibility and practical applicability of the proposed implementation workflow.
Longitudinal performance of the proposed framework
Trajectories of changes across the four assessment time points
The trajectories of the core outcome measures across the four assessment time points (baseline [T0], Week 4 [T1], Week 8 [T2], and Week 12 [T3]) revealed distinct patterns between the two groups. For GDS-15 scores, participants in the intervention group exhibited a continuous downward trend throughout the study period. The rate of decline was relatively modest between T0 and T1, became most pronounced between T1 and T2, and subsequently plateaued between T2 and T3. In contrast, GDS-15 scores in the control group remained relatively stable across all assessment time points, with no substantial changes observed. A similar pattern was observed for UCLA-LS scores. The intervention group showed a nearly linear reduction from T0 to T2, followed by stabilization after T2, whereas the control group showed only minor fluctuations. Regarding WHOQOL-OLD scores, the intervention group showed a sustained increase over time, with the greatest improvement occurring between T1 and T2. By comparison, the control group exhibited only slight fluctuations throughout the study period. Notably, LSNS-6 scores in the intervention group increased rapidly between T0 and T2, exceeding the social isolation risk threshold of 12 points at T2. These gains were maintained above the threshold at T3. In contrast, changes in LSNS-6 scores in the control group were minimal. These representative trajectories illustrate the proposed framework's ability to continuously monitor longitudinal changes throughout the intervention and follow-up periods.
Time x group interaction effects
The mixed-effects model further confirmed significant time x group interactions for GDS-15, UCLA-LS, WHOQOL-OLD, and LSNS-6 (Table 8). For the primary outcomes, a significant time × group interaction was observed for GDS-15 scores (F = 8.34, p < 0.001), indicating that the intervention group experienced progressively greater improvements in depressive symptoms over time relative to the control group. Similarly, UCLA-LS scores demonstrated a significant interaction effect (F = 7.96, p < 0.001). Among the secondary outcomes, significant time × group interactions were also observed for WHOQOL-OLD (F = 6.52, p < 0.001) and LSNS-6 (F = 4.87, p = 0.003). To further quantify intervention effects at different stages, simple-effects analyses were conducted (Table 8). The results indicated that between-group differences had already emerged by the mid-intervention assessment (T1 vs. T0), although the magnitude of these differences remained relatively modest (p < 0.05 for all outcomes). The largest between-group differences were observed at the end of the intervention (T2 vs. T0) and during follow-up (T3 vs. T0), with all comparisons reaching statistical significance (p < 0.001). These findings indicate that the between-group differences became most pronounced after 8 weeks and remained evident at the 4-week follow-up. However, because cumulative exposure was not directly modeled, this pattern should be interpreted as progressive improvement over time rather than a confirmed cumulative dose–response effect. Furthermore, when time was modeled as a continuous variable to examine linear and quadratic trends, quadratic models provided a significantly better fit for changes in GDS-15 and UCLA-LS scores within the intervention group. The quadratic coefficients were -0.38 (SE = 0.11, p < 0.001) for GDS-15 and -0.92 (SE = 0.24, p < 0.001) for UCLA-LS. These analyses further demonstrate the robustness and applicability of the proposed methodological framework for evaluating longitudinal intervention effects in older adults at risk of social isolation.
Data Availability:
The datasets analyzed during the current study are available from the corresponding author upon reasonable request.
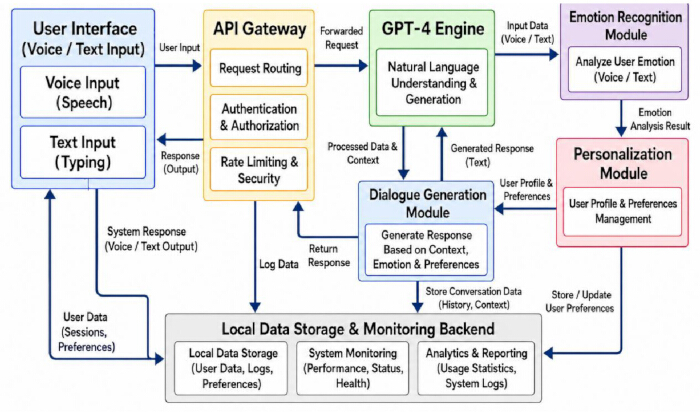
Figure 1: Research framework of the large language model–driven virtual companion system. Please click here to view a larger version of this figure.
This diagram illustrates the system architecture, including the LLM-based conversational engine (GPT-4 API), the emotion recognition module, the personalized configuration module, and the voice/text interaction interfaces. The system enables naturalistic, empathic dialogues with older adults to support emotional well-being amid social isolation.
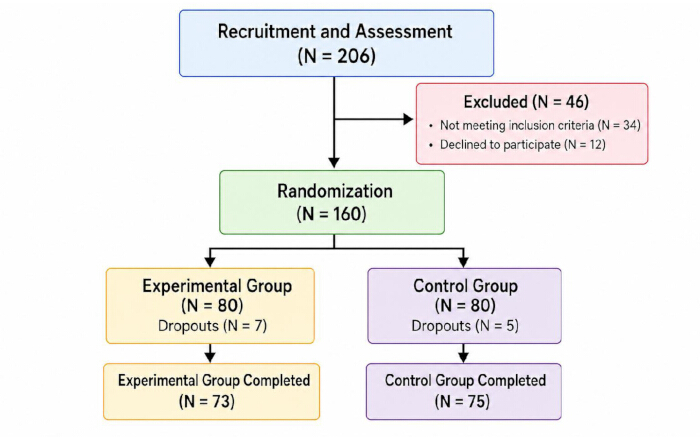
Figure 2: Participant flow diagram (CONSORT). This flowchart shows the screening, enrollment, random allocation, and follow-up of the 160 participants. Attrition rates are presented for both the intervention group (n = 80) and control group (n = 80); reasons for withdrawal are reported in the Results text. The final analytical sample comprised 148 participants. Please click here to view a larger version of this figure.
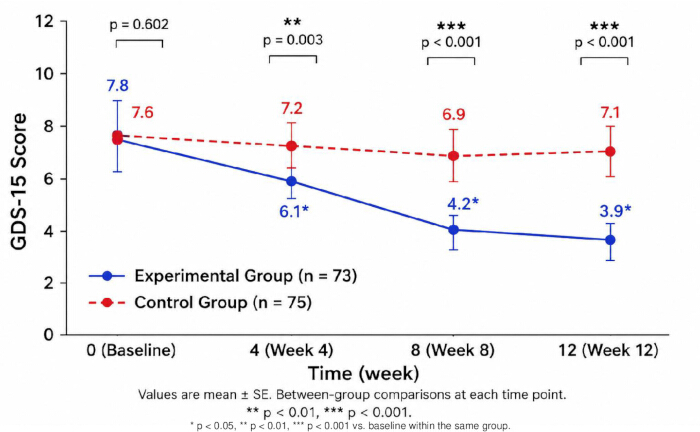
Figure 3: Changes in GDS-15 scores across four time points. This line graph displays the trajectory of depressive symptoms (GDS-15) from baseline (T0) to follow-up (T3) for both groups. The intervention group showed a progressive decline, whereas the control group remained stable. Error bars represent standard errors of the mean. Please click here to view a larger version of this figure.
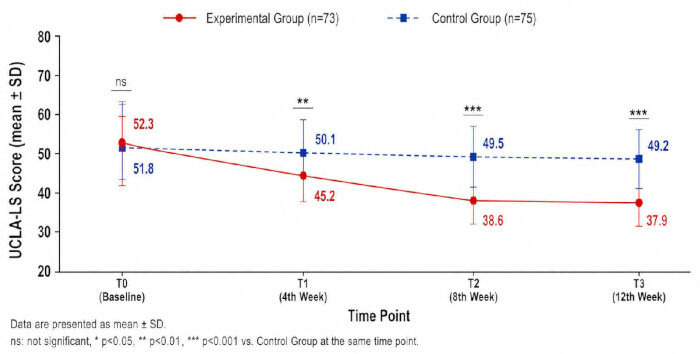
Figure 4: Changes in UCLA-LS scores across four time points. This figure illustrates the loneliness trajectory (UCLA-LS) over 12 weeks. The intervention group demonstrated a nearly linear reduction from T0 to T2 followed by stabilization, while the control group showed only minor fluctuations. Error bars represent standard deviations. Please click here to view a larger version of this figure.
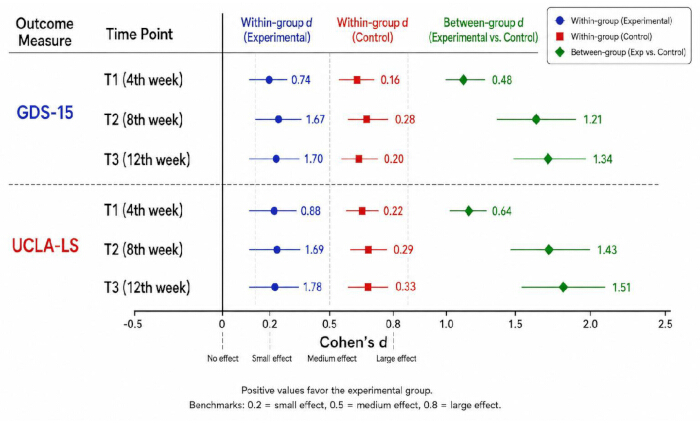
Figure 5: Cohen’s d effect sizes for primary outcomes at each time point. This forest plot displays within-group (relative to baseline) and between-group effect sizes for GDS-15 and UCLA-LS at T1, T2, and T3. Large effects (d > 1.2) were observed at both T2 and T3, indicating substantial changes in the intervention group. Please click here to view a larger version of this figure.
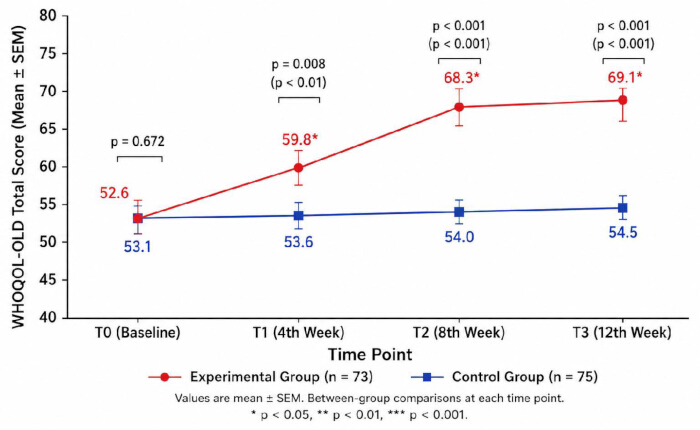
Figure 6: Changes in WHOQOL-OLD scores across four time points. This line graph presents quality-of-life trajectories over 12 weeks. The intervention group showed sustained improvement, with the greatest increase between T1 and T2, whereas the control group exhibited only minimal fluctuations. Error bars represent standard errors of the mean. Please click here to view a larger version of this figure.
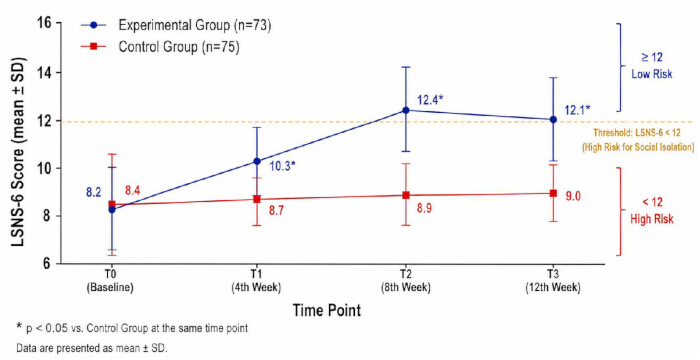
Figure 7: Changes in LSNS-6 scores across four time points. This figure illustrates changes in the social network over 12 weeks. The intervention group exceeded the social isolation risk threshold (score = 12) at T2 and maintained this level at T3. The horizontal dashed line indicates the risk cutoff. Error bars show standard deviations. The proportion of participants with LSNS-6 ≥12 was 0% at T0, 24.7% at T1, 54.8% at T2, and 52.1% at T3 in the intervention group, compared with 0%, 1.3%, 1.3%, and 4.0% in the control group. * = p < 0.05 vs. control Group at same time point. Please click here to view a larger version of this figure.
| Characteristic | Experimental group (n = 73) | Control group (n = 75) | p-value |
| Age (years, mean ± SD) | 71.4 ± 6.2 | 70.9 ± 5.8 | 0.612 |
| Female (n, %) | 48 (65.8%) | 50 (66.7%) | 0.907 |
| Education ≥ high school (n, %) | 31 (42.5%) | 33 (44.0%) | 0.851 |
| Living alone (n, %) | 35 (47.9%) | 37 (49.3%) | 0.865 |
| MMSE (mean ± SD) | 24.6 ± 2.1 | 24.9 ± 2.0 | 0.372 |
| GDS-15 (mean ± SD) | 7.8 ± 2.3 | 7.6 ± 2.5 | 0.602 |
| UCLA-LS (mean ± SD) | 52.3 ± 8.1 | 51.8 ± 7.9 | 0.71 |
| WHOQOL-OLD (mean ± SD) | 52.6 ± 7.4 | 53.1 ± 7.2 | 0.672 |
| LSNS-6 (mean ± SD) | 8.2 ± 2.1 | 8.4 ± 2.0 | 0.546 |
| Note: Data are presented as mean ± SD or n (%). Abbreviations: MMSE = Mini-Mental State Examination; GDS-15 = Geriatric Depression Scale; UCLA-LS = UCLA Loneliness Scale; WHOQOL-OLD = World Health Organization Quality of Life questionnaire for older adults; LSNS-6 = Lubben Social Network Scale. p-values are from independent-samples t-tests or chi-square tests. | |||
Table 1: Baseline demographic and clinical characteristics of participants. This table compares intervention (n = 73) and control (n = 75) groups at baseline on age, sex, education, living alone, MMSE scores, and all outcome measures. No significant differences were observed (p > 0.05 for all comparisons), indicating comparable baseline characteristics between groups.
| Time point | Experimental group (n = 73) | Control group (n = 75) | Group difference (95% Cl) | p-value |
| T0 (baseline) | 7.8 ± 2.3 | 7.6 ± 2.5 | 0.2 (-0.6, 1.0) | 0.602 |
| T1 (4th week) | 6.1 ± 2.1* | 7.2 ± 2.4 | -1.1 (-1.8, -0.4) | 0.003 |
| T2 (8th week) | 4.2 ± 1.9* | 6.9 ± 2.4 | -2.7 (-3.4, -2.0) | <0.001 |
| T3 (12th week) | 3.9 ± 1.8* | 7.1 ± 2.3 | -3.2 (-3.9, -2.5) | <0.001 |
| Note: Data are presented as mean ± SD. * = p < 0.05 compared with baseline within the same group (paired t-test). Abbreviations: CI = confidence interval. | ||||
Table 2: Mixed-effects model results for GDS-15 scores. This table reports mean GDS-15 scores at each time point, between-group differences with 95% confidence intervals, and p-values from mixed-effects models.
| Time point | Experimental group (n = 73) | Control group (n = 75) | Group difference | p-value |
| T0 (baseline) | 52.3 ± 8.1 | 51.8 ± 7.9 | 0.5 (-2.1, 3.1) | 0.71 |
| T1 (4th week) | 45.2 ± 7.8* | 50.1 ± 7.5 | -4.9 (-7.4, -2.4) | 0.002 |
| T2 (8th week) | 38.6 ± 7.2* | 49.5 ± 7.8 | -10.9 (-13.5, -8.3) | <0.001 |
| T3 (12th week) | 37.9 ± 7.0* | 49.2 ± 8.0 | -11.3 (-13.9, -8.7) | <0.001 |
| Note: Data are presented as mean ± SD. * = p < 0.05 compared with baseline within the same group (paired t-test). Abbreviations: CI = confidence interval. | ||||
Table 3: UCLA-LS scores at each time point and group comparisons. This table reports mean (± SD) loneliness scores at T0, T1, T2, and T3 for both groups. Between-group comparisons using mixed-effects models showed significantly lower loneliness in the intervention group beginning at T1 (p = 0.002), with larger differences at T2 and T3 (p < 0.001).
| Outcome measure | Time point | Within-group effect size (experimental) [95% CI] | Within-group effect size (control) [95% CI] | Between-group effect size [95% CI] |
| GDS-15 | T1 (4th week) | 0.74 [0.41, 1.07] | 0.16 [-0.16, 0.48] | 0.48 [0.15, 0.81] |
| T2 (8th week) | 1.67 [1.30, 2.04] | 0.28 [-0.04, 0.60] | 1.21 [0.86, 1.56] | |
| T3 (12th week) | 1.70 [1.33, 2.07] | 0.20 [-0.12, 0.52] | 1.34 [0.98, 1.70] | |
| UCLA-LS | T1 (4th week) | 0.88 [0.54, 1.22] | 0.22 [-0.10, 0.54] | 0.64 [0.30, 0.98] |
| T2 (8th week) | 1.69 [1.32, 2.06] | 0.29 [-0.03, 0.61] | 1.43 [1.07, 1.79] | |
| T3 (12th week) | 1.78 [1.40, 2.16] | 0.33 [0.01, 0.65] | 1.51 [1.14, 1.88] | |
| Note: Effect sizes are calculated as Cohen's d with 95% confidence intervals. Within-group effect size compares each time point to baseline (T0) within the same group. The between-group effect size compares the experimental group to the control group at the same time point. d = 0.2 (small), 0.5 (medium), 0.8 (large). | ||||
Table 4: Cohen’s d effect sizes for GDS-15 and UCLA-LS at each time point. This table quantifies within-group (relative to baseline) and between-group effect sizes. Large effects (Cohen's d > 1.2) were observed for both primary outcomes at T2 and T3, indicating substantial changes in the intervention group.
| Time point | Experimental group (n = 73) | Control group (n = 75) | Group difference (95% Cl) | p-value |
| WHOQOL-OLD total score | ||||
| T0 (baseline) | 52.6 ± 7.4 | 53.1 ± 7.2 | -0.5 (-2.9, 1.9) | 0.672 |
| T1 (4th week) | 59.8 ± 7.1* | 53.6 ± 7.0 | 6.2 (3.9, 8.5) | 0.008 |
| T2 (8th week) | 68.3 ± 6.9* | 54.0 ± 7.3 | 14.3 (11.9, 16.7) | <0.001 |
| T3 (12th week) | 69.1 ± 7.0* | 54.5 ± 7.4 | 14.6 (12.1, 17.1) | <0.001 |
| Social participation domain | ||||
| T0 (baseline) | 51.2 ± 8.3 | 52.0 ± 8.1 | -0.8 (-3.4, 1.8) | 0.548 |
| T1 (4th week) | 58.6 ± 7.9* | 52.4 ± 8.0 | 6.2 (3.7, 8.7) | 0.009 |
| T2 (8th week) | 69.6 ± 7.2* | 53.1 ± 8.2 | 16.5 (13.9, 19.1) | <0.001 |
| T3 (12th week) | 70.2 ± 7.4* | 53.5 ± 8.3 | 16.7 (14.0, 19.4) | <0.001 |
| Autonomy domain | ||||
| T0 (baseline) | 50.8 ± 7.9 | 51.5 ± 7.7 | -0.7 (-3.2, 1.8) | 0.582 |
| T1 (4th week) | 57.9 ± 7.5* | 52.1 ± 7.6 | 5.8 (3.4, 8.2) | 0.011 |
| T2 (8th week) | 67.5 ± 7.1* | 52.4 ± 7.8 | 15.1 (12.6, 17.6) | <0.001 |
| T3 (12th week) | 68.3 ± 7.3* | 52.9 ± 7.9 | 15.4 (12.8, 18.0) | <0.001 |
| Note: Data are presented as mean ± SD. *= p < 0.05 compared with baseline within the same group (paired t-test). CI = confidence interval. WHOQOL-OLD scores range from 0 to 100, with higher scores indicating better quality of life. Domain scores are presented for the two domains with the greatest improvements. | ||||
Table 5: WHOQOL-OLD scores at each time point and group comparisons. This table displays the mean (± SD) quality-of-life scores across four time points. The intervention group showed significantly higher scores than the control group from T1 onward (p = 0.008 at T1; p < 0.001 at T2 and T3), with the largest changes in social participation and autonomy domains (domain-level results presented in Table 5).
| Time point | Experimental group (n = 73) | Control group (n = 75) | Group difference (95% Cl) | p-value |
| T0 (baseline) | 8.2 ± 2.1 | 8.4 ± 2.0 | -0.2 (-0.9, 0.5) | 0.546 |
| T1 (4th week) | 10.3 ± 2.2* | 8.7 ± 2.1 | 1.6 (0.9, 2.3) | 0.014 |
| T2 (8th week) | 12.4 ± 2.3* | 8.9 ± 2.2 | 3.5 (2.7, 4.3) | <0.001 |
| T3 (12th week) | 12.1 ± 2.4* | 9.0 ± 2.2 | 3.1 (2.3, 3.9) | <0.001 |
| Participants with LSNS-6 ≥12, n (%) | ||||
| T0 | 0 (0%) | 0 (0%) | — | — |
| T1 | 18 (24.7%) | 1 (1.3%) | — | <0.001 |
| T2 | 40 (54.8%) | 1 (1.3%) | — | <0.001 |
| T3 | 38 (52.1%) | 3 (4.0%) | — | <0.001 |
| Note: Data are presented as mean ± SD or n (%). LSNS-6 = Lubben Social Network Scale (6-item version), scores range from 0 to 30, with scores < 12 indicating risk of social isolation. * = p < 0.05 compared with baseline within the same group (paired t-test). CI = confidence interval. | ||||
Table 6: LSNS-6 scores at each time point and group comparisons. This table presents mean (± SD) social network scores over time. The intervention group exceeded the social isolation risk threshold (score = 12) at T2 and T3, with significantly higher scores than the control group (p < 0.001 for both comparisons). Individual-level proportions with LSNS-6 ≥12 are presented in Table 6.
| SUS item | Mean ± SD |
| 1. I would like to use this system frequently | 4.2 ± 0.7 |
| 2. I found the system unnecessarily complex (R) | 3.9 ± 0.8 |
| 3. I thought the system was easy to use | 4.3 ± 0.6 |
| 4. I would need support to use this system (R) | 3.8 ± 0.9 |
| 5. I found the various functions were well integrated | 4.0 ± 0.7 |
| 6. I thought there was too much inconsistency (R) | 4.1 ± 0.6 |
| 7. Most people would learn this system very quickly | 3.9 ± 0.8 |
| 8. I found the system cumbersome to use (R) | 4.0 ± 0.7 |
| 9. I felt confident using the system | 4.1 ± 0.7 |
| 10. I needed to learn a lot before using this system (R) | 3.9 ± 0.8 |
| Total SUS score (standardized, 0–100) | 78.6 ± 10.3 |
| Note: Each item is scored from 1 (strongly disagree) to 5 (strongly agree). (R) indicates reverse-scored item. The total SUS score is calculated by summing the item scores (with reverse scoring for items 2, 4, 6, 8, 10), multiplying by 2.5, and converting to a 0–100 scale. The benchmark for above-average usability is 68 points. | |
Table 7: System Usability Scale (SUS) scores and item-level analysis. This table summarizes SUS scores for the intervention group at T2 (n = 73). The mean score of 78.6 ± 10.3 exceeds the usability benchmark of 68 (p < 0.001), indicating good system usability. Item-level means are also reported.
| Outcome | Comparison | Mean change (experimental) | Mean change (control) | Group difference in change (95% CI) | p-value | F-statistic (group x time) |
| GDS-15 | T1 - T0 | -1.7 | -0.4 | -1.3 (-1.9, -0.7) | 0.003 | 8.34 |
| T2 - T0 | -3.6 | -0.7 | -2.9 (-3.6, -2.2) | < 0.001 | ||
| T3 - T0 | -3.9 | -0.5 | -3.4 (-4.2, -2.6) | < 0.001 | ||
| UCLA-LS | T1 - T0 | -7.1 | -1.7 | -5.4 (-8.2, -2.6) | 0.002 | 7.96 |
| T2 - T0 | -13.7 | -2.3 | -11.4 (-14.2, -8.6) | < 0.001 | ||
| T3 - T0 | -14.4 | -2.6 | -11.8 (-14.8, -8.8) | < 0.001 | ||
| WHOQOL-OLD | T1 - T0 | 7.2 | 0.5 | 6.7 (4.2, 9.2) | 0.008 | 6.52 |
| T2 - T0 | 15.7 | 0.9 | 14.8 (12.2, 17.4) | < 0.001 | ||
| T3 - T0 | 16.5 | 1.4 | 15.1 (12.4, 17.8) | < 0.001 | ||
| LSNS-6 | T1 - T0 | 2.1 | 0.3 | 1.8 (1.1, 2.5) | 0.014 | 4.87 |
| T2 - T0 | 4.2 | 0.5 | 3.7 (2.9, 4.5) | < 0.001 | ||
| T3 - T0 | 3.9 | 0.6 | 3.3 (2.5, 4.1) | < 0.001 | ||
| *Note: Data are presented as mean change from baseline (T0) at each follow-up time point. Negative changes for GDS-15 and UCLA-LS indicate improvement; positive changes for WHOQOL-OLD and LSNS-6 indicate improvement. F-statistics are from mixed-effects models with group × time interaction. CI = confidence interval. | ||||||
Table 8: Time x group interaction effects for all outcome measures. This table reports mean changes from baseline, between-group differences in change with 95% confidence intervals, p-values for simple-effects comparisons, and F-statistics for group × time interactions from mixed-effects models. Significant interactions (p < 0.01 for all outcomes) indicate differential change trajectories between groups.
Discussie
Methodological significance of the proposed framework
The main contribution of this study was the establishment of a standardized methodological framework for developing and evaluating an LLM-driven virtual companion system for older adults at risk of social isolation. In contrast to traditional intervention studies focused on clinical effectiveness, the framework incorporates participant recruitment, system development, intervention implementation, outcome evaluation, data management, and statistical analysis as a reproducible workflow that improves methodological transparency and enables replication across different research settings19,20,21. A key advantage of our proposed framework is its flexibility and adaptability: by integrating personalized conversational configuration with a structured implementation protocol, it enables us to account for diverse user characteristics while maintaining a consistent procedure. Our representative results also show that we can successfully implement our methodology in both community and long-term care settings through uniform operational procedures. However, because this demonstration was conducted in a single geographic and cultural context, generalizability to other settings remains to be established. These features offer a practical methodological reference for future studies developing AI-assisted psychosocial interventions and for standardizing digital mental health research involving large language models in older adult populations.
Practical applicability of the LLM-driven virtual companion system
The proposed LLM-driven virtual companion system demonstrates considerable practical applicability as a standardized digital intervention for supporting older adults at risk of social isolation. By integrating natural language interaction with personalized conversational strategies, the system provides continuous emotional support while requiring relatively limited human resources. This implementation approach may help address the increasing demand for psychosocial care in aging populations, particularly in community health services and long-term care institutions where professional mental health resources are often limited.
The methodological framework also emphasizes ease of implementation and operational feasibility. Standardized participation training, standardized intervention processes, and defined evaluation protocols allow for consistent use across various care settings without introducing procedural variations22,23. Usability results from representative participants suggest that older adults could easily navigate the system with minimal technical difficulty, supporting the feasibility of integrating an AI-assisted virtual companion into routine care. Nevertheless, participants were required to have adequate hearing and vision and to speak Chinese, which may limit the applicability to older adults with sensory impairments or limited digital access. Because of its scalability and reproducible implementation, this framework can be applied to other populations that require long-term psychosocial support, providing a practical basis for future digital mental health services and AI-assisted care models.
Strengths and methodological considerations
A major strength of the proposed methodological framework is that it includes all steps in the process from system development through intervention implementation, as well as multidimensional evaluations using a standard protocol. This end-to-end workflow improves methodological consistency and allows for reproducible results across various research and care settings. By including predefined operating procedures, standardized participant management, and unified outcome assessments, we reduce procedural variation and allow for reliable implementation. Finally, combining objective clinical assessment with system usability evaluation provides a comprehensive way to assess both intervention performance and implementation feasibility.
Several methodological limitations should be acknowledged. First, the final analysis was restricted to completers (n = 148), which may introduce attrition bias despite the overall attrition rate being 7.5%. Second, assessors were not formally blinded to group allocation, which could introduce detection bias. Third, the framework was developed and validated in a single geographic and cultural context; adaptations may be needed across diverse cultural contexts, healthcare systems, or AI platforms. Fourth, the 12-week follow-up period is relatively short and does not capture long-term maintenance or potential habituation effects. Fifth, LLM-generated responses may vary across sessions or with model updates, which could affect the consistency and reproducibility of interventions. Sixth, conversational data collection raises privacy and safety considerations that require ongoing governance. Finally, participants were required to have adequate sensory and digital access, which may limit generalizability to older adults with limited technological access. These limitations do not detract from the framework's value but highlight opportunities for refinement in future methodological studies.
Alternative approaches for evaluating the framework include multicenter validation across diverse populations and healthcare systems, longer-term follow-up beyond 12 weeks, and replication using alternative LLM platforms to assess generalizability. Comparisons with non-LLM digital or social-support interventions would help clarify the added value of LLM-driven systems relative to conventional approaches.
Future applications and method development
The proposed methodological framework provides a foundation for the continued development and evaluation of AI-assisted psychosocial intervention systems for older adults. Further research could incorporate multimodal interaction technologies (e.g., facial expression recognition, wearable sensor data, adaptive voice analysis) into the framework to improve personalized emotional support24,25,26. Multicenter validation studies across diverse populations and healthcare settings can assess the generalizability and robustness of the framework under different implementations.
As large language model technologies continue to advance, the proposed protocol can be continuously refined by improving conversational strategies, safety mechanisms, and long-term user adaptation. The standardized workflow presented here is a reproducible template that integrates an AI-driven virtual companion system into routine community and institutional elder care. This methodology provides a practical foundation for future digital mental health interventions and facilitates the translation of artificial intelligence technology into aging and healthcare research. Future iterations should also incorporate explicit safety mechanisms, such as risk detection and escalation protocols, and examine long-term user adaptation as LLM technologies evolve.
Openbaarmakingen
The authors have no conflicts of interest to declare.
AUTHOR CONTRIBUTIONS:
Haichao Yao: Conceptualization, Methodology, Software, Investigation, Data curation, Formal analysis, Writing – original draft, Writing – review & editing, Project administration
Dankbetuigingen
We thank the participating community health service centers and long-term care institutions for their support in participant recruitment and data collection. We also thank the research staff and trained assessors for their contributions to intervention delivery, follow-up assessments, and data management. Finally, we are grateful to all older adults who participated in this study for their time and engagement.
Materialen
| Naam | Bedrijf | Catalogusnummer | Opmerkingen |
|---|---|---|---|
| Automatic Speech Recognition (ASR) module | Google Cloud | https://cloud.google.com/speech-to-text | Voice input recognition |
| GPT-4 API | OpenAI | https://platform.openai.com/login | Large language model conversational engine via API |
| Local server | Institution operated | N/A | Deploy virtual companion backend securely |
| R | R Foundation for Statistical Computing | https://www.r-project.org/? | Statistical analysis (Version 4.3.1) |
| SPSS Statistics 26.0 | IBM | https://www.ibm.com/products/spss-statistics? | Statistical analysis (Version 26.0) |
| Text-to-Speech (TTS) module | Google Cloud | https://cloud.google.com/text-to-speech? | Voice output synthesis |
| Virtual companion system user manual | Study-developed | N/A | Training material |
Referenties
- Sun M, et al. Can AI become a friend to older adults? Exploring chatbot interaction design strategies to alleviate social isolation. Int J Hum Comput Interact. 2026;42(15):11710-30.
- Valtolina S, et al. Charlie: a chatbot to improve the elderly quality of life and to make them more active to fight their sense of loneliness [conference paper]. Presented at: 14th Biannual Conference of the Italian SIGCHI Chapter (CHItaly '21); Bolzano, Italy; 2021. p. 1-5. DOI 10.1145/3464385.3464726.
- Marziali RA, et al. Reducing loneliness and social isolation of older adults through voice assistants: literature review and bibliometric analysis. J Med Internet Res. 2024;26:e50534.
- Alotaibi JO, et al. The role of conversational AI agents in providing support and social care for isolated individuals. Alex Eng J. 2024;108:273-84.
- Satake Y, et al. Autonomous conversational agents for loneliness, social isolation, depression, and anxiety in older people without cognitive impairment: systematic review and meta-analysis. Psychol Med. 2026;56:e27.
- Suroyo, et al. Addressing loneliness and psychological distress in older adults through an AI chatbot companion: a longitudinal study in Pekanbaru. J Psychol AI. 2026;2(1):2657118.
- Jiao F, et al. Addressing loneliness by AI chatbot: a qualitative study of empty-nest elderly. BMC Public Health. 2026;26(1):685.
- Dosovitsky G, et al. Bonding with bot: user feedback on a chatbot for social isolation. Front Digit Health. 2021;3:735053.
- Yang Y, et al. AI applications to reduce loneliness among older adults: a systematic review of effectiveness and technologies. Healthcare (Basel). 2025;13(5):446.
- Kramer LL, et al. Use and effect of web-based embodied conversational agents for improving eating behavior and decreasing loneliness among community-dwelling older adults: protocol for a randomized controlled trial. JMIR Res Protoc. 2021;10(1):e22186.
- Qi X, et al. ChatGPT: a promising tool to combat social isolation and loneliness in older adults with mild cognitive impairment. Neurology Live. 2023;6(3). https://www.neurologylive.com/view/chatgpt-promising-tool-combat-social-isolation-loneliness-older-adults
- Liu AR, et al. The heterogeneous effects of AI companionship: an empirical model of chatbot usage and loneliness and a typology of user archetypes. Proc AAAI/ACM Conf AI Ethics Soc. 2025;8(2):1585-97. DOI 10.1609/aies.v8i2.36658.
- Bott N, et al. A protocol-driven, bedside digital conversational agent to support nurse teams and mitigate risks of hospitalization in older adults: case control pre-post study. J Med Internet Res. 2019;21(10):e13440.
- García-Méndez S, et al. Entertainment chatbot for the digital inclusion of elderly people without abstraction capabilities. IEEE Access. 2021;9:75878-91.
- Sidner CL, et al. Creating new technologies for companionable agents to support isolated older adults. ACM Trans Interact Intell Syst. 2018;8(3):1-27.
- Al Mazroui K, et al. The role of ChatGPT in mitigating loneliness among older adults: an exploratory study. Online J Commun Media Technol. 2024;14(4):e202444.
- Dang NB, et al. Beyond companionship: exploring the role of social robots in mitigating emotional and social loneliness of the elderly. J Macromarketing. 2025;45(4):612-31.
- Jain G, et al. Digital companionship: the interplay of conversational AI, loneliness, social anxiety, and quality of life among young adults. Acta Psychol (Amst). 2026;264:106467.
- Ring L, et al. Social support agents for older adults: longitudinal affective computing in the home. J Multimodal User Interfaces. 2015;9(1):79-88.
- Sparrow R, et al. Against imaginary friends: why digital companions are no solution to social isolation. Commun ACM. 2026;69(2):60-8.
- Yan M, et al. Efficacy of artificial agents in loneliness alleviation among older adults: a protocol for a systematic review and meta-analysis. BMJ Open. 2026;16(3):e110667.
- Kim KM, et al. Experience of the use of AI conversational agents among low-income older adults living alone. SAGE Open. 2024;14(4):1-13.
- Wiederhold BK. Between care and code: AI companions in the lives of older adults. Cyberpsychol Behav Soc Netw. 2026;29(4):206-8.
- Irfan B, et al. Recommendations for designing conversational companion robots with older adults through foundation models. Front Robot AI. 2024;11:1363713.
- Uenishi M, et al. From companion technologies to social care infrastructure: a multi-level perspective on loneliness-related support in dementia care in an era of artificial intelligence (AI). Glob Health Med. 2026;8(3):215-21.
- Chen F, et al. Bridging the cognitive gap: co-designing and evaluating a voice-enabled community chatbot for older adults. arXiv [Preprint]. 2026;arXiv:2603.11303. Available from: https://arxiv.org/abs/2603.11303