Test zalewania sadzonek ułatwia szybkie badanie odmian dzikich pomidorów pod kątem odporności na bakterię Pseudomonas syringae. Ten test, stosowany w połączeniu z testem wzrostu bakterii siewek, może pomóc w dalszym charakteryzowaniu podstawowej odporności na bakterię i może być wykorzystany do mapowania populacji w celu określenia genetycznych podstaw odporności.
Subskrypcja JoVE jest wymagana do oglądania tego materiału. Zaloguj się lub rozpocznij bezpłatny okres próbny.
Artykuł metodologiczny
Wysokoprzepustowa identyfikacja oporności na Pseudomonas syringae pv. Pomidor w pomidorze za pomocą testu powodziowego sadzonek
W tym artykule
Informacja o sprostowaniu
Important: There has been an erratum issued for this article. View Erratum Notice
Podsumowanie
Streszczenie
Pomidor to agronomicznie ważna roślina, która może zostać zainfekowana przez Pseudomonas syringae, bakterię Gram-ujemną, powodując bakteryjną chorobę plamistą. Pomidor-P. syringae pv. TomaTo PatoSystem jest szeroko stosowany do analizy genetycznych podstaw wrodzonych reakcji roślin i odporności na choroby. Podczas gdy choroba była skutecznie zwalczana przez wiele dziesięcioleci poprzez wprowadzenie klastra genów Pto/Prf z Solanum pimpinellifolium do uprawianych pomidorów, szczepy P. syringae rasy 1 ewoluowały, aby przezwyciężyć oporność nadaną przez klaster genów Pto/Prf i występują na całym świecie.
Dzikie gatunki pomidorów są ważnymi rezerwuarami naturalnej różnorodności w rozpoznawaniu patogenów, ponieważ ewoluowały w różnych środowiskach o różnym nacisku na patogeny. W typowych badaniach przesiewowych odporności na choroby dzikich pomidorów stosuje się dorosłe rośliny, które mogą ograniczać liczbę roślin, które można przesiewać ze względu na ich wydłużony czas wzrostu i większe wymagania dotyczące przestrzeni wzrostu. Opracowaliśmy metodę przesiewania 10-dniowych sadzonek pomidorów pod kątem odporności, która minimalizuje czas wzrostu roślin i przestrzeń komory wzrostu, umożliwia szybki obrót roślin i umożliwia testowanie dużych rozmiarów próbek. Wyniki przeżycia lub śmierci siewek mogą być traktowane jako fenotypy dyskretne lub w skali odporności zdefiniowanej przez ilość nowych przyrostów siewek, które przeżyły po powodzi. Metoda ta została zoptymalizowana do przesiewania 10-dniowych sadzonek pomidorów pod kątem odporności na dwa szczepy P. syringae i może być łatwo dostosowana do innych szczepów P. syringae.
Wprowadzenie
Pseudomonas syringae to bakteria chorobotwórczy Gram-ujemna, która infekuje szeroką gamę gospodarzy roślinnych. Bakterie dostają się do rośliny żywicielskiej przez aparaty szparkowe lub rany fizyczne i namnażają się w apoplast1. Rośliny wykształciły dwupoziomową odpowiedź immunologiczną w celu ochrony przed infekcją patogenami bakteryjnymi. Pierwszy poziom występuje na powierzchni komórki roślinnej, gdzie receptory rozpoznawania wzorców na błonie komórkowej rośliny postrzegają wysoce konserwatywne wzorce molekularne związane z patogenami (PAMP) w procesie zwanym odpornością wyzwalaną przez PAMP (PTI)2. Podczas tego procesu roślina żywicielska zwiększa szlaki odpowiedzi obronnej, w tym odkładanie kalozy na ścianie komórkowej, zamykanie aparatów szparkowych, produkcję reaktywnych form tlenu i indukcję genów związanych z patogenezą.
Bakterie mogą pokonać PTI, wykorzystując system wydzielania typu III do dostarczania białek, zwanych efektorami, bezpośrednio do komórki roślinnej3. Białka efektorowe często atakują składniki PTI i promują zjadliwość patogenów4. Drugi poziom odporności roślin zachodzi w komórce roślinnej po rozpoznaniu białek efektorowych. Rozpoznanie to zależy od genów oporności, które kodują receptory zawierające powtórzenia bogate w leucynę (NLR) w miejscu wiązania nukleotydów. NLR-y są zdolne do bezpośredniego rozpoznawania efektorów lub rozpoznawania ich aktywności na celu wirulencji lub wabiku5. Następnie wywołują wtórną odpowiedź immunologiczną w procesie zwanym odpornością efektorową (ETI), która często wiąże się z reakcją nadwrażliwości (HR), formą zlokalizowanej śmierci komórki w miejscu infekcji6. W przeciwieństwie do oporności między genami związanej z ETI, rośliny mogą wykazywać ilościową częściową odporność, która zależy od udziału wielu genów7.
P. syringae pv. pomidor (Pst) jest czynnikiem sprawczym bakteryjnej plamki na pomidorze i stanowi uporczywy problem rolniczy. Dominującymi szczepami w terenie były zazwyczaj szczepy rasy Pst 0, które wyrażają jeden lub oba efektory typu III: AvrPto i AvrPtoB. DC3000 (PstDC3000) jest reprezentatywnym szczepem rasy 0 i modelowym patogenem, który może powodować plamki bakteryjne w pomidorach. Aby zwalczyć bakteryjną chorobę plamistości, hodowcy wprowadzili klaster genów PTO [P. syringae pv. tomato]/Prf [Pto resistance and fenthion sensitivity] z dzikiego gatunku pomidora Solanum pimpinellifolium do nowoczesnych odmian8,9. Gen Pto koduje kinazę białkową serynowo-treoninową, która wraz z Prf NLR nadaje oporność na PstDC3000 poprzez rozpoznawanie efektorów AvrPto i AvrPtoB10,11,12,13,14. Jednak ta odporność jest nieskuteczna przeciwko pojawiającym się szczepom rasy 1, co pozwala na ich szybkie i agresywne rozprzestrzenianie się w ostatnich latach15,16. Szczepy rasy 1 unikają rozpoznania przez klaster Pto/Prf, ponieważ AvrPto jest albo utracony, albo zmutowany w tych szczepach, a AvrPtoB wydaje się gromadzić minimalnie15,17,18.
Populacje dzikich pomidorów są ważnymi rezerwuarami naturalnej zmienności odporności na Pst i były wcześniej wykorzystywane do identyfikacji potencjalnych loci19,20,21. Jednak obecne badania przesiewowe odporności na patogeny wykorzystują 4–5-tygodniowe dorosłe rośliny20,21. W związku z tym są one ograniczone czasem wzrostu, przestrzenią komory wzrostowej i stosunkowo małymi rozmiarami próbek. Aby zaradzić ograniczeniom konwencjonalnych podejść, opracowaliśmy wysokoprzepustowy test odporności pomidora na P. syringae przy użyciu 10-dniowych sadzonek pomidorów22. Takie podejście ma kilka zalet w porównaniu z dorosłymi roślinami: a mianowicie krótszy czas wzrostu, mniejsze wymagania przestrzenne i większą przepustowość. Ponadto wykazaliśmy, że takie podejście wiernie odwzorowuje fenotypy odporności na choroby obserwowane u dorosłych roślin22.
W opisanym w tym protokole teście zalewania sadzonek, sadzonki pomidorów są hodowane na szalkach Petriego z sterylnych pożywek Murashige i Skoog (MS) przez 10 dni, a następnie zalewane są inokulum zawierającym interesujące nas bakterie i środek powierzchniowo czynny. Po zalaniu siewki można ilościowo ocenić pod kątem odporności na choroby za pomocą testów wzrostu bakterii. Dodatkowo, przeżycie lub śmierć siewek może działać jako dyskretny fenotyp odporności lub choroby 7-14 dni po powodzi. Podejście to stanowi wysokoprzepustową alternatywę dla badań przesiewowych dużej liczby dzikich pomidorów pod kątem odporności na szczepy Pst rasy 1, takie jak Pst szczep 19 (Pst19), i może być łatwo dostosowane do innych szczepów bakteryjnych będących przedmiotem zainteresowania.
Dostęp ograniczony. Zaloguj się lub rozpocznij wersję próbną, aby wyświetlić tę treść.
Protokół
1. Przygotowanie i użytkowanie komory z laminarnym przepływem powietrza
- Przetrzeć komorę bezpieczną z 70% etanolem.
- Zamknąć szybę i włączyć lampę ultrafioletową w komorze bezpiecznej na 15 min.
- Po 15 min wyłączyć lampę ultrafioletową w komorze bezpiecznej. Podnieść szybę i włączyć nawiew na 15 min.
- Wszystkie przedmioty, które będą używane w komorze bezpiecznej, należy przetrzeć 70% etanolem przed włożeniem ich do sterylizowanej komory.
- Przed rozpoczęciem pracy w komorze bezpiecznej przetrzeć rękawiczki lub dłonie 70% etanolem.
- Pracować w centrum komory bezpiecznej, z dala od nawiewu.
- Do eksperymentów używać nieotwartych butelek z autoklawowanym, sterylnym 10 mM MgCl2 oraz ultrazczystą H2O. Butelki umieścić w komorze bezpiecznej i otwierać je wyłącznie w sterylizowanej komorze, a nie na blacie roboczym.
- Do pracy w sterylizowanej komorze bezpiecznej używać dedykowanych pipet szklanych i końcówek do pipet. Należy upewnić się, że są one otwierane wyłącznie w komorze bezpiecznej, nigdy na blacie roboczym.
- Po zakończeniu pracy w komorze bezpiecznej autoklawować wszystkie odpady (z wyjątkiem odpadów z podchlorynem) i przetrzeć powierzchnię 70% etanolem.
2. Przygotowanie pożywek roślinnych
- Odważyć i rozpuścić sole podstawowe 0,5x MS w wodzie ultraczystej H2O. Odważyć 0,8% agaru bacto, a następnie dodać go do rozpuszczonych soli 0,5x MS.
- Autoklawować i pozostawić pożywkę do ochłodzenia w kąpieli wodnej o temperaturze 50 ˚C przez 1 h przed rozlewaniem lub pipetowaniem.
- Aby uniknąć przepełnienia płytek, zaznaczyć na jednorazowych sterylnych płytkach polistyrenowych 100 x 25 mm poziom napełnienia 40 mL. Rozlać pożywkę do sterylnych płytek 100 x 25 mm w wysterylizowanej komorze z laminarem.
3. Przygotowanie materiału roślinnego i warunki wzrostu
- Umieścić nasiona pomidora w probówce do mikrocentryfugi o pojemności 2,2 mL i dodać 2,0 mL 50% roztworu wybielacza.
- Inkubować probówkę na wytrząsarce przez 25 min.
- Po 25 min wyjąć nasiona z wytrząsarki i usunąć roztwór wybielacza za pomocą pipety w sterylnej komorze z laminarnym przepływem powietrza. Należy upewnić się, że cały wybielacz został usunięty.
- Dodać 2 mL sterylnej ultraczystej H2O w celu przemycia nasion. Odwrócić probówkę 5 razy.
- Usunąć ciecz z probówki za pomocą pipety.
- Powtórzyć kroki 3.3–3.5, aby przemyć nasiona jeszcze 4 razy.
- Dodać 2 mL sterylnej ultraczystej H2O i przelać nasiona do pustej sterylnej szalki Petriego.
- Wypalić pęsetę w etanolu i pozostawić do ostygnięcia przed przeniesieniem i równomiernym rozmieszczeniem nasion na płytkach 100 x 25 mm zawierających pożywkę 0,5x MS + 0,8% agar.
- Przenieść 5–7 nasion w linii przez środek jednej płytki i zabezpieczyć brzegi płytek taśmą chirurgiczną (1,25 cm x 9,1 m).
- Stratyfikować sterylizowane nasiona w temperaturze 4 ˚C w ciemności przez co najmniej 3 dni w celu synchronizacji kiełkowania. Należy upewnić się, że płytki są ułożone płasko i stroną górną do góry, aby nasiona nie przesuwały się po płytce.
- Podczas przenoszenia do komory wzrostowej ustawić płytki pionowo tak, aby korzenie rosły w dół wzdłuż powierzchni płytki, a linia nasion była zorientowana poziomo.
UWAGA: Ustawić komorę wzrostową na 22 ˚C i zapewnić 16 h światła o natężeniu ~200–220 µE meter-2 s-1 oraz 8 h ciemności. - Przed zalaniem roślin uprawiać siewki przez 10 dni w komorze wzrostowej; w tym czasie siewki zazwyczaj wykazują w pełni wyłonione i rozwinięte kotyledony oraz wyrastające pierwsze liście właściwe (Rysunek 1).

Rysunek 1: Stadium rozwojowe typowych 10-dniowych siewek pomidora. Nasiona pomidora Rio Grande-PtoR zostały wysterylizowane, wysiane na podłoże i stratyfikowane przez co najmniej 3 dni w ciemności w temperaturze 4 ˚C. Siewki hodowano na pożywkach 0.5x MS przez 10 dni w temperaturze 22 ˚C przed przeprowadzeniem zalewania. Typowo w 10. dniu liścienie są w pełni rozwinięte, a zaczynają pojawiać się pierwsze liście właściwe. Kliknij tutaj, aby wyświetlić powiększoną wersję tego rysunku.
4. Przygotowanie pożywki King's B23 (KB)
- Napełnić zlewkę 500 mL ultrapure H2O i mieszać na mieszadle magnetycznym.
- Całkowicie rozpuścić 20 g peptonu bacto, 1,5 g bezwodnego K2HPO4 oraz 12,5 mL glicerolu w zlewce z ultrapure H2O.
- Przeżyć rozpuszczoną mieszaninę do cylindra miarowego o pojemności 1 L i uzupełnić ultrapure H2O do objętości końcowej 1 L.
- Przelać bulion z powrotem do zlewki i mieszać do uzyskania jednorodności.
- Odważyć 7,5 g agaru bacto do dwóch szklanych butelek o pojemności 500 mL i dodać do każdej butelki 500 mL bulionu KB z kroku 4.4. Autoklawować przez 20 min.
- Wyjąć butelki z autoklawu i delikatnie zamieszać ruchem wirowym, aby rozprowadzić agar.
- Przenieść butelki do kąpieli wodnej o temperaturze 50 ˚C na 1 h.
- Po 1 h przenieść butelkę do komory z laminarnym przepływem powietrza i w warunkach aseptycznych dodać do pożywki 1600 µL sterylnego 1 M MgSO4 oraz odpowiednie antybiotyki.
UWAGA: Dla szczepów opornych na ryfampicynę PstDC3000 i Pst19 należy użyć ryfampicyny rozpuszczonej w dimetyloformamidzie w stężeniu końcowym 50 µg/mL. Należy użyć cykloheksymidu rozpuszczonego w etanolu w stężeniu końcowym 50 µg/mL, aby zapobiec wzrostowi grzybów na płytkach. - Delikatnie zamieszać pożywkę ruchem wirowym w celu wymieszania, a następnie wylać ją tak, aby pokryła dno płytek.
- Pozostawić płytki na co najmniej 1 h do stężenia, a następnie przechowywać je odwrócone dnem do góry w temperaturze 4 ˚C.
5. Utrzymanie szczepów bakteryjnych i warunki hodowli
- Przechowywać zapas glicerynowy z pojedynczej kolonii bakterii jako 1 mL nasyconej kultury bakteryjnej i 333 µL sterylnego 80% glicerolu w temperaturze -80 ˚C.
- Przenieść bakterie (np. Pst19) z zapasu glicerynowego na agar KB z odpowiednimi antybiotykami (sekcja 4).
- Pozostawić bakterie do regeneracji przez 2 dni w temperaturze 28 ˚C przed wysiewaniem świeżych bakterii na selektywny agar KB przy użyciu płaskiego, sterylnego wykałaczkę.
- Wysiać świeże bakterie z zapasu glicerynowego na odpowiedni selektywny agar KB, używając płaskiego, sterylnego wykałaczkę.
UWAGA: Upewnić się, że przeniesiony zapas glicerynowy nie jest starszy niż 2 tygodnie. - W przypadku PstDC3000 inkubować płytkę KB w temperaturze 28 ˚C przez 24 h przed użyciem bakterii w eksperymencie z zalewaniem.
- W przypadku Pst19 inkubować płytkę KB w temperaturze 28 ˚C przez 48 h przed użyciem bakterii w eksperymencie z zalewaniem.
6. Przygotowanie inokulum Pst19
- Aseptycznie resuspenduj bakterie w sterylnym 10 mM MgCl2 do gęstości optycznej przy 600 nm (OD600) wynoszącej 0,1, lub około 5 x 10⁷ jednostek tworzących kolonie (CFU)/mL).
- Przeprowadź rozcieńczenia seryjne w komorze z laminarnym przepływem powietrza, używając sterylnego roztworu 10 mM MgCl2. W przypadku Pst19 użyj spektrofotometru, aby przygotować inokulum o stężeniu początkowym OD600 = 0,1.
- Dla Pst19 wykonaj rozcieńczenie 1/10 z początkowej resuspensji o OD600 = 0,1, aby uzyskać rozcieńczenie seryjne o stężeniu OD600 = 0,01.
- Używając rozcieńczenia seryjnego o OD600 = 0,01 z kroku 6.3, wykonaj rozcieńczenie 3/4, aby uzyskać końcowe OD600 = 0,0075.
- Przygotuj rozcieńczenie 1/10 niejonowego organokrzemowego surfaktantu kopolimeru C13H34O4Si3 (tj. surfaktantu) w 10 mM MgCl2 i mieszaj w wortexie przez 15 s. Dodaj roztwór stokowy surfaktantu 1/10 do ostatniego rozcieńczenia seryjnego (OD600 = 0,0075) do stężenia końcowego 0,015% i wymieszaj poprzez delikatne kołysanie.
7. Przygotowanie inokulum PstDC3000
- Aseptycznie resuspender bakterie w sterylnym 10 mM MgCl2 do gęstości optycznej przy 600 nm (OD600) wynoszącej 0,1 (około 5 x 10⁷ CFU/mL).
- Wykonać rozcieńczenia seryjne w sterylnym roztworze 10 mM MgCl2 w komorze z laminarnym przepływem powietrza. W przypadku PstDC3000 użyć spektrofotometru, aby przygotować inokulum o początkowym stężeniu OD600 = 0,1.
- Dla PstDC3000 przygotować rozcieńczenie 1/10 z początkowej resuspensji o OD600 = 0,1, aby uzyskać rozcieńczenie seryjne o stężeniu OD600 = 0,01.
- Wykorzystując rozcieńczenie seryjne o OD600 = 0,01 z kroku 3, przygotować rozcieńczenie 1/2, aby uzyskać końcową wartość OD600 = 0,005.
- Przygotować rozcieńczenie 1/10 surfaktantu w 10 mM MgCl2 i mieszać w wortexie przez 15 s. Dodać roztwór stokowy surfaktantu 1/10 do ostatniego rozcieńczenia seryjnego (OD600 = 0,005) do końcowego stężenia 0,015% i dokładnie wymieszać przez delikatne potrząsanie.
8. Metoda zalewania siewek pomidora
- Wyjmij płytki z 10-dniowymi siewkami z komory wzrostowej i umieść je w komorze z laminarnym przepływem powietrza, aby przygotować płytki do zalewania.
- Usuń taśmę chirurgiczną z dwóch płytek.
- Ustaw timer na 3 min. Odmierz 6 mL końcowego inokulum (Pst19 OD600 = 0,0075 [sekcja 6] lub PstDC3000 OD600 = 0,005 [sekcja 7]) i przenieś 6 mL inokulum na każdą płytkę z 10-dniowymi siewkami.
- Delikatnie dociśnij siewki do inokulum za pomocą sterylnego końcówki pipety. Uruchom timer.
- Trzymaj po jednej płytce w każdej dłoni. Przechyl przód płytki w dół, aby zgromadzić inokulum i zanurzyć głównie liścienie oraz liście siewek.
- Wykonaj 5–7 ruchów z boku na bok, a następnie przechyl płytki z powrotem, aby zakryć korzenie i całą powierzchnię płytki.
- Ponownie przechyl płytki w dół, aby zanurzyć liścienie i liście, i powtarzaj tę czynność przez łącznie 3 min.
- Zlej inokulum z płytek, odstaw je na płaską powierzchnię, a następnie zlej pozostałe inokulum po raz drugi.
- Ponownie owiń płytki taśmą chirurgiczną i powtórz kroki 8.2–8.8 dla pozostałych płytek.
- Po zalaniu wszystkich płytek ponownie inkubuj je w komorze wzrostowej (patrz UWAGA w kroku 3.11).
- Wykonaj fenotypowanie po 7–10 dniach dla PstDC3000 lub po 10–14 dniach dla Pst19 (sekcja 11). W przypadku przeprowadzania testów wzrostu bakterii, pobierz tkankę liściową po 4 dniach (sekcje 9 i 10), a następnie wykonaj fenotypowanie (sekcja 11). Alternatywnie, przeprowadź analizę fenotypową i testy wzrostu bakterii na oddzielnych zestawach roślin.
9. Sterylizacja powierzchniowa liści zasobowych do testu wzrostu bakterii
- Cztery dni po zalaniu i ponownym inkubowaniu siewek w komorze wzrostowej (sekcja 8), wyjmij płytki z siewkami pomidora z komory wzrostowej.
- Ponumeruj poszczególne siewki na zewnętrznej stronie dna płytki w miejscu przytwierdzenia siewki do płytki dla każdego genotypu.
- Oznakuj sterylne probówki do mikrocentryfugi o pojemności 1,5 mL numerami poszczególnych siewek i za pomocą czystej pęsety wrzuć do każdej probówki jedno sterylne kuleczką borokrzemianowe o średnicy 3 mm do zastosowania w homogenizatorze kulowym (bead beater). (Patrz UWAGA w kroku 10.1.)
- Pipetuj 200 µL 10 mM MgCl2 do każdej probówki i zamknij je.
- Przygotuj 70% etanol i wlej 100 mL do czystego zlewki. Wlej 100 mL sterylnej ultraczystej H2O do oddzielnej, czystej zlewki.
- Oczyść stalowe proste pęsety precyzyjne z ząbkowanymi końcówkami za pomocą etanolu. Delikatnie uchyl płytkę, aby umożliwić aseptyczne usunięcie jednego liścia zakorzennego (kotyledonu) za pomocą czystej pęsety.
- Uciśnij ogonek u podstawy liścia zakorzennego, aby usunąć liść, i wrzuć go do zlewki z 70% etanolem w celu sterylizacji powierzchniowej przez 10 s. Przepłucz liść zakorzenny w ultraczystej H2O przez 10 s.
- Połóż liść zakorzenny na ręczniku papierowym i osusz go delikatnie za pomocą chusteczek laboratoryjnych.
- Zważ oddzielnie każdy liść zakorzenny po sterylizacji powierzchniowej i osuszeniu, a następnie zapisz jego wagę.
- Umieść liść zakorzenny w wcześniej przygotowanej probówce do mikrocentryfugi o pojemności 1,5 mL (z kroków 9.3 i 9.4) oznakowanej odpowiednim genotypem i numerem siewki.
- Ponownie zabezpiecz płytki sterylną taśmą i inkubuj siewki w komorze wzrostowej (patrz UWAGA w kroku 3.11).
10. Analiza wzrostu bakterii
- Używając próbek z kroku 9.10, homogenizować tkankę za pomocą homogenizatora kuleczkowego w 10 mM MgCl2 przez 1–2 min. Jeśli tkanka nie została odpowiednio rozdrobniona, powtórzyć homogenizację.
UWAGA: Wielu producentów oferuje homogenizatory kuleczkowe. Liczbę i rodzaj kuleczek, a także czas i prędkość homogenizacji (jeśli są programowalne), należy zoptymalizować dla każdego typu urządzenia. Należy upewnić się, że próbki nie przegrzewają się podczas homogenizacji. - Do każdej probówki zawierającej rozdrobnioną tkankę z kroku 10.1 dodać 800 µL 10 mM MgCl2 i kilkukrotnie odwrócić, aby wymieszać.
- Przygotować rozcieńczenia seryjne dla każdej próbki w 10 mM MgCl2 na płytce 96-dołkowej (100, 10-1, 10-2, 10-3, 10-4, 10-5) za pomocą pipety wielokanałowej (Rycina 2A).
- Za pomocą pipety wielokanałowej nanieść 5 µL z każdej serii rozcieńczeń na płytkę z agarem KB (150 mm x 15 mm) z cykloheksymidą i odpowiednim selektorem dla badanego szczepu bakterii (patrz UWAGA w kroku 4.8). Pozostawić płytki do całkowitego wyschnięcia.
- Inkubować płytki dnem do góry w temperaturze 28 ˚C przez 36 h, a następnie zwizualizować (Rycina 2B) kolonie na płytkach za pomocą mikroskopu stereoskopowego, aby ocenić, czy kolonie są wystarczająco duże do zliczenia.
UWAGA: Jeśli kolonie nie są wystarczająco duże, ponownie inkubować płytki i sprawdzać rozmiar kolonii co kilka godzin. Zazwyczaj kolonie są możliwe do zliczenia po ok. 36–48 h inkubacji.

Rycina 2: Rozcieńczenia seryjne dla testów wzrostu bakterii w siewkach. (A) Rozdrobniona tkanka liścia z zainfekowanych roślin jest rozcieńczana przed liczeniem kolonii. Rozcieńczenia są wykonywane na płytce 96-dołkowej (100 to roztwór nierozcieńczony). Zazwyczaj wykonuje się rozcieńczenia od 10-1 do 10-5. (B) Wysiew rozcieńczeń w celu zliczenia kolonii bakteryjnych. Łącznie 5 µL z każdej kolumny serii rozcieńczeń jest wysiewanych, od najbardziej rozcieńczonego do najbardziej stężonego. Po całkowitym wyschnięciu kolonii płytkę inkubuje się w temperaturze 28 ˚C przez 36–48 h. Kolonie są liczone pod stereomikroskopem z powiększeniem 10x. Kliknij tutaj, aby wyświetlić powiększoną wersję tej ryciny.
- Policz kolonie pod mikroskopem stereoskopowym przed ich zrośnięciem się (Rysunek 2B). Należy policzyć kolonie na płytkach z serii rozcieńczeń, na których znajduje się mniej niż 100 kolonii.
- Po uzyskaniu liczby kolonii (Rycina 2B), znormalizować liczebność do 0,1 g tkanki dla siewek i przeliczyć na logarytmiczny wzrost bakterii (Tabela 1).
UWAGA: Średnia masa jednego nasiona odmiany Moneymaker-PtoS masa liścia zasłonowego wynosi 0,1 g i została określona empirycznie22.
| Genotyp1 Kolumna A | Masa tkanki (g) Kolumna B | Liczba kolonii w plamce w kolumnie C | Współczynnik rozcieńczenia dla plamki2 Kolumna D | Skorygowana liczba kolonii3 Kolumna E | Współczynnik rozcieńczenia dla rozcieńczeń seryjnych w kolumnie F | Całkowita liczba kolonii Kolumna G (cfu/0,01 g)4 | Średnia liczba kolonii (jtk/0,01 g) Kolumna H | Średni logarytmiczny przyrost (jtk/0,1 g (log10)) Kolumna I |
| Próbka 1 | 0,04 g | 10 | 200 | obliczone jako: (C2 x 0,1 g) / B2 = 25 | 1000 | obliczono jako: (D2 x E2 x F2) = 5000000 | średnia od próbki 1 do ostatniej próbki: (tzn. średnia G1:G3) = 7000000 | log średniej, tj. log(H2) = 6,85 |
| Próbka 2 | 0,03 g | 15 | 200 | 50 | 1000 | 10000000 | ||
| Próbka 3 | 0,02 g | 6 | 200 | 30 | 1000 | 6000000 | ||
| 1Dane przedstawione dla 3 próbek | ||||||||
| 2Na podstawie wysiewu na szalki 5 µL x 200 na 1 ml | ||||||||
| 3Liścienie są zbyt małe, aby można było wyciąć z nich rdzenie, dlatego liczbę kolonii znormalizowano do 0,1 g tkanki na podstawie średniej masy jednego liścienia odmiany MoneyMaker.PtoKiełkowiec S (dane nie przedstawiono) | ||||||||
| 4Skorygowano na ml w zależności od objętości posiewu | ||||||||
Tabela 1: Przykładowe obliczenia dla testu wzrostu bakterii w siewkach. Przykładowe obliczenia obrazują sposób normalizacji liczby bakterii oraz wyznaczania logarytmicznego wzrostu bakterii.
- W przypadku akcesji dzikich oraz innych linii o złożonym tle genetycznym należy skorelować poziom wzrostu bakterii w poszczególnych siewkach z ich fenotypem, zgodnie z opisem w sekcji 11.
11. Fenotypowanie oporności
- Wyjmij płytki z komory wzrostowej i po 7–14 dniach określ fenotyp poszczególnych siewek: śmierć (wynikającą z choroby) lub przeżycie (wynikające z odporności).
- W przypadku roślin zainfekowanych silnie wirulentnym szczepem, takim jak PstDC3000, ocenę fenotypową przeprowadź wcześniej, w 7–10 dniu po inokulacji metodą zalewania.
- W przypadku roślin zainfekowanych szczepem Pst19 ocenę fenotypową przeprowadź w 10–14 dniu po inokulacji metodą zalewania.
- Ustal system punktacji w oparciu o zakres zaobserwowanych fenotypów odporności. Zapisz fenotypy binarne dla odmian, linii izogenicznych i linii dzikich wykazujących spójne fenotypy odporności od silnej do umiarkowanej (Rysunek 4A, 4B).
- Jeśli w czasie trwania oceny fenotypowej siewka wykazuje nowy wzrost z merystemu wierzchołkowego, uznaj ją za przeżywającą. Jeśli siewka ma brązowy merystem wierzchołkowy i nie wykazuje nowego, zielonego wzrostu wegetatywnego, uznaj ją za obumarłą (Rysunek 3).

Rysunek 3: Schematyczna reprezentacja siewki pomidora. Przedstawiono poszczególne części siewki pomidora, w tym podkotylową, liśniki, epikotyl, merystem wierzchołkowy pędu oraz liście właściwe. Kliknij tutaj, aby wyświetlić większą wersję tego rysunku.
- Zarejestruj fenotypy w spektrum choroby dla populacji, takich jak populacje mapujące F2, wykazujących szeroki zakres fenotypów odporności (Rysunek 4C).
- Uważnie monitoruj siewki pod kątem pojawienia się objawów choroby oraz obumierania, aby określić odpowiedni przedział czasowy do fenotypowania.
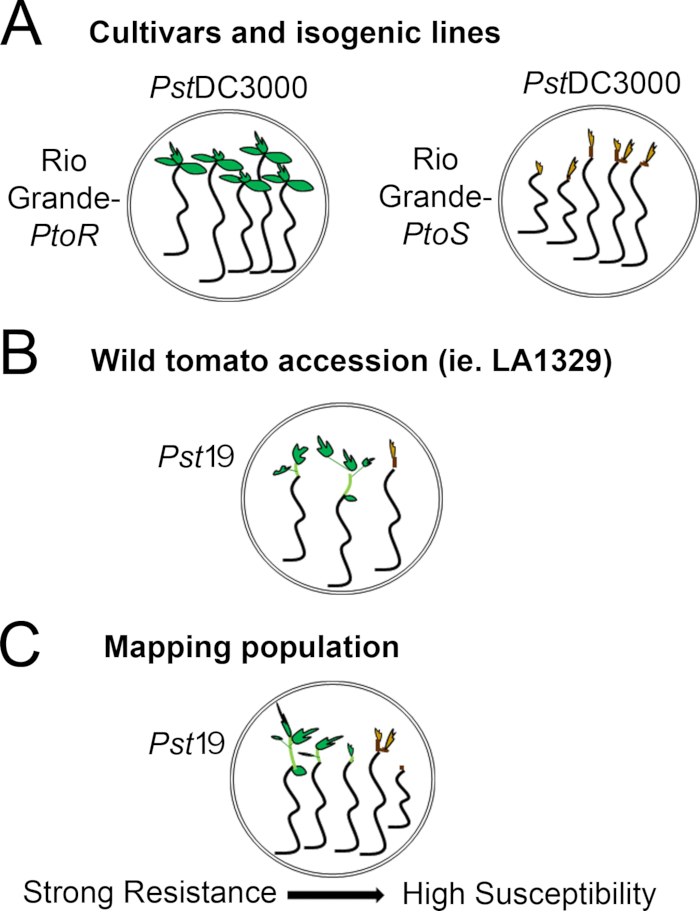
Rysunek 4: Schematyczne przedstawienie oczekiwanych fenotypów odporności i obumierania siewek w różnych tłach genetycznych. (A) Siewki Rio Grande-PtoR oraz niemal izogenna odmiana Rio Grande-PtoS pokazane 7 dni po zalaniu zawiesiną PstDC3000 (OD600 = 0.005) + 0.015% surfaktantu. Rio Grande-PtoR wykazuje stałą odporność, a Rio Grande-PtoS stałą podatność na infekcję PstDC3000. Linie te dają dyskretne i binarne fenotypy. (B) Siewki akcesji dzikiej, takiej jak Solanum neorickii LA1329, pokazane 10 dni po zalaniu zawiesiną Pst19 (OD600 = 0.0075) + 0.015% surfaktantu. Siewki wykazują zmienność fenotypową, lecz zostały zarejestrowane jako fenotypy binarne. Stopień zmienności fenotypowej oraz metoda fenotypowania (odporność binarna lub spektrum odporności) będą zależeć od badanej akcesji. (C) Populacje mapujące, wytworzone przez krzyżowanie akcesji dzikich z odmianami podatnymi, mogą wykazywać szersze spektrum fenotypów w segregujących populacjach F2. W takim przypadku najwłaściwsze może być rejestrowanie fenotypów siewek w formie spektrum. Siewki o wysokiej podatności z populacji mapującej mogą zostać sklasyfikowane jako obumarłe już w 7. dniu po zalaniu Pst19 i zazwyczaj wykazują brązowy merystem wierzchołkowy, brak lub minimalny wzrost epikotylu oraz brak nowego, zielonego przyrostu wegetatywnego. Merystem wierzchołkowy podatnych siewek może pozostać zielony lub bardzo jasnobrązowy przez dłuższy czas, a epikotyl może ulec pewnemu wydłużeniu przy minimalnym przyroście wegetatywnym, który brązowieje i zatrzymuje się do 10. dnia. Poszczególne siewki mogą być fenotypowane pod kątem odporności na podstawie ilości nowego i trwającego przyrostu wegetatywnego do 14. dnia. Siewki można następnie pogrupować na podstawie opisanych powyżej fenotypów w różne kategorie odporności, takie jak odporność słaba, średnia lub silna. Kliknij tutaj, aby zobaczyć powiększoną wersję tego rysunku.
Dostęp ograniczony. Zaloguj się lub rozpocznij wersję próbną, aby wyświetlić tę treść.
Wyniki
Wykrywanie odporności zapośredniczonej przez PtoR w odmianach i liniach izogenicznych przy użyciu testu odporności siewek
Rysunek 5 przedstawia reprezentatywne wyniki dla odmian Moneymaker-PtoR i Moneymaker-PtoS od 7 do 10 dni po zalaniu PstDC3000. Przed infekcją 10-dniowe siewki posiadały całkowicie wyłonione i rozwinięte liścienie oraz wyłaniające się pierwsze liście właściwe. Siewki zalano 10 mM MgCl2 + 0,015% surfaktantu...
Dostęp ograniczony. Zaloguj się lub rozpocznij wersję próbną, aby wyświetlić tę treść.
Dyskusja
Opisano protokół inokulacji powodziowej za pomocą PstDC3000 lub Pst19 zoptymalizowany pod kątem wykrywania oporności na te szczepy bakteryjne w siewkach pomidorów. Istnieje kilka parametrów krytycznych dla optymalnych wyników w teście odporności siewek, w tym stężenie bakterii i stężenie środków powierzchniowo czynnych, które zostały określone empirycznie22. W przypadku PstDC3000 gęstość optyczna została zoptymalizowana w celu osiągnięcia całkowitego przeżycia na odporne...
Dostęp ograniczony. Zaloguj się lub rozpocznij wersję próbną, aby wyświetlić tę treść.
Oświadczenia
Autorzy nie mają nic do ujawnienia.
Podziękowania
Dziękujemy Jamiemu Calmie za przetestowanie wpływu ilości mediów na wyniki choroby lub odporności. Dziękujemy dr Maël Baudin i dr Karlowi J. Scheiberowi z Lewis Lab za konstruktywne komentarze i sugestie dotyczące manuskryptu. Badania nad odpornością roślin w laboratorium Lewisa były wspierane przez USDA ARS 2030-21000-046-00D i 2030-21000-050-00D (JDL) oraz Dyrekcję Nauk Biologicznych NSF IOS-1557661 (JDL).
Dostęp ograniczony. Zaloguj się lub rozpocznij wersję próbną, aby wyświetlić tę treść.
Materiały
| Nazwa | Firma | Numer katalogowy | Komentarze |
|---|---|---|---|
| Taśma 3M Micropore 1/2" x 10 YD CS 240 (1,25 cm x 9,1 m) | VWR International | 56222-182 | |
| Koraliki ze szkła borokrzemianowego 3 mm | Friedrich & Dimmock | GB3000B | |
| Bacto peptone | BD | 211677 | |
| Bacto agar | BD | 214010 | |
| Biofotometr Plus | Eppendorf | E952000006 | |
| Szafa bezpieczeństwa biologicznego, klasa II typ A2 | |||
| Jednorazowe kuwety plastikowe, polistyren | VWR International | 47744-642 | |
| Wykałaczki z płaskiego drewna Chenille Kraft | VWR International | 500029-808 | |
| cykloheksymid | Research Products International | C81040-5.0 | |
| Dwuzasadowy fosforan potasu bezwodny, klasa ACS | Fisher Scientific | P288-500 | |
| dimetyloformamidu | |||
| (powiększenie co najmniej 10x) | |||
| Etanol - 190 Proof | |||
| Polistyren Falcon 96-dołkowe mikropłytki, płaskodenne | Fisher Scientific | 08-772-3 | |
| Szklany palnik alkoholowy | Fisher Scientific | S41898A / Nr W-125 | |
| Szklane palniki alkoholowe | Fisher Scientific | S41898 / No. BO125 | |
| Odczynnik ACS do glicerolu | VWR International | EMGX0185-5 | |
| Kimberly-Clark™ Nauka i handel Kimtech; Kimwipes&handel; Wycieraczki do delikatnych zadań | Fisher Scientific | 06-666-A | |
| Chlorek magnezu, klasa ACS | VWR International | 97061-356 | |
| Siarczan magnezu siedmiowodny, klasa ACS | VWR International | 97062-130 | |
| Probówki do mikrowirówek, 1,5 ml | |||
| Probówki do mikrowirówek, 2,2 ml | |||
| Mini Beadbeater-96, 115 V | Bio Spec Products Inc. | 1001 | |
| Murashige & Skoog, Sole podstawowe | Keson, Inc. | MSP01-50LT | |
| Pipet-Lite XLS LTS 8-kanałowa pipeta 20-200uL | Rainin | L8-200XLS | |
| pipeta 2-20uL | Rainin | L8-20XLS | |
| Polistyren 100mm x 25mm sterylna szalka Petriego | VWR International | 89107-632 | |
| Polistyren 150mm x 15mm sterylna szalka Petriego | Fisher Scientific | FB08-757-14 | |
| Polistyren 150x15mm sterylna szalka Petriego | Fisher Scientific | 08-757-148 | |
| Czysty jasny bakteriobójczy ultra wybielacz 5,7% Dostępny chlor (zdefiniowany jako 100% wybielacz) | Zszywki | 1013131 | |
| Rifampicin | Gold Biotechnology | R-120-25 | |
| Silwet L-77 (niejonowy kopolimer surfaktantu organosilikonowego C13H34O4 Si3 środek powierzchniowo czynny) | Fisher Scientific | NCO138454 | |
| Tips LTS 20 μ L 960/10 GPS-L10 | Końcówki do | 17005091 | |
| LTS 250 μ L 960/10 GPS-L250 Kleszcze | Rainin | 17005093 | |
| VWR z cienką końcówką, 4,5" | VWR International | 82027-386 |
Bibliografia
- Underwood, W., Melotto, M., He, S. Y. Role of plant stomata in bacterial invasion. Cell Microbiology. 9 (7), 1621-1629 (2007).
- Zipfel, C. Early molecular events in PAMP-triggered immunity. Current Opinion in Plant Biology. 12 (4), 414-420 (2009).
- Galan, J. E., Wolf-Watz, H. Protein delivery into eukaryotic cells by type III secretion machines. Nature. 444 (7119), 567-573 (2006).
- Lewis, J. D., Desveaux, D., Guttman, D. S. The targeting of plant cellular systems by injected type III effector proteins. Seminars in Cell and Developmental Biology. 20 (9), 1055-1063 (2009).
- Schreiber, K. J., Baudin, M., Hassan, J. A., Lewis, J. D. Die another day: molecular mechanisms of effector-triggered immunity elicited by type III secreted effector proteins. Seminars in Cell and Developmental Biology. 56, 124-133 (2016).
- Heath, M. C. Hypersensitive response-related death. Plant Molecular Biology. 44 (3), 321-334 (2000).
- Boyd, L. A., Ridout, C., O'Sullivan, D. M., Leach, J. E., Leung, H. Plant-pathogen interactions: disease resistance in modern agriculture. Trends in Genetics. 29 (4), 233-240 (2013).
- Pitblado, R. E., MacNeill, B. H. Genetic basis of resistance to Pseudomonas syringae pv. tomato in field tomatoes. Canadian Journal of Plant Pathology. 5 (4), 251-255 (1983).
- Pedley, K. F., Martin, G. B. Molecular basis of Pto-mediated resistance to bacterial speck disease in tomato. Annual Reviews of Phytopathology. 41, 215-243 (2003).
- Ronald, P. C., Salmeron, J. M., Carland, F. M., Mehta, A. Y., Staskawicz, B. J. The cloned avirulence gene AvrPto induces disease resistance in tomato cultivars containing the Pto resistance gene. Journal of Bacteriology. 174 (5), 1604-1611 (1992).
- Martin, G. B., et al. Map-based cloning of a protein kinase gene conferring disease resistance in tomato. Science. 262 (5138), 1432-1436 (1993).
- Salmeron, J. M., Barker, S. J., Carland, F. M., Mehta, A. Y., Staskawicz, B. J. Tomato mutants altered in bacterial disease resistance provide evidence for a new locus controlling pathogen recognition. Plant Cell. 6 (4), 511-520 (1994).
- Salmeron, J. M., et al. Tomato Prf is a member of the leucine-rich repeat class of plant disease resistance genes and lies embedded within the Pto kinase gene cluster. Cell. 86 (1), 123-133 (1996).
- Scofield, S. R., et al. Molecular basis of gene-for-gene specificity in bacterial speck disease of tomato. Science. 274 (5295), 2063-2065 (1996).
- Kunkeaw, S., Tan, S., Coaker, G. Molecular and evolutionary analyses of Pseudomonas syringae pv. tomato race 1. Molecular Plant-Microbe Interactions. 23 (4), 415-424 (2010).
- Cai, R., et al. The plant pathogen Pseudomonas syringae pv. tomato is genetically monomorphic and under strong selection to evade tomato immunity. PLoS Pathogens. 7 (8), 1002130(2011).
- Almeida, N. F., et al. A draft genome sequence of Pseudomonas syringae pv. tomato T1 reveals a type III effector repertoire significantly divergent from that of Pseudomonas syringae pv. tomato DC3000. Molecular Plant-Microbe Interactions. 22 (1), 52-62 (2009).
- Lin, N. C., Abramovitch, R. B., Kim, Y. J., Martin, G. B. Diverse AvrPtoB homologs from several Pseudomonas syringae pathovars elicit Pto-dependent resistance and have similar virulence activities. Applied and Environmental Microbiology. 72 (1), 702-712 (2006).
- Rose, L. E., Langley, C. H., Bernal, A. J., Michelmore, R. W. Natural variation in the Pto pathogen resistance gene within species of wild tomato (Lycopersicon). I. Functional analysis of Pto alleles. Genetics. 171 (1), 345-357 (2005).
- Thapa, S. P., Miyao, E. M., Davis, R. M., Coaker, G. Identification of QTLs controlling resistance to Pseudomonas syringae pv. tomato race 1 strains from the wild tomato Solanum habrochaites LA1777. Theoretical and Applied Genetics. 128 (4), 681-692 (2015).
- Bao, Z. L., et al. Identification of a candidate gene in Solanum habrochaites for resistance to a race 1 strain of Pseudomonas syringae pv. tomato. Plant Genome. 8 (3), 1-15 (2015).
- Hassan, J. A., Zhou, Y. J., Lewis, J. D. A rapid seedling resistance assay identifies wild tomato lines that are resistant to Pseudomonas syringae pv. tomato race 1. Molecular Plant-Microbe Interactions. 30 (9), 701-709 (2017).
- King, E. O., Ward, M. K., Raney, D. E. Two simple media for the demonstration of pyocyanin and fluorescin. Journal of Laboratory and Clinical Medicine. 44 (2), 301-307 (1954).
- Uppalapati, S. R., et al. Pathogenicity of Pseudomonas syringae pv. tomato on tomato seedlings: phenotypic and gene expression analyses of the virulence function of coronatine. Molecular Plant-Microbe Interactions. 21 (4), 383-395 (2008).
- Bhardwaj, V., Meier, S., Petersen, L. N., Ingle, R. A., Roden, L. C. Defence responses of Arabidopsis thaliana to infection by Pseudomonas syringae are regulated by the circadian clock. PLoS One. 6 (10), 26968(2011).
- Lu, H., McClung, C. R., Zhang, C. Tick tock: circadian regulation of plant innate immunity. Annual Review of Phytopathology. 55, 287-311 (2017).
- Wang, W., et al. Timing of plant immune responses by a central circadian regulator. Nature. 470 (7332), 110-114 (2011).
Dostęp ograniczony. Zaloguj się lub rozpocznij wersję próbną, aby wyświetlić tę treść.
Przedruki i uprawnienia
Sprostowanie
Formal Correction: Erratum: High-Throughput Identification of Resistance to Pseudomonas syringae pv. Tomato in Tomato using Seedling Flood Assay
Posted by JoVE Editors on 10/18/2023. Citeable Link.
An erratum was issued for: High-Throughput Identification of Resistance to Pseudomonas syringae pv. Tomato in Tomato using Seedling Flood Assay. The Introduction, Protocol, Representative Results and Discussion sections were updated.
The last paragraph of the Introduction section was updated from:
In the seedling flood assay described in this protocol, tomato seedlings are grown on Petri dishes of sterile Murashige and Skoog (MS) media for 10 days and then are flooded with an inoculum containing the bacteria of interest and a surfactant. Following flooding, seedlings can be quantitatively evaluated for disease resistance via bacterial growth assays. Additionally, seedling survival or death can act as a discrete resistance or disease phenotype 7–14 days after flooding. This approach offers a high-throughput alternative for screening large numbers of wild tomato accessions for resistance to Pst race 1 strains, such as Pst strain T1 (PstT1), and can easily be adapted to other bacterial strains of interest.
to:
In the seedling flood assay described in this protocol, tomato seedlings are grown on Petri dishes of sterile Murashige and Skoog (MS) media for 10 days and then are flooded with an inoculum containing the bacteria of interest and a surfactant. Following flooding, seedlings can be quantitatively evaluated for disease resistance via bacterial growth assays. Additionally, seedling survival or death can act as a discrete resistance or disease phenotype 7–14 days after flooding. This approach offers a high-throughput alternative for screening large numbers of wild tomato accessions for resistance to Pst race 1 strains, such as Pst strain 19 (Pst19), and can easily be adapted to other bacterial strains of interest.
Step 4.8 of the Protocol section was updated from:
- After 1 h, transfer the bottle to the biosafety cabinet and under aseptic conditions, add 1,600 µL of sterile 1 M MgSO4, and appropriate antibiotics to the media.
NOTE: For rifampicin resistant strains PstDC3000 and PstT1, use rifampicin dissolved in dimethylformamide at a final concentration of 50 µg/mL. Use cycloheximide dissolved in ethanol at a final concentration of 50 µg/mL to prevent fungal growth on the plates.
to:
- After 1 h, transfer the bottle to the biosafety cabinet and under aseptic conditions, add 1,600 µL of sterile 1 M MgSO4, and appropriate antibiotics to the media.
NOTE: For rifampicin resistant strains PstDC3000 and Pst19, use rifampicin dissolved in dimethylformamide at a final concentration of 50 µg/mL. Use cycloheximide dissolved in ethanol at a final concentration of 50 µg/mL to prevent fungal growth on the plates.
Step 5.2 of the Protocol section was updated from:
- Patch bacteria (i.e., PstT1) from a glycerol stock onto KB agar with appropriate antibiotics (section 4).
to:
- Patch bacteria (i.e., Pst19) from a glycerol stock onto KB agar with appropriate antibiotics (section 4).
Step 5.6 of the Protocol section was updated from:
- For PstT1, incubate the KB plate at 28 ˚C for 48 h prior to using bacteria in the flood experiment.
to:
- For Pst19, incubate the KB plate at 28 ˚C for 48 h prior to using bacteria in the flood experiment.
Step 6 of the Protocol section was updated from:
6. Preparation of PstT1 inoculum
to
6. Preparation of Pst19 inoculum
Step 6.2 of the Protocol section was updated from:
- Perform serial dilutions using sterile 10 mM MgCl2 solution in the biosafety cabinet. For PstT1, use a spectrophotometer to make inoculum with a starting concentration of OD600 = 0.1.
to:
- Perform serial dilutions using sterile 10 mM MgCl2 solution in the biosafety cabinet. For Pst19, use a spectrophotometer to make inoculum with a starting concentration of OD600 = 0.1.
Step 6.3 of the Protocol section was updated from:
- For PstT1, make a 1/10 dilution from the initial resuspension at OD600 = 0.1 to obtain a serial dilution at a concentration of OD600 = 0.01.
to:
- For Pst19, make a 1/10 dilution from the initial resuspension at OD600 = 0.1 to obtain a serial dilution at a concentration of OD600 = 0.01.
Step 8.3 of the Protocol section was updated from:
- Set a timer for 3 min. Measure 6 mL of final inoculum (PstT1 OD600 = 0.0075 [section 6] or PstDC3000 OD600 = 0.005 [section 7]) and transfer 6 mL of inoculum to each plate with the 10-day-old seedlings.
to:
- Set a timer for 3 min. Measure 6 mL of final inoculum (Pst19 OD600 = 0.0075 [section 6] or PstDC3000 OD600 = 0.005 [section 7]) and transfer 6 mL of inoculum to each plate with the 10-day-old seedlings.
Step 8.11 of the Protocol section was updated from:
- Phenotype after 7–10 days for PstDC3000 or 10–14 days for PstT1 (section 11). If carrying out bacterial growth assays, collect leaf tissue after 4 days (sections 9 and 10) and then phenotype (section 11). Alternatively, perform phenotypic analysis and bacterial growth assays on separate sets of plants.
to:
- Phenotype after 7–10 days for PstDC3000 or 10–14 days for Pst19 (section 11). If carrying out bacterial growth assays, collect leaf tissue after 4 days (sections 9 and 10) and then phenotype (section 11). Alternatively, perform phenotypic analysis and bacterial growth assays on separate sets of plants.
Step 10.7 of the Protocol section was updated from:
- After obtaining colony counts (Figure 2B), normalize the counts to 0.01 g of tissue for seedlings and convert to log bacterial growth (Table 1).
NOTE: The average mass of one Moneymaker-PtoS cotyledon is 0.01 g and is empirically determined22.
| Genotype1 Column A | Tissue Weight (g) Column B | # of Colonies in a spot Column C | Dilution factor for spot2 Column D | Adjusted # of Colonies3 Column E | Dilution factor for serial dilution Column F | Total # of Colonies Column G (cfu/0.01 g)4 | Average # of Colonies (cfu/0.01 g) Column H | Average Log Growth (cfu/0.01 g (log10)) Column I |
| Sample 1 | 0.004 g | 10 | 200 | calculated as: (C2 x 0.01 g) / B2 = 25 | 1000 | calculated as: (D2 x E2 x F2) = 5000000 | average for sample 1 through last sample: (ie. average G1:G3) = 7000000 | log of average ie. log(H2) = 6.85 |
| Sample 2 | 0.003 g | 15 | 200 | 50 | 1000 | 10000000 | ||
| Sample 3 | 0.002 g | 6 | 200 | 30 | 1000 | 6000000 | ||
| 1Data shown for 3 samples | ||||||||
| 2Based on plating 5 µL x 200 for 1 mL | ||||||||
| 3Cotyledons are too small to core so colony counts were normalized to 0.01 g of tissue based on the average mass of one MoneyMaker-PtoS cotyledon (data not shown) | ||||||||
| 4Adjusted per mL based on volume plated | ||||||||
Table 1: Sample calculations for seedling bacterial growth assay. Sample calculations demonstrate how to normalize bacterial counts and determine log bacterial growth.
to:
- After obtaining colony counts (Figure 2B), normalize the counts to 0.1 g of tissue for seedlings and convert to log bacterial growth (Table 1).
NOTE: The average mass of one Moneymaker-PtoS cotyledon is 0.1 g and is empirically determined22.
| Genotype1 Column A | Tissue Weight (g) Column B | # of Colonies in a spot Column C | Dilution factor for spot2 Column D | Adjusted # of Colonies3 Column E | Dilution factor for serial dilution Column F | Total # of Colonies Column G (cfu/0.01 g)4 | Average # of Colonies (cfu/0.01 g) Column H | Average Log Growth (cfu/0.1 g (log10)) Column I |
| Sample 1 | 0.04 g | 10 | 200 | calculated as: (C2 x 0.1 g) / B2 = 25 | 1000 | calculated as: (D2 x E2 x F2) = 5000000 | average for sample 1 through last sample: (ie. average G1:G3) = 7000000 | log of average ie. log(H2) = 6.85 |
| Sample 2 | 0.03 g | 15 | 200 | 50 | 1000 | 10000000 | ||
| Sample 3 | 0.02 g | 6 | 200 | 30 | 1000 | 6000000 | ||
| 1Data shown for 3 samples | ||||||||
| 2Based on plating 5 µL x 200 for 1 mL | ||||||||
| 3Cotyledons are too small to core so colony counts were normalized to 0.1 g of tissue based on the average mass of one MoneyMaker-PtoS cotyledon (data not shown) | ||||||||
| 4Adjusted per mL based on volume plated | ||||||||
Table 1: Sample calculations for seedling bacterial growth assay. Sample calculations demonstrate how to normalize bacterial counts and determine log bacterial growth.
Step 11.3 of the Protocol section was updated from:
- Phenotype plants infected with PstT1 at 10–14 days after flood inoculation.
to:
- Phenotype plants infected with Pst19 at 10–14 days after flood inoculation.
Figure 4 in the Protocol section was updated from:
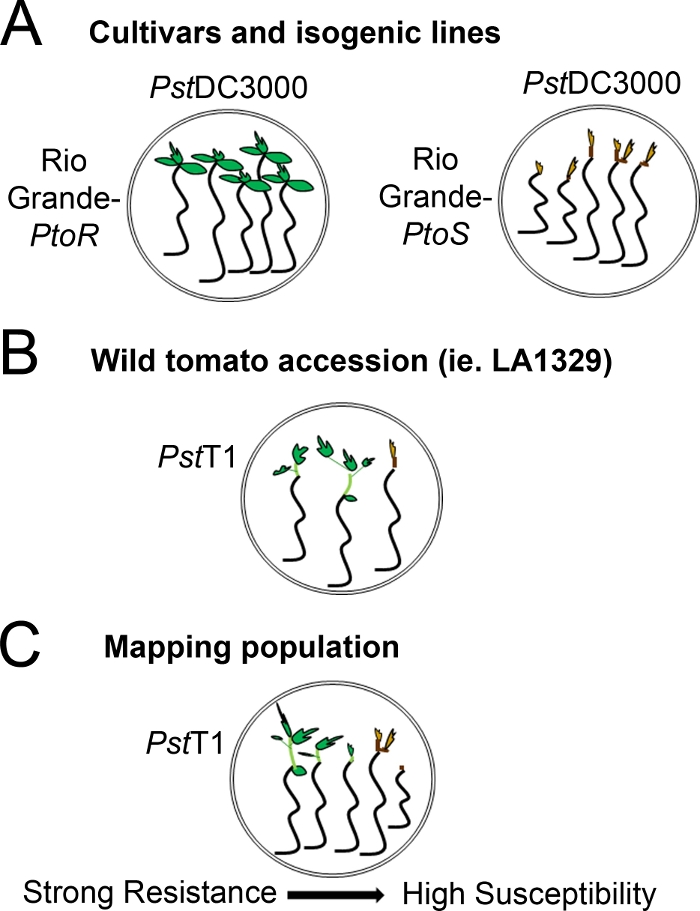
Figure 4: Schematic representation of expected phenotypes for seedling resistance and death in various genetic backgrounds. (A) Seedlings of Rio Grande-PtoR and the near-isogenic cultivar Rio Grande-PtoS are displayed 7 days after flooding with PstDC3000 (OD600 = 0.005) + 0.015% surfactant. Rio Grande-PtoR displays consistent resistance, and Rio Grande-PtoS displays consistent susceptibility to infection with PstDC3000. These lines give rise to discrete and binary phenotypes. (B) Seedlings of a wild accession, such as Solanum neorickii LA1329, are shown 10 days after flooding with PstT1 (OD600 = 0.0075) + 0.015% surfactant. Seedlings display phenotypic variability but were recorded as binary phenotypes. The amount of phenotypic variability and the method of phenotyping (binary resistance or resistance spectrum) will depend on the particular accession tested. (C) Mapping populations generated by outcrossing wild accessions to susceptible cultivars may display a wider spectrum of phenotypes in F2 segregating populations. In this case, it may be most appropriate to record seedling phenotypes on a spectrum. Highly susceptible seedlings from a mapping population may be phenotyped for death as early as day 7 when flooded with PstT1, and typically show a brown apical meristem, no to very little extension of the epicotyl, and no new, green vegetative growth. The apical meristem of susceptible seedlings may stay green or very light brown for more time, and there may be some extension of the epicotyl and very little vegetative growth, which turns brown and arrests by day 10. Individual seedlings can be phenotyped for resistance based on the amount of new and ongoing vegetative growth by day 14. Seedlings can then be grouped based on the phenotypes described above into different categories of resistance such as weak, medium, or strong resistance. Please click here to view a larger version of this figure.
to:
Figure 4: Schematic representation of expected phenotypes for seedling resistance and death in various genetic backgrounds. (A) Seedlings of Rio Grande-PtoR and the near-isogenic cultivar Rio Grande-PtoS are displayed 7 days after flooding with PstDC3000 (OD600 = 0.005) + 0.015% surfactant. Rio Grande-PtoR displays consistent resistance, and Rio Grande-PtoS displays consistent susceptibility to infection with PstDC3000. These lines give rise to discrete and binary phenotypes. (B) Seedlings of a wild accession, such as Solanum neorickii LA1329, are shown 10 days after flooding with Pst19 (OD600 = 0.0075) + 0.015% surfactant. Seedlings display phenotypic variability but were recorded as binary phenotypes. The amount of phenotypic variability and the method of phenotyping (binary resistance or resistance spectrum) will depend on the particular accession tested. (C) Mapping populations generated by outcrossing wild accessions to susceptible cultivars may display a wider spectrum of phenotypes in F2 segregating populations. In this case, it may be most appropriate to record seedling phenotypes on a spectrum. Highly susceptible seedlings from a mapping population may be phenotyped for death as early as day 7 when flooded with Pst19, and typically show a brown apical meristem, no to very little extension of the epicotyl, and no new, green vegetative growth. The apical meristem of susceptible seedlings may stay green or very light brown for more time, and there may be some extension of the epicotyl and very little vegetative growth, which turns brown and arrests by day 10. Individual seedlings can be phenotyped for resistance based on the amount of new and ongoing vegetative growth by day 14. Seedlings can then be grouped based on the phenotypes described above into different categories of resistance such as weak, medium, or strong resistance. Please click here to view a larger version of this figure.
The second paragraph of the Representative Results section was updated from:
Phenotypic screening of wild accessions using the seedling resistance assay
Figure 6 shows representative results for seedlings of susceptible and resistant accessions 10–14 days after flooding with PstT1. Susceptible accessions include RG-PtoR, S. pimpinellifolium LA1375, and S. pimpinellifolium LA1606, and resistant accessions include S. neorickii LA1329. Ten-day-old seedlings were flooded with 10 mM MgCl2 + 0.015% surfactant as a negative control, and PstT1 at an optical density of 0.0075 + 0.015% surfactant. The seedlings were phenotyped at least 10 days after flooding, as PstT1-infected seedlings died more slowly than PstDC3000-infected seedlings. Mock-inoculated seedlings were green, healthy, and actively growing. This control is important to ensure that the accessions are not sensitive to the concentration of surfactant, and to ensure there is no bacterial contamination. Susceptible accessions (Rio Grande-PtoR [n = 7], S. pimpinellifolium LA1375 [n = 7], and S. pimpinellifolium LA1606 [n = 5]) were dead, had brown apical meristems, and lacked new growth 10–14 days after inoculation with PstT1. In contrast, two S. neorickii LA1329 (n = 3) seedlings displayed a high level of new, green growth and survived infection with PstT1 (Figure 6). Three LA1329 seedlings did not germinate. Typically, 5–7 individuals were screened for each accession in a primary screen to determine the prevalence of resistance in the population. When a more genetically complex wild accession, such as LA1329, is flooded with PstT1, the resistance phenotypes display slightly more variability among individual seedlings, compared to Moneymaker-PtoR treated with PstDC3000. However, the resistance phenotypes were usually less variable than those seen in F2 mapping populations. Thus, binary phenotyping criteria was used for LA1329.
to:
Phenotypic screening of wild accessions using the seedling resistance assay
Figure 6 shows representative results for seedlings of susceptible and resistant accessions 10–14 days after flooding with Pst19. Susceptible accessions include RG-PtoR, S. pimpinellifolium LA1375, and S. pimpinellifolium LA1606, and resistant accessions include S. neorickii LA1329. Ten-day-old seedlings were flooded with 10 mM MgCl2 + 0.015% surfactant as a negative control, and Pst19 at an optical density of 0.0075 + 0.015% surfactant. The seedlings were phenotyped at least 10 days after flooding, as Pst19-infected seedlings died more slowly than PstDC3000-infected seedlings. Mock-inoculated seedlings were green, healthy, and actively growing. This control is important to ensure that the accessions are not sensitive to the concentration of surfactant, and to ensure there is no bacterial contamination. Susceptible accessions (Rio Grande-PtoR [n = 7], S. pimpinellifolium LA1375 [n = 7], and S. pimpinellifolium LA1606 [n = 5]) were dead, had brown apical meristems, and lacked new growth 10–14 days after inoculation with Pst19. In contrast, two S. neorickii LA1329 (n = 3) seedlings displayed a high level of new, green growth and survived infection with Pst19 (Figure 6). Three LA1329 seedlings did not germinate. Typically, 5–7 individuals were screened for each accession in a primary screen to determine the prevalence of resistance in the population. When a more genetically complex wild accession, such as LA1329, is flooded with Pst19, the resistance phenotypes display slightly more variability among individual seedlings, compared to Moneymaker-PtoR treated with PstDC3000. However, the resistance phenotypes were usually less variable than those seen in F2 mapping populations. Thus, binary phenotyping criteria was used for LA1329.
Figure 6 in the Representative Results section was updated from:
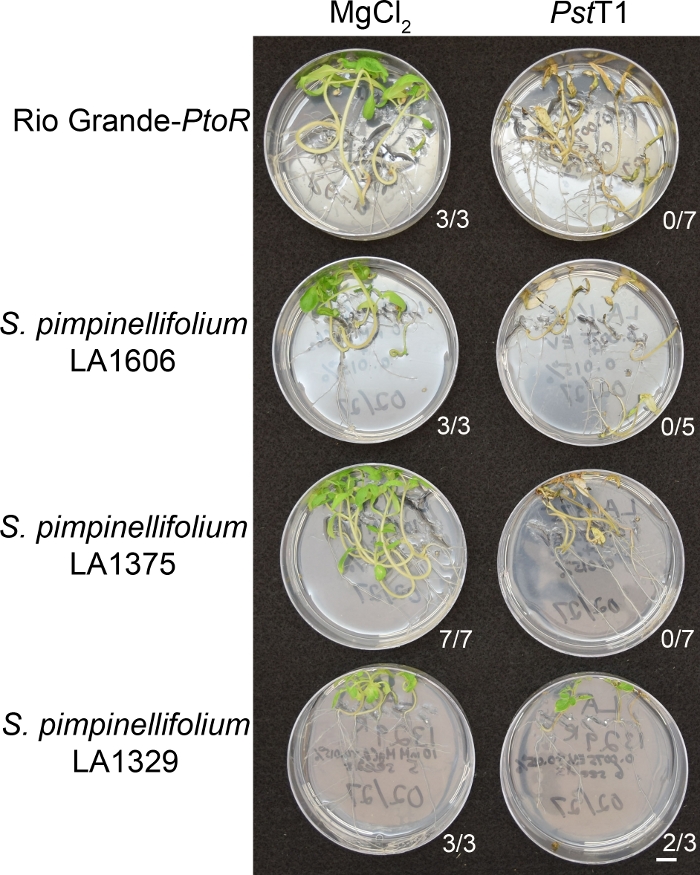
Figure 6: Phenotypic characterization of resistance or disease symptoms 10–14 days post-infection in wild accessions. Rio Grande-PtoR, S. pimpinellifolium LA1606, S. pimpinellifolium LA1375 and S. neorickii LA1329 tomato seedlings were grown on 0.5x MS plates for 10 days, and then flooded with PstT1 (OD600 = 0.0075) + 0.015% surfactant. The number of surviving seedlings for each wild accession out of the total number tested is shown. Scale bar = 1 cm. Please click here to view a larger version of this figure.
to:
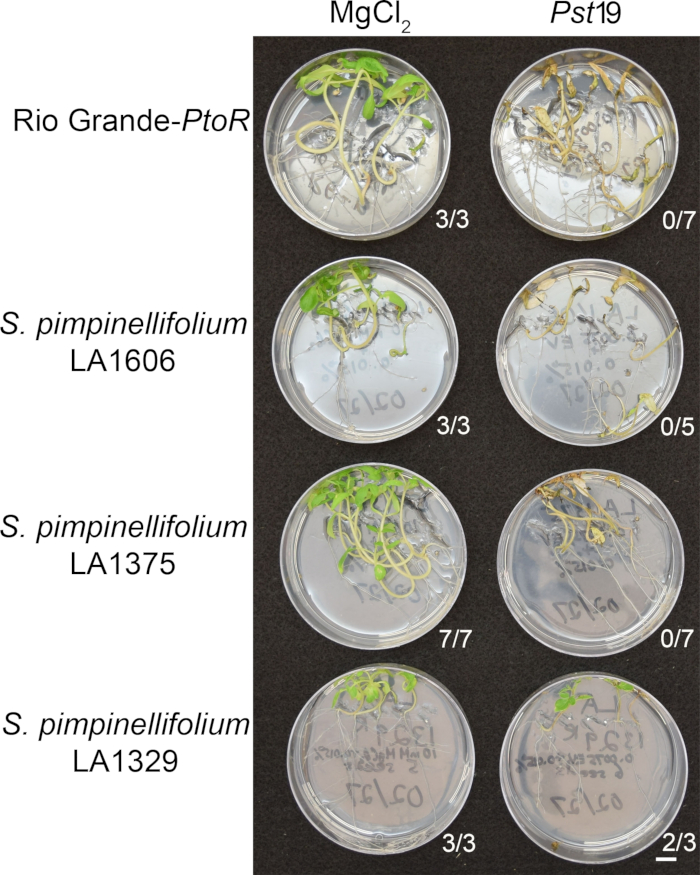
Figure 6: Phenotypic characterization of resistance or disease symptoms 10–14 days post-infection in wild accessions. Rio Grande-PtoR, S. pimpinellifolium LA1606, S. pimpinellifolium LA1375 and S. neorickii LA1329 tomato seedlings were grown on 0.5x MS plates for 10 days, and then flooded with Pst19 (OD600 = 0.0075) + 0.015% surfactant. The number of surviving seedlings for each wild accession out of the total number tested is shown. Scale bar = 1 cm. Please click here to view a larger version of this figure.
The third paragraph of the Representative Results section was updated from:
Quantitative assessment of bacterial growth using the seedling flood assay
To confirm that the observed resistance in LA1329 to PstT1 resulted in lower bacterial growth, bacterial growth assays were carried out in tomato seedlings. The level of PstT1 growth in Moneymaker-PtoS and S. neorickii LA1329 was determined 4 days post-infection. Moneymaker-PtoS is a near-isogenic line with consistent susceptibility among individual seedlings. Wild accessions such as S. neorickii LA1329 are often more genetically complex. LA1329 displays approximately 60% resistance to PstT1 across the population22. Because seedlings may drop their cotyledons after infection, one seedling was grown on each plate to correlate bacterial growth in the harvested cotyledon with overall seedling survival or death as determined phenotypically at least 10 days after flooding. The bacterial counts on day 4 for each seedling were normalized to 0.01 g of tissue and converted to log growth (CFU/0.01 g(log10)). Log growth for phenotypically resistant LA1329 seedlings (LA1329RES) or phenotypically susceptible seedlings (LA1329SUS) were separately pooled and compared to each other and the susceptible cultivar Moneymaker-PtoS. For example, there was a 1.7 log difference in bacterial growth between LA1329RES (log 6.3) and LA1329SUS (log 8.0), and a 1.6 log difference between LA1329RES (log 6.3) and Moneymaker-PtoS (log 7.9) (Figure 7). Therefore, phenotypic resistance correlated with quantitative resistance in the seedling assays.
to:
Quantitative assessment of bacterial growth using the seedling flood assay
To confirm that the observed resistance in LA1329 to Pst19 resulted in lower bacterial growth, bacterial growth assays were carried out in tomato seedlings. The level of Pst19 growth in Moneymaker-PtoS and S. neorickii LA1329 was determined 4 days post-infection. Moneymaker-PtoS is a near-isogenic line with consistent susceptibility among individual seedlings. Wild accessions such as S. neorickii LA1329 are often more genetically complex. LA1329 displays approximately 60% resistance to Pst19 across the population22. Because seedlings may drop their cotyledons after infection, one seedling was grown on each plate to correlate bacterial growth in the harvested cotyledon with overall seedling survival or death as determined phenotypically at least 10 days after flooding. The bacterial counts on day 4 for each seedling were normalized to 0.01 g of tissue and converted to log growth (CFU/0.01 g(log10)). Log growth for phenotypically resistant LA1329 seedlings (LA1329RES) or phenotypically susceptible seedlings (LA1329SUS) were separately pooled and compared to each other and the susceptible cultivar Moneymaker-PtoS. For example, there was a 1.7 log difference in bacterial growth between LA1329RES (log 6.3) and LA1329SUS (log 8.0), and a 1.6 log difference between LA1329RES (log 6.3) and Moneymaker-PtoS (log 7.9) (Figure 7). Therefore, phenotypic resistance correlated with quantitative resistance in the seedling assays.
Figure 7 in the Representative Results section was updated from:
x
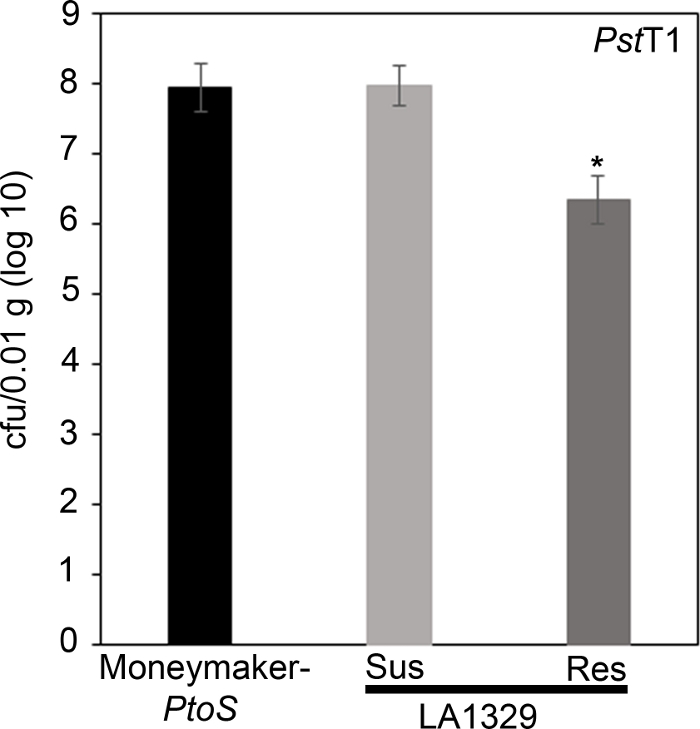
Figure 7: Resistant Solanum neorickii LA1329 seedlings support lower bacterial growth than Moneymaker-PtoS or susceptible S. neorickii LA1329. Bacterial counts were determined 4 days post-inoculation from S. neorickii LA1329 (n = 14) and Moneymaker-PtoS (n = 10) seedlings infected with PstT1 and normalization was performed to 0.01 g of tissue. For LA1329, the two phenotypic groups, susceptible (SUS) or resistant (RES), were observed and counted separately. Above the bar * = statistically significant difference determined by a one-factor analysis of variance. A general linear model procedure (p < 0.001) followed by a multiple comparison of means using Tukey's post hoc test was used. Error bars = standard error. The figure indicates one representative experiment. Please click here to view a larger version of this figure.
x
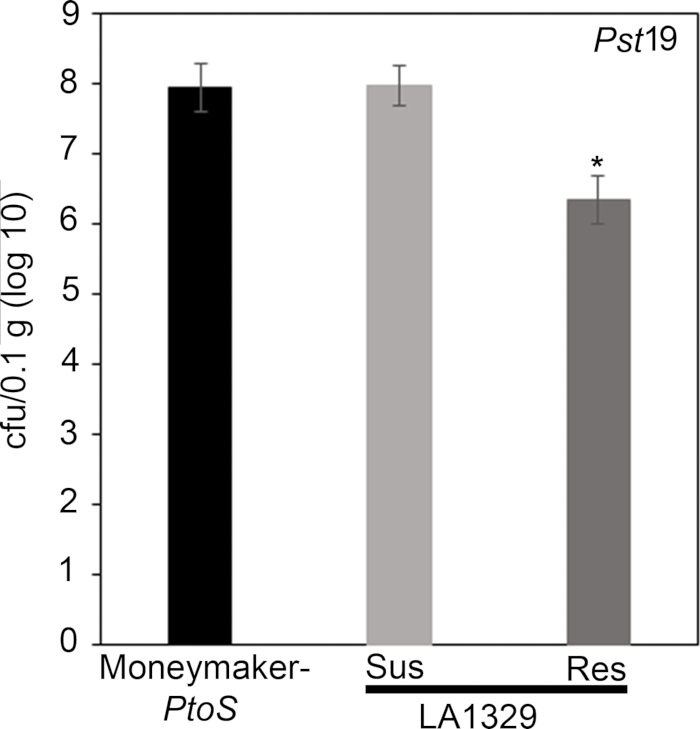
Figure 7: Resistant Solanum neorickii LA1329 seedlings support lower bacterial growth than Moneymaker-PtoS or susceptible S. neorickii LA1329. Bacterial counts were determined 4 days post-inoculation from S. neorickii LA1329 (n = 14) and Moneymaker-PtoS (n = 10) seedlings infected with Pst19 and normalization was performed to 0.1 g of tissue. For LA1329, the two phenotypic groups, susceptible (SUS) or resistant (RES), were observed and counted separately. Above the bar * = statistically significant difference determined by a one-factor analysis of variance. A general linear model procedure (p < 0.001) followed by a multiple comparison of means using Tukey's post hoc test was used. Error bars = standard error. The figure indicates one representative experiment. Please click here to view a larger version of this figure.
The first paragraph of the Discussion section was updated from:
A protocol for flood inoculation with PstDC3000 or PstT1 optimized to detect resistance to these bacterial strains in tomato seedlings is described. There are several critical parameters for optimal results in the seedling resistance assay, including bacterial concentration and surfactant concentration, which were empirically determined22. For PstDC3000, the optical density was optimized to achieve complete survival on a resistant cultivar containing the Pto/Prf cluster and complete death on a susceptible cultivar lacking the Pto/Prf cluster22. For a strain such as PstT1, where there are no known resistant varieties, the optical density was optimized to be the lowest possible for consistent and complete plant death22. Uppalapati et al.24 designed a tomato seedling assay to investigate the pathogenesis of PstDC3000 and the virulence function of coronatine. In this virulence assay, infections were performed using bacteria concentrated to an OD600 of 0.124, 20x higher than the optical density of strains used in our resistance assay. Recognition of PstDC3000 effectors AvrPto and AvrPtoB in tomato seedlings carrying the Pto/Prf gene cluster results in ETI and a macroscopic HR22. In the context of a strong immune response such as ETI, a lower bacterial titer was used for PstDC3000 to avoid overwhelming genetic resistance from the Pto/Prf gene cluster22. In addition, these results suggest that a high bacterial concentration could overwhelm weaker immune responses such as PTI or quantitative partial resistance, where multiple genes contribute to the overall phenotype. Surfactant is necessary for the bacteria to adhere to the leaf surface; however, high concentrations can cause chlorosis of the leaf22. We previously tested a range of surfactant concentrations to empirically determine the ideal concentration in 10-day-old tomato seedlings22. When testing new species that may differ in their sensitivity to surfactant, the surfactant concentration should be optimized to identify a concentration that does not cause damage or chlorosis in the absence of bacteria. Appropriate assay conditions will require optimization of a surfactant concentration that does not cause damage, and a bacterial concentration that causes disease in all susceptible controls.
to:
A protocol for flood inoculation with PstDC3000 or Pst19 optimized to detect resistance to these bacterial strains in tomato seedlings is described. There are several critical parameters for optimal results in the seedling resistance assay, including bacterial concentration and surfactant concentration, which were empirically determined22. For PstDC3000, the optical density was optimized to achieve complete survival on a resistant cultivar containing the Pto/Prf cluster and complete death on a susceptible cultivar lacking the Pto/Prf cluster22. For a strain such as Pst19, where there are no known resistant varieties, the optical density was optimized to be the lowest possible for consistent and complete plant death22. Uppalapati et al.24 designed a tomato seedling assay to investigate the pathogenesis of PstDC3000 and the virulence function of coronatine. In this virulence assay, infections were performed using bacteria concentrated to an OD600 of 0.124, 20x higher than the optical density of strains used in our resistance assay. Recognition of PstDC3000 effectors AvrPto and AvrPtoB in tomato seedlings carrying the Pto/Prf gene cluster results in ETI and a macroscopic HR22. In the context of a strong immune response such as ETI, a lower bacterial titer was used for PstDC3000 to avoid overwhelming genetic resistance from the Pto/Prf gene cluster22. In addition, these results suggest that a high bacterial concentration could overwhelm weaker immune responses such as PTI or quantitative partial resistance, where multiple genes contribute to the overall phenotype. Surfactant is necessary for the bacteria to adhere to the leaf surface; however, high concentrations can cause chlorosis of the leaf22. We previously tested a range of surfactant concentrations to empirically determine the ideal concentration in 10-day-old tomato seedlings22. When testing new species that may differ in their sensitivity to surfactant, the surfactant concentration should be optimized to identify a concentration that does not cause damage or chlorosis in the absence of bacteria. Appropriate assay conditions will require optimization of a surfactant concentration that does not cause damage, and a bacterial concentration that causes disease in all susceptible controls.
The third paragraph of the Discussion section was updated from:
Pst is a foliar pathogen that preferentially colonizes the aerial parts of tomato seedlings, including the cotyledons24 (Figure 3). Therefore, qualitative phenotyping in the seedling flood assay focuses on growth and disease symptoms in aerial portions of the seedling, and tissue for the bacterial growth assay is sampled from the cotyledons for quantitative analysis. After flood inoculation, seedlings may die within 7–10 days after inoculation with PstDC3000 or 10–14 days after inoculation with PstT1, as discussed in section 11. Seedling death is visualized by a brown apical meristem, arrested epicotyl elongation, and/or arrested vegetative growth. If different bacterial strains are used, the timing will have to be empirically determined. In addition, the progression of disease on control plants should be monitored daily after flooding until a consistent time frame from the onset of disease symptoms to seedling death can be identified. Depending on the genotypes and treatments used in the flood assay, seedling phenotypes can be recorded as binary phenotypes or on a disease spectrum (Figure 4). A broader spectrum of phenotypes may be observed when flood inoculating F2 mapping populations from wild tomato accessions crossed to susceptible cultivars (Figure 4C). It may be best to phenotype segregating populations on a disease spectrum depending on how quickly the seedling dies and the degree of new vegetative growth and branching (Figure 4C). The seedling flood assay can also be used in conjunction with the seedling bacterial growth assay to quantitatively assess levels of bacterial growth associated with qualitative phenotypes in individual seedlings (Figure 7). Very large reductions (i.e., ~log 3) in bacterial growth or strong resistance in resistant seedlings of a wild accession compared to a susceptible cultivar suggest that the underlying genetic basis of resistance may be due to ETI22. Smaller reductions in bacterial growth (i.e., ~log 1.7), as observed in LA1329 seedlings, may be due to the contribution of weaker resistance from quantitative trait loci and/or PTI. Thus, the seedling growth assay can be an important tool in further characterizing resistance in wild tomato lines.
to:
Pst is a foliar pathogen that preferentially colonizes the aerial parts of tomato seedlings, including the cotyledons24 (Figure 3). Therefore, qualitative phenotyping in the seedling flood assay focuses on growth and disease symptoms in aerial portions of the seedling, and tissue for the bacterial growth assay is sampled from the cotyledons for quantitative analysis. After flood inoculation, seedlings may die within 7–10 days after inoculation with PstDC3000 or 10–14 days after inoculation with Pst19, as discussed in section 11. Seedling death is visualized by a brown apical meristem, arrested epicotyl elongation, and/or arrested vegetative growth. If different bacterial strains are used, the timing will have to be empirically determined. In addition, the progression of disease on control plants should be monitored daily after flooding until a consistent time frame from the onset of disease symptoms to seedling death can be identified. Depending on the genotypes and treatments used in the flood assay, seedling phenotypes can be recorded as binary phenotypes or on a disease spectrum (Figure 4). A broader spectrum of phenotypes may be observed when flood inoculating F2 mapping populations from wild tomato accessions crossed to susceptible cultivars (Figure 4C). It may be best to phenotype segregating populations on a disease spectrum depending on how quickly the seedling dies and the degree of new vegetative growth and branching (Figure 4C). The seedling flood assay can also be used in conjunction with the seedling bacterial growth assay to quantitatively assess levels of bacterial growth associated with qualitative phenotypes in individual seedlings (Figure 7). Very large reductions (i.e., ~log 3) in bacterial growth or strong resistance in resistant seedlings of a wild accession compared to a susceptible cultivar suggest that the underlying genetic basis of resistance may be due to ETI22. Smaller reductions in bacterial growth (i.e., ~log 1.7), as observed in LA1329 seedlings, may be due to the contribution of weaker resistance from quantitative trait loci and/or PTI. Thus, the seedling growth assay can be an important tool in further characterizing resistance in wild tomato lines.
The fourth paragraph of the Discussion section was updated from:
Typically, genetic screens have been performed on four- to five-week-old adult tomato plants to identify the genetic basis of P. syringae resistance in wild accessions20,21. Adult tomato plants require much longer growth times, require more space in the growth chamber, and are much larger plants, which means that usually few individuals are screened for each line. The seedling flood assay provides a powerful, alternative approach in the identification of P. syringae resistance in wild tomato accessions. Screening at the seedling stage permits a large sample size to be tested which can be particularly advantageous in detecting resistance in genetically complex populations. Reduced growth chamber space requirements and growth time facilitate a high-throughput approach and rapid detection of natural resistance in wild accessions to emerging pathogens. Furthermore, P. syringae resistance that was identified at the seedling stage in this assay is not restricted to the developmental stage. S. neorickii LA1329 and S. habrochaites LA1253 were initially identified at the seedling stage and also display resistance to PstT1 in adult plants as previously described22.
to:
Typically, genetic screens have been performed on four- to five-week-old adult tomato plants to identify the genetic basis of P. syringae resistance in wild accessions20,21. Adult tomato plants require much longer growth times, require more space in the growth chamber, and are much larger plants, which means that usually few individuals are screened for each line. The seedling flood assay provides a powerful, alternative approach in the identification of P. syringae resistance in wild tomato accessions. Screening at the seedling stage permits a large sample size to be tested which can be particularly advantageous in detecting resistance in genetically complex populations. Reduced growth chamber space requirements and growth time facilitate a high-throughput approach and rapid detection of natural resistance in wild accessions to emerging pathogens. Furthermore, P. syringae resistance that was identified at the seedling stage in this assay is not restricted to the developmental stage. S. neorickii LA1329 and S. habrochaites LA1253 were initially identified at the seedling stage and also display resistance to Pst19 in adult plants as previously described22.
Przeglądaj więcej artykułów
