Zstandardyzowany protokół obserwacji fal pociągowych i szczelinowej elastografii został zastosowany przed i po radioczestotliwościowej ablacji guzka tarczycy w celu ilościowego określenia zmian sztywności w kierunku podłużnym. Za pomocą modelowania efektów mieszanych i regresji wielowymiarowej, wczesne zmiany w elastografii po ablacji były niezależnie powiązane z 12-miesięczną odpowiedzią redukcji objętości.
Subskrypcja JoVE jest wymagana do oglądania tego materiału. Zaloguj się lub rozpocznij bezpłatny okres próbny.
Artykuł badawczy
Ocena odpowiedzi na leczenie na podstawie elastografii po ablacji radioczęstotliwościowej guzów tarczycy
W tym artykule
Podsumowanie
Streszczenie
Ablacja radiowa (RFA) jest uznaną minimalnie inwazyjną metodą leczenia łagodnych guzków tarczycy, jednak ocena reakcji opiera się w dużej mierze na opóźnionej redukcji objętości, co ogranicza wczesne podejmowanie decyzji po zabiegu. W tej retrospektywnej kohorcie uczestnicy z pojedynczym wskaźnikowym guzkiem tarczycy przeszli standaryzowane badanie ultrasonograficzne w trybie B i elastografikę w momencie wejścia do badania, natychmiast po ablacji oraz w 1, 3, 6 i 12 miesiącu. Stężenie sprężystości fal pociągowych (SWE) i stosunek odkształceń zostały określone za pomocą predefiniowanych obszarów zainteresowania i kryteriów kontroli jakości. Odpowiedź po 12 miesiącach została zdefiniowana jako wskaźnik redukcji objętości (VRR) ≤ 50%. Zmiany wzdłużne oceniono za pomocą liniowych mieszanych modeli efektów, a natychmiastowe zmiany w elastograffii po RFA (natychmiastowe minus początkowe) były powiązane z 12-miesięcznym VRR przy użyciu korelacji i wielowymiarowej regresji dostosowanej do początkowego objętości guzka, składu guzka, dostarczonej energii i wieku. Wśród 187 uwzględnionych uczestników, 146 było respondentami, a 41 było nie-respondentami. SWE wzrosła natychmiastowo po RFA u respondentów (31,5 ± 5,1 kPa do 41,7 ± 5,6 kPa) i nie-respondentów (35,1 ± 5,3 kPa do 43,4 ± 5,8 kPa), po czym nastąpił progresywny spadek z niższym SWE po 12 miesiącach u respondentów niż u nie-respondentów (21,6 ± 4,7 vs 31,2 ± 5,2 kPa). VRR rozdzielił się wcześnie, z 12-miesięcznym VRR wynoszącym 73,6 ± 6,9% u respondentów versus 38,5 ± 8,7% u nie-respondentów. W mieszanych modelach efektów, natychmiastowy wzrost SWE był istotny (estymacja +10,22 kPa, P < 0,001), a późna dywergencja grup była widoczna (nie-respondent × 12 miesięcy estymacja +9,41 kPa, P < 0,001). Wczesna zmiana w elastograffii korelowała z 12-miesięcznym VRR (Δstosunek odkształceń: r = 0,445, P < 0,001; ΔSWE: r = 0,302, P < 0,001) i pozostała niezależnie związana z VRR w dostosowanych modelach (Δstosunek odkształceń β = 14,80% na +1,0, P < 0,001; ΔSWE β = 1,80% na +5 kPa, P = 0,011). Natychmiastowe zmiany w elastograffii po RFA przechwytują wczesne efekty tkankowe i dostarczają niezależne informacje prognostyczne na temat 12-miesięcznej objętościowej odpowiedzi.
Wprowadzenie
Węzły tarczycy stały się definiującą “chorobą wykrycia” we współczesnej praktyce endokrynologącznej, nie ze względu na nagłą zmianę ich biologii, ale dlatego, że obrazowanie uczyniło tarczycę wyjątkowo widocznych1,2,3. Mierzenie występowania zależy silnie od tego, jak węzły są szukane: klasyczne syntezy epidemiologiczne szacują 2%–6% przez badanie palpacyjne, około 19%–35% przez USG i do około 8%–65% w seriach sekcyjnych, co pokazuje, jak wrażliwość metody kształtuje rzekomą epidemiologię1. W warunkach niedoboru jodu i przy użyciu sond wysokoczęstotliwościowych, badania USG mogą zgłaszać jeszcze wyższe odsetki wykrycia; na przykład badanie populacyjne z wykorzystaniem 13-MHz technologii zidentyfikowało węzły u 68% dorosłych, podkreślając wpływ sprzętu i podstawową podatność tarczycy na zmiany węzłowe przez całe życie2. Chiny dostarczają szczególnie żywej wizji skali, ponieważ USG jest często włączane do badań zdrowia. W krajowym badaniu zdrowia z udziałem 6 985 956 uczestników, ogólna częstość występowania węzłów tarczycy wynosiła 36,9%, z wiekiem i płcią standaryzowaną częstością 38,0% i zauważalną dominacją kobiet3. Nawet gdy większość wykrytych zmian jest klinicznie niezagrożająca, łączne konsekwencje są znaczne, w tym powtarzające się badania obrazowe, kaskady proceduralne, zwiększona czujność objawów i trwała napiętość między uspokojeniem a interwencją. Napiętość ta jest najbardziej ostra w przypadku łagodnych węzłów, które są objawowe, kosmetycznie widoczne lub wyraźnie rosnące, gdzie “łagodny” nie oznacza “nieszkodliwy”, a skuteczność leczenia dla pacjenta często zależy od tego, czy terapia może złagodzić lokalne skutki, zachowując funkcję i unikając morbidytetu chirurgicznego.
W ciągu ostatniej dekady, termiczne ablacja przewodzona USG przeniosła się z niszowego stosowania do coraz bardziej ugruntowanej alternatywy dla chirurgii w przypadku wybranych węzłów tarczycy, szczególnie łagodnych węzłów stałych lub przeważnie stałych i, w starannie dobranych kontekstach, nawracających zmian4,5. Ablacja radioczęstotliwościowa (RFA) stała się flagową techniką, ponieważ łączy wizualizację sonograficzną w czasie rzeczywistym z kontrolowanym dostarczaniem energii i profilem powikłań, który jest korzystny w doświadczonych rękach4,5. Poza oczywistym atutem unikania blizny szyjnej i ogólnego znieczulenia w wielu przypadkach, RFA dostosowuje się do filozofii oszczędzania narządów, w której zmiana jest przekształcana, a rezerwa tarczycy jest zachowana. Współczesne raportowanie wyników zbiegło się do współczynnika redukcji objętości (VRR), często ocenianego po 6 do 12 miesięcy, przy czym sukces leczenia w wielu seriach i analizach zbiorczych definiowany jest za pomocą progów, takich jak co najmniej 50% redukcji objętości po roku6. Jednakże redukcja objętości jest z natury późnym surogatem. Biologiczny efekt ablacji zaczyna się natychmiast z denaturacji białek i martwicą koagulacyjną, a następnie ewoluuje przez stan zapalny, resorpcję i fibrozę przez tygodnie do miesięcy6. W rezultacie, najwcześniejsze klinicznie decydujące pytanie, mianowicie dostarczenie dodatkowych informacji dotyczących wczesnej reakcji tkanki po ablacji, często nie może być z pewnością odpowiedzią jedynie na podstawie wielkości4,6. Przepływ Dopplera i echotekstura szaroskalista dodają przydatny kontekst, ale pozostają pośrednimi mierzeniami transformacji tkanki i mogą być zakłócone we wczesnym okresie po zabiegu przez hiperemię reakcjonalną, obrzęk lub nierównomierne zmiany martwicze. Wczesny, obiektywny sygnał odpowiedniego leczenia mógłby usprawiedliwić intensywność obserwacji, pomóc przewidzieć prawdopodobieństwo opóźnionej reakcji objętości i mógłby pomóc zidentyfikować pacjentów z mniej korzystnymi wzorcami odpowiedzi podłużnej przed miesiącami obserwacji, które konsolidują się w trwałe objawy lub ponowny wzrost2,3.
Elastografia jest przekonująca w tym kontekście, ponieważ mierzy właściwość fizyczną, którą ablacja jest zaprojektowana do zmiany. Elastografia USG, obejmująca techniki oparte na odkształceniu i fali skręcającej, charakteryzuje sztywność tkanki półilościowo poprzez wzorce odkształcenia lub ilościowo poprzez prędkość fali skręcającej i pochodny moduł sprężystości7. W obrazowaniu tarczycy elastografia była szeroko oceniana jako uzupełnienie stratyfikacji ryzyka złośliwości. Jednakże rygorystyczne testowanie zgasiło wczesny entuzjazm dotyczący jej przyrostowej war
Dostęp ograniczony. Zaloguj się lub rozpocznij wersję próbną, aby wyświetlić tę treść.
Protokół
Oświadczenie etyczne
Wszystkie procedury z udziałem osób badanych przeprowadzano zgodnie z wytycznymi instytucjonalnymi Xingtai Hospital oraz zgodnie z zasadami Deklaracji Helsińskiej i jej późniejszymi poprawkami. Badanie zostało przejrzane i zatwierdzone przez Komitet Etyczny ds. Badań nad Człowiekiem w Xingtai Hospital; ponieważ wszyscy uczestnicy udzielili pisemnej zgody na badania kliniczne i ultrasonograficzne jako część rutynowej opieki, komitet zatwierdził badanie z rezygnacją z dodatkowej pisemnej zgody na udział w badaniu i pozwolił na ustną zgodę w przypadku konieczności. poufność uczestników była chroniona poprzez bezpieczne, ograniczające dostęp zarządzanie danymi, ze zdekompleksowalaniem wszystkich danych badawczych przed analizą.
Projekt badania i ogólny schemat
Badanie zostało zaprojektowane jako retrospektywne, jednocentrum klinicznej kohorty w celu oceny oceny opartej na elastografii odpowiedzi na leczenie po przeprowadzonym pod kontrolą ultrasonografii ablacyjnym radiofrekwencyjnym guzów tarczycy. Kolejni kwalifikujący się pacjenci poddający się ablacyjnemu radiofrekwencyjnemu w naszej instytucji byli przesiewani i włączani do badania aż do osiągnięcia wstępnie określonego celu 187 uczestników. Aby zapewnić analityczną niezależność i uniknąć grupowania wewnątrz pacjenta, dołączono tylko jeden guz do badania na osobę, zdefiniowany a priori jako guz wybrany do leczenia podczas sesji ablacyjnej indeksowej. Pacjenci z rozsianymi chorobami tarczycy, które mogłyby znacząco wpłynąć na pomiary sztywności tła tarczycy, w tym rozsiana choroba Hashimoto z zaznaczonym nierównomiernym zajęciem miąższu, nieleczona choroba Gravesa, rozsiana zapalenie tarczycy lub rozsiana wola, byli wykluczeni. Izolowana dodatniość autoprzeciwciał tarczycy bez rozsiadającej się strukturalnej nieprawidłowości tarczycy w badaniu ultrasonograficznym nie była uważana za kryterium wykluczenia.
Badanie przebiegało zgodnie ze standaryzowanym przepływem pracy. Podstawowa ocena kliniczna i badanie obrazowe zostały przeprowadzone w ciągu 2 tygodni przed ablacja i obejmowały konwencjonalne badanie ultrasonograficzne, ocenę Dopplera i pozyskiwanie elastografii zgodnie z wstępnie określonym protokołem. Ablacja radiofrekwencyjna była przeprowadzana pod kontrolą czasu rzeczywistego ultrasonografii zgodnie ze standardami instytucjonalnymi. Natychmiastowe badanie po ablacji było przeprowadzane w ciągu 30 minut od dostarczenia energii w celu udokumentowania powodzenia technicznego i ostrych zmian tkankowych. Zaplanowane wizyty kontrolne były przeprowadzane w 1, 3, 6 i 12 miesiącu po ablacji, z powtórzeniem badania ultrasonograficznego i elastograficznego w każdym punkcie czasowym przy użyciu identycznych ustawień pozyskiwania i strategii pomiarowych w celu zminimalizowania zmienności technicznej.
Obliczenie wielkości próby i założenia statystyczne
Głównym punktem końcowym dla szacowania wielkości próby była zmiana w obrębie guzu w ilościowej elastografii w 1 miesiącu po ablacji w porównaniu z bazą, wyrażona jako różnica średniej sztywności (na przykład moduł sprężystości w kPa) zmierzona przy użyciu standaryzowanej strategii regionu zainteresowania. Ponieważ główna analiza porównuje sparowane pomiary w tym samym guzie, wielkość próby została oszacowana przy użyciu ram dla różnicy średniej sparowanej. Niech Δ oznacza oczekiwaną średnią zmianę sztywności od bazy do 1 miesiąca, a niech σd oznacza odchylenie standardowe sparowanych różnic. Dla dwustronnego testu na poziomie istotności α z mocą 1−β, wymagana wielkość próby to:
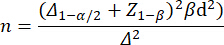
Przy użyciu α = 0,05 (dwustronnie) i mocy 1−β = 0,80, Z1−α/2 = 1,96 i Z1−β = 0,84. Na podstawie pomiarów pilotażowych i opublikowanych wahaczy po ablacyjnych w elastografii tarczycy, to badanie zakładało βd = 35 kPa i konserwatywną klinicznie istotną zmianę Δ = 8 kPa. Daje to minimalną wymaganą wielkość próby co najmniej 150 uczestników dla głównej sparowanej analizy pochodnej sztywności elastograficznej przed i po RFA.
Podstawowa ocena kliniczna przed ablacja
Podczas rejestracji, uzyskano standaryzowaną historię kliniczną ze szczególnym naciskiem na objawy związane z guzem i czynniki istotne dla bezpieczeństwa procedury. Wiek, płeć, miary antropometryczne i istotne choroby współistniejące, w tym choroby układu krążenia i układu oddechowego, cukrzyca, przewlekła choroba nerek oraz wcześniejsze operacje szyi lub napromienianie, zostały nagrane. Dokumentowano bieżące leki, zwłaszcza zwracając uwagę na leki przeciwpłytkowe i antykoagulanty, i nagrano wszelkie planowane zmiany zgodnie z polityką instytucjonalną. Potwierdzono wskazanie do RFA, określając, czy głównym czynnikiem były objawy kompresyjne, obawa kosmetyczna, udokumentowane
Dostęp ograniczony. Zaloguj się lub rozpocznij wersję próbną, aby wyświetlić tę treść.
Wyniki
Study design and overall schematic
The excluded participants did not meet predefined eligibility criteria, had incomplete baseline imaging data, or lacked standardized longitudinal follow-up. Among the 187 included participants, complete 12-month outcome classification was available for all cases included in the primary analysis, although isolated intermittent missing observations at individual follow-up visits were accommodated within the mixed-effects modeling framework (Rysu...
Dostęp ograniczony. Zaloguj się lub rozpocznij wersję próbną, aby wyświetlić tę treść.
Dyskusja
Niniejsze badanie oceniło podejście oparte na elastografii do oceny odpowiedzi na leczenie po radioablacju częstotliwością wysoką guzów tarczycy, wykorzystując elastografię jako ilościowy biomarker obrazowania związany ze zmianami sztywności po ablacji. Główną propozycją jest to, że sztywność, mierzona przez SWE i elastografię deformacyjną, może służyć jako wczesny wskaźnik efektu ablacji i jako marker przebiegu czasowego zmian po ablacji, uzupełniając konwencjonalne wskaźniki oparte na objętości. Wyniki badania potwierd...
Dostęp ograniczony. Zaloguj się lub rozpocznij wersję próbną, aby wyświetlić tę treść.
Oświadczenia
Autorzy deklarują brak konfliktu interesów.
Podziękowania
Autorzy są wdzięczni Zakładowi Endokrynologii za pomoc w ocenie klinicznej, koordynację dalszej opieki i ocenie funkcji tarczycy. Wyraźna wdzięczność jest również kierowania do zespołu Radiologii Interwencyjnej za wsparcie proceduralne i opiekę nad pacjentem wokół zabiegu oraz do Zakładu Patomorfologii za przegląd cytologiczny i wskazówki diagnostyczne, gdy to ma zastosowanie. Wkład personelu pielęgniarskiego, koordynatorów kliniki ambulatoryjnej oraz uczestników badania jest szczerze doceniony.
Dostęp ograniczony. Zaloguj się lub rozpocznij wersję próbną, aby wyświetlić tę treść.
Materiały
| Nazwa | Firma | Numer katalogowy | Komentarze |
|---|---|---|---|
| 3M Tegaderm Film Dressing | Tegaderm | https://www.3m.com/3M/en_US/p/c/medical/bandages-dressings/film/i/health-care/medical/ | Opatrunek adhezywny; Pokrycie miejsca po zabiegu. |
| Disposable syringe | Becton Dickinson | BD 309628 | Hydrodyssekcja i podawanie znieczulenia miejscowego |
| Grounding pads for RFA | 3M Healthcare | Model 9547 | Jednorazowe elektrody zwrotne kompatybilne z RF. |
| High-frequency linear-array transducer (5–14 MHz) | SuperSonic Imagine | SL15-4 linear probe | Ultradźwiękowe badanie tarczycy i pozyskiwanie elastografu |
| High-frequency linear-array ultrasound transducer (7–15 MHz) | Mindray | L11-3U | Sonda liniowa zoptymalizowana pod kątem obrazowania i elastografu tarczycy. |
| IntelliVue | Philips Healthcare | MX450 | System monitorowania pacjenta; EKG, SpO2, nieinwazyjny monitor ciśnienia krwi podczas RFA. |
| IntelliVue | Philips Healthcare | MP50 | Monitor znaków życiowych; Ciągłe monitorowanie w trakcie zabiegu |
| Lidocaine hydrochloride injection | Hospira Inc. | NDC 0409-4276-17 | Znieczulenie miejscowe przed ablacja |
| lme4 package | CRAN | RRID:SCR_015654 | Modelowanie liniowych efektów mieszanych w R. |
| lmerTest package | CRAN | RRID:SCR_015656 | Testowanie modelu mieszanego i wartości p w R. |
| Microflex Powder-Free Gloves | Ansell Healthcare | Aseptyczna bariera dla zespołu proceduralnego. | |
| Non-sterile ultrasound gel | EcoGel | Środek sprzęgający do badań początkowych i kontrolnych. | |
| Picture Archiving and Communication System (PACS) | GE Healthcare | Centricity PACS | System przechowywania i pobierania obrazów na poziomie korporacyjnym. |
| Povidone-Iodine 10% | Betadine | Antyseptyk przed zabiegiem. | |
| Precision Workstation | Dell | T5820 | Do przeglądania obrazów i analizy danych. |
| PrecisionGlide 22G–27G | BD (Becton Dickinson) | https://www.bd.com/en-us/products-and-solutions/products | Zestaw igieł do znieczulenia miejscowego/hydrodyssekcji. |
| Premixed Saline Bag 500 mL (0.9% NaCl) | Baxter Healthcare | Płyn do hydrodyssekcji i płukania. | |
| R statistical computing software | R Foundation | RRID:SCR_001905 | Środowisko analizy statystycznej. |
| RFA percutaneous cooled electrode | STARmed Co., Ltd. | Star RF Electrode 18-10s10F | Aktywna elektroda RFA do ablacji tarczycy (TaeWoong Medical USA) |
| RStudio integrated development environment | Posit (formerly RStudio) | RRID:SCR_000432 | Środowisko programistyczne IDE dla analiz statystycznych w R. |
| Shear-wave elastography software module | Mindray | SWE Module (RESONA Series) | Ilościowa mapa sztywności w kPa w systemie US. |
| Sterile drape kit | Medline Industries | DYNJP2500 | Sterylne przygotowanie do zabiegu RFA tarczycy |
| Sterile gauze and swabs | Covidien | Sterile Sponge Kit | Używane do przygotowania skóry i hemostazy. |
| Sterile normal saline | Baxter Healthcare | 2B1324X | Hydrodyssekcja podczas zabiegu RFA tarczycy |
| Sterile procedure drapes (Blue Drape Pack) | Medline Industries | Standardowa poszewka do sterylnego zabiegu RFA. | |
| Sterile ultrasound gel | Aquasonic 100 | Conductive Gel 100 mL | Sterylny środek sprzęgający do obrazowania US. |
| Sterile ultrasound probe cover | Parker Laboratories | Model 1001 | Sterylny pokrowiec do obrazowania podczas zabiegu. |
| Strain elastography software module | Mindray | SE Module (RESONA Series) | Obliczanie współczynnika odkształcenia ze zintegrowanym wskaźnikiem jakości. |
| Syringes (5/10/20 mL) | BD (Becton Dickinson) | Monoject Syringes | Do podawania znieczulenia i hydrodyssekcji. |
| Three-way stopcock | BD (Becton Dickinson) | Model 305129 | Kranik trójstronny i przewód do kontrolowanego zarządzania płynami. |
| Thyroid RF Electrode | STARmed Co., Ltd. | https://en.starmed4u.com/ | Wewnętrznie chłodzona elektroda RF; Ablacja radiowa guzków tarczycy |
| Ultrasound coupling gel | Parker Laboratories | Aquasonic 100 | Ultradźwięki i pozyskiwanie elastografu |
| Ultrasound imaging system with elastography capability | SuperSonic Imagine | Aixplorer | Stosowany do obrazowania ultradźwiękowego w trybie B, obrazowania Dopplera, SWE i elastografu naprężeniowego |
| VIVA Combo RF Generator | STARmed Co., Ltd. | Generrator RF do punktowej ablacji tarczycy (TaeWoong Medical USA) | |
| VIVA RF Generator | STARmed Co., Ltd. | Ablacja radiowa tarczycy przeprowadzana pod kontrolą US | |
| Xylocaine 1% 10 mL | AstraZeneca | Znieczulenie miejscowe (lidokaina) do znieczulenia zabiegowego. |