Niniejsze badanie szczegółowo opisuje powtarzalny proces wyodrębniania cech behawioralnych oraz wdrażania dynamicznie dostosowanych ścieżek edukacyjnych w środowiskach wirtualnych. Opisane procedury pozwalają nauczycielom na opracowywanie adaptacyjnych programów nauczania w rzeczywistości wirtualnej oraz wdrażanie śledzenia behawioralnego w czasie rzeczywistym.
Subskrypcja JoVE jest wymagana do oglądania tego materiału. Zaloguj się lub rozpocznij bezpłatny okres próbny.
Artykuł badawczy
Metody inteligentnego nauczania integrujące rzeczywistość wirtualną i algorytmy dużych danych w celu ulepszenia tradycyjnych platform edukacji kulturalnej
W tym artykule
Podsumowanie
Streszczenie
Obecnie konwencjonalne środowiska dydaktyczne mają ograniczone elementy interaktywne, co skutkuje ograniczonymi wskaźnikami zaangażowania wśród populacji studentów studiujących dziedzictwo kulturowe. Aby rozwiązać te problemy, opracowano inteligentną platformę dydaktyczną, integrującą silnik renderowania przestrzennego o wysokiej wierności z środowiskami wirtualnej rzeczywistości z wielomodelową architekturą algorytmiczną. W ramach tej platformy modele Transformer i Neural Collaborative Filtering (NCF) przetwarzają dane behawioralne, aby generować spersonalizowane ścieżki uczenia się, podczas gdy sieć Deep Q-Network (DQN) dynamicznie dostosowuje trudność treści na podstawie opinii w czasie rzeczywistym. Takie adaptacyjne wspomaganie odzwierciedla zasady konstruktywistycznego uczenia się, w którym wiedza jest aktywnie konstruowana poprzez interakcję z kontekstualnymi, responsywnymi środowiskami, a nie pasywnie przyjmowana poprzez statyczną instrukcję. Nowość tej badania polega na integracji silnika renderowania przestrzennego z wielomodelową architekturą algorytmiczną w celu ustanowienia mechanizmu adaptacji behawioralnej w czasie rzeczywistym. Wyniki eksperymentu pokazują, że grupa eksperymentalna korzystająca z zaproponowanej inteligentnej platformy dydaktycznej ma wyższe wyniki w nauce (w grupach niskiej/średniej/wysokiej odpowiednio 69/79/93 punktów) i wyższy wskaźnik zakończenia zadań edukacyjnych (93%/96%/98%) niż grupa kontrolna używająca tradycyjnego modelu nauczania. Projekt inteligentnej platformy dydaktycznej oferuje silną interaktywność, zapewnia spersonalizowane ścieżki uczenia się dla studentów o różnych indywidualnych różnicach i dynamicznie dostosowuje się podczas procesu uczenia się. Analiza czasu reakcji wskazuje na średnią opóźnienie 0,496 s, zapewniając szybki feedback na interakcje. Ostatecznie, zaproponowana platforma pokazuje, że łączenie immersyjnej VR z algorytmami adaptacyjnymi do zachowania skutecznie poprawia zarówno osiągnięcia akademickie, jak i zaangażowanie w zadania dla studentów w tradycyjnej edukacji kulturowej.
Wprowadzenie
Tradycyjna edukacja kulturowa odgrywa istotną rolę w dziedziczeniu i rozwoju kultury. Jednak obecny model edukacji kulturowej opiera się głównie na statycznych formach, takich jak podręczniki, obrazki i filmy, brakując interaktywności i immersji, co utrudnia studentom prawdziwe zrozumienie i doświadczenie uroku kultury. Ponadto, tradycyjne metody nauczania często stosują jednolity program nauczania, który nie uwzględnia pełnej różnorodności zainteresowań, zdolności poznawczych i stylów uczenia się uczniów, co prowadzi do niskiej efektywności uczenia się i trudności w stymulowaniu entuzjazmu uczniów do nauki. Ta ograniczona metoda pasuje do teorii Strefy Najbliższego Rozwoju (ZPD) Vygotskiego, która podkreśla, że efektywne nauczanie musi być dostosowane do bieżącego poziomu kognitywnego uczniów i wspierane zgodnie z ich indywidualnymi trajektoriami rozwojowymi. Istniejąca literatura opiera się na statycznych danych wejściowych do modelowania pedagogicznego. Integracja ciągłego śledzenia zachowań przestrzennych z głębokim uczeniem wzmacniającym pozostaje niezbadana. Proponowany mechanizm łączy wielosensoryczne interakcje z algorytmicznym dostosowaniem, aby zapewnić most między stałymi ścieżkami instruktażowymi a dynamiczną adaptacją kontekstową. Proponowana platforma operacjonalizuje tę zasadę poprzez dynamiczne dostosowywanie trudności treści i sekwencjonowania na podstawie wskaźników zachowań w czasie rzeczywistym, w ten sposób wbudowując teorię pedagogiczną w projekt algorytmiczny. Mechanizmy adaptacji algorytmicznej skutecznie zastępują ludzkie wsparcie, które zazwyczaj dostarczają bardziej zdolni rówieśnicy. Ta ciągła modulacja trudności zadań pasuje do Teorii Obciążenia Kognitywnego (CLT), zapobiegając przeciążeniu kognitywnemu uczniów początkujących i utrzymując zaangażowanie w optymalnej strefie rozwojowej.
Z rozwojem wirtualnej rzeczywistości (VR) i algorytmów danych, zastosowanie ich do tradycyjnej edukacji kulturowej zapewnia studentom bardziej immersyjne i interaktywne doświadczenie edukacyjne1,2,3,4. Kompleksowe systematyczne przeglądy aplikacji immersyjnej wirtualnej rzeczywistości w szkolnictwie wyższym podkreślają znaczenie dostosowywania elementów projektowych do określonych celów pedagogicznych5.
Wiele badań próbowało zastosować technologię VR do edukacji kulturowej. Hulusic i in.6 zaprojektowali i stworzyli wirtualne muzeum szkolne, w tym namacalny interfejs użytkownika. Poprzez badania uczestniczące, stwierdzono, że muzeum jest dobrze zaprojektowane i zaawansowane, i ma potencjał do wykorzystania jako narzędzie edukacyjne w muzeach, szkołach lub niezależnie. W odpowiedzi na problem niewystarczającej interaktywności w środowiskach edukacji zdalnej, Mubarok i in.7 opracowali metodę kolaboratywnego mapowania argumentów opartą na VR, aby ją rozwiązać. Eksperymenty wykazały, że ta metoda lepiej poprawia ustną ekspresję języka angielskiego uczniów niż metody kolaboratywnego mapowania argumentów nie opartych na VR. Sun i in.8 zaproponowali strategię projektowania systemu VR, który łączy multimodalne interakcje, gamifikacje i narracje, aby wyświetlać i rozwijać cyfrowy dziedzictwo kulturowe. Stworzyli immersyjny system VR, który odtworzył malowidła ścienne z Dunhuang, zapewniając użytkownikom doświadczenie edukacyjne, interaktywne i rozrywkowe. Jednak te badania nadal napotykają na pewne problemy, takie jak słaba interaktywność w scenach VR, wolne tempo aktualizacji treści edukacyjnych i słaba przystosowność algorytmów rekomendacji personalizowanych, które uniemożliwiają dokładne zaspokojenie potrzeb edukacyjnych różnych uczniów. Ponadto niektóre badania nie udało się skutecznie zintegrować głębokiego uczenia i uczenia wzmacniającego, co ogranicza możliwości rzeczywistego czasu dostosowywania rekomendacji personalizowanych.
Ostatnie osiągnięcia w sztucznej inteligencji napędzają technologie edukacyjne. Badania wprowadzają adaptacyjne systemy wykorzystujące głębokie uczenie do rozpoznawania wzorców w zachowaniach użytkowników. Metodologie zawierające algorytmy śledzenia kognitywnego mapują dynamiczne stany nabywania wiedzy. Optymalizacja strukturalna w sieciach neuronowych podnosi precyzję rekomendacji w inteligentnych ramach edukacyjnych. Inteligentne agenty integrujące złożone zmienne środowiskowe zwiększają automatyczne odpowiedzi instruktażowe. Te metodologie opierają się na izolowanych strumieniach danych i statycznej analizie historycznej. Proponowana platforma radzi sobie z tą ograniczeniem, łącząc dane interakcji przestrzennych z ciągłym algorytmicznym dostosowaniem, aby zapewnić adaptację kontekstową w czasie rzeczywistym.
Ostatnie empiryczne badania potwierdzają, że algorytmy głębokiego uczenia znacząco poprawiają dokładność przewidywania w modelowaniu wydajności studentów. Ouatik i in.9 wdrożyli system przewidujący sukces i porażkę akademicką studentów. Wykorzystali informacje osobiste studentów, oceny akademickie i inne dane, a także metody sztucznej inteligencji i wydobywania danych edukacyjnych, aby przewidywać sukces akademicki studentów. Aby rozwiązać problem przetwarzania danych, zastosowano technologię big data
Dostęp ograniczony. Zaloguj się lub rozpocznij wersję próbną, aby wyświetlić tę treść.
Protokół
Instytucjonalna komisja etyki Uniwersytetu Handlu i Komercji w Shaanxi zatwierdziła protokół badawczy pod numerem referencyjnym 2025-04A. Przed rozpoczęciem procedur od wszystkich uczestników uzyskano udokumentowaną świadomą zgodę, zapewniając, że wszyscy badani byli świadomi protokołów śledzenia behawioralnego i anonimizacji danych. (Uwaga: Uzasadnienia pedagogiczne dotyczące algorytmów zostały przeniesione do sekcji Dyskusja w celu zachowania zwięzłości operacyjnej).
Krok 1: Konstrukcja sceny w rzeczywistości wirtualnej
Integracja zasobów
Modelowanie cyfrowe elementów kulturowych wykonano przy użyciu ogólnego oprogramowania do modelowania 3D (patrz Tabela materiałów w celu sprawdzenia konkretnego zastosowanego oprogramowania), aby stworzyć immersyjne środowiska uczenia się12,13. Wygenerowano zasoby cyfrowe, przypisano tekstury renderowania opartego na fizyce, a następnie zaimportowano je do wysokiej jakości silnika renderowania przestrzennego (Tabela materiałów) bez zastosowania technik obrazowania mikroskopowego14,15.
Konfiguracja renderowania i fizyki
W silniku renderującym włączono technologię sprzętowego ray tracingu w celu optymalizacji dynamicznego oświetlenia16,17:
 (1)
(1)
P oznacza natężenie światła w scenie. L oznacza położenie źródła światła. IL oznacza natężenie źródła światła, a N reprezentuje wektor normalny powierzchni obiektu wirtualnego.
Silnik fizyczny symulował dynamikę obiektów za pomocą interfejsu programowania obiektowego (C++). Wykorzystany wzór reakcji miał następującą postać:
 (2)
(2)
F oznacza dynamiczną siłę reakcji, m to masa obiektu wirtualnego, v oznacza jego prędkość, a t oznacza czas.
Aby zapewnić płynność działania, do optymalizacji sceny wykorzystano technologię poziomu szczegółowości (LOD), która zredukowała zbędne obliczenia i zwiększyła wydajność renderowania poprzez dynamiczne dostosowywanie poziomu szczegółowości modelu18,19. Do przetwarzania obrazów zastosowano akcelerację GPU:
 (3)
(3)
R oznacza współczynnik odbicia, M oznacza mapę powierzchni, a C oznacza końcowy wyrenderowany kolor.
Implementacja interakcji
Interakcje użytkownika zostały skonfigurowane przy użyciu natywnego wizualnego interfejsu skryptowego opartego na węzłach, zintegrowanego z silnikiem renderowania przestrzennego. Dzięki zastosowaniu technologii dźwięku przestrzennego zasymulowano dźwięk w przestrzeni, aby studenci mogli słyszeć różne efekty dźwiękowe w zależności od położenia. Ponadto, dzięki technologii haptycznej, studenci mogli otrzymywać fizyczne odpowiedzi odpowiadające dotykowi w scenie wirtualnej20:
 (4)
(4)
Ft oznacza siłę informacji zwrotnej dotykowej, a k oznacza współczynnik sztywności.
Przegląd wdrożenia i sprzętu
Środowisko zostało opracowane na dedykowanym zestawie sprzętowym do obliczeń przestrzennych, wyposażonym w dwudziestoczterordzeniową jednostkę centralną, 64 GB pamięci RAM oraz dedykowaną jednostkę przetwarzania grafiki o pojemności 24 GB. Sceny wirtualne zostały wdrożone na standardowych wyświetlaczach do immersyjnej wizualizacji przestrzennej, zgodnie ze szczegółami zawartymi w Tabeli materiałów, o rozdzielczości 140 x 160 pikseli na oko i częstotliwości odświeżania 90 Hz, co zapewniło optymalną stabilność obrazu i zminimalizowało opóźnienie typu motion-to-photon. Granice przestrzenne skonfigurowano tak, aby ograniczyć sesje do 45 min w celu złagodzenia choroby lokomocyjnej wywołanej bodźcami wizualnymi.
Tabela materiałów podsumowuje zastosowane konkretne technologie. Wszystkie wskazane komponenty sprzętowe i obliczeniowe były standardowym wyposażeniem dostępnym w handlu i nie opierały się na żadnym pojedynczym dostawcy zastrzeżonym. Silnik renderowania przestrzennego oraz ray tracing zapewniły dynamiczne oświetlenie, natomiast oprogramowanie do modelowania 3D odwzorowało obiekty historyczne. Rysunek 1 przedstawia przykład wirtualnej sceny edukacyjnej, z wyszczególnieniem modułowego panelu sterowania do powiększenia obrazu, modulacji dźwięku oraz ruchu.
Punkt kontrolny 1: W pełni wyrenderowane środowisko VR działające przy stabilnej częstotliwości odświeżania 90 Hz, minimalizujące opóźnienie ruchu do fotonu (motion-to-photon latency) w celu zapewnienia stabilności obrazu.
Krok 2: Ekstrakcja danych behawioralnych (Transformer)
Rejestrowanie danych
Dane dotyczące zachowań edukacyjnych uczniów obejmowały interakcje ze scenami VR, w tym liczbę kliknięć, czas poświęcony na naukę, postępy w nauce oraz stopień realizacji zadań. Tabela 1 przedstawia dane dotyczące aktywności edukacyjnej uczniów w różnych scenariuszach VR. W przypadku tych interaktywnych informacji w platformie zastosowano reprezentację szeregów czasowych:
 (5)
(5)
sτ reprezentuje zachowanie studenta w czasie t, a T to całkowita długość czasu. Każde zachowanie tworzy wielowymiarowy wektor:
![Równanie równowagi statycznej, \( s_t = [f_1, f_2, ..., f_d] \), wzór do analizy równowagi.](/files/ftp_upload/71641/71641eq21.jpg "figure-protocol-6") (6)
(6)
fi reprezentuje konkretną wartość cechy w wymiarze i, a d oznacza całkowitą liczbę wymiarów cech.
Modelowanie sekwencji
Do modelowania szeregów czasowych wykorzystano model Transformer21,2. Dzięki zastosowaniu mechanizmu self-attention wyekstrahowano cechy behawioralne poprzez obliczenie korelacji między zachowaniami uczniów. Przyjmując, że macierz osadzania sekwencji danych o zachowaniu ucznia to X, macierze zapytania (Q), klucza (K) oraz wartości (V) zostały wygenerowane poprzez mnożenie przez trenowalne macierze wag WQ, WK oraz WV:
 (7)
(7)
Obliczanie uwagi
Mechanizm self-attention w modelu Transformer obliczono następująco23,24:
 (8)
(8)
Wśród nich dk reprezentuje wymiar wektorów kluczy, który został wykorzystany jako czynnik skalujący w celu zapobiegania zanikaniu gradientów. Po obliczeniu wzoru (8), wyznaczono wagę uwagi, aby zmierzyć korelację między zachowaniami uczenia:
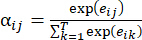 (9)
(9)
eij reprezentuje surową wartość energii uwagi pomiędzy zachowaniami uczenia się. Ważona suma tych wag została wykorzystana do uzyskania wektora kontekstowego w aktualnym momencie, który stanowi potencjalny wektor cech studenta:
 (10)
(10)
Punkt kontrolny 2: Model Transformer generuje ciągłe wektory cech latentnych (ct). Na wydzielonym zbiorze walidacyjnym składającym się z 500 logów interakcji, model osiągnął dokładność przewidywania sekwencji na poziomie 89,4%, przy czym strata entropii krzyżowej zbiegła do poziomu 0,12 po 50 epokach.
Krok 3: Generowanie spersonalizowanej ścieżki uczenia się (NCF)
Fuzja cech
Model NCF został zaimplementowany w celu zbadania potencjalnych zainteresowań i potrzeb uczniów oraz wygenerowania spersonalizowanych ścieżek uczenia się25,26,27,28. W modelu NCF każdemu punktowi wiedzy kulturalnej przypisano wektor cech vk , a następnie wektor cech potencjalnych vu wyekstrahowany przez Transformer oraz wektor punktu wiedzy vk zostały połączone w celu utworzenia nowego wspólnego wektora cech:
 (11)
(11)
Architektura sieci i hiperparametry:
Wspólny wektor cech został wprowadzony do wielowarstwowego perceptrona (MLP) w modelu NCF w celu przetworzenia29,30. Wielowarstwowy perceptron wykorzystał określoną wcześniej architekturę z trzema warstwami ukrytymi, zawierającymi odpowiednio 64, 32 i 16 neuronów. Szybkość uczenia ustawiono na 0,01 przy rozmiarze paczki wynoszącym 256. Po nieliniowej transformacji w kilku warstwach ukrytych MLP wygenerowano przewidywaną wartość zainteresowania studentów punktami wiedzy:
 (12)
(12)
W1, W2, ... , WL reprezentują macierze wag wielu warstw ukrytych. σ oznacza nieliniową funkcję aktywacji, a b1, b2, ... , bL reprezentują parametry przesunięcia (bias) poszczególnych warstw ukrytych. Im wyższa przewidywana wartość zainteresowania wynikowa, tym większe jest zainteresowanie ucznia tym punktem wiedzy.
Trenowanie modelu
Sieć została zoptymalizowana przy użyciu solvera Adam (wskaźnik zaniku 0,01, szybkość uczenia 0,01, rozmiar partii 256). Jako funkcja straty zastosowano średni błąd kwadratowy (MSE)31,32:
 (13)
(13)
u, k oznaczają indeksy wektora zachowań studenta oraz wektora punktów wiedzy. Poprzez minimalizację funkcji straty model stale aktualizuje potencjalne wektory cech dla studentów i punktów wiedzy w celu zwiększenia dokładności przewidywań. Podczas procesu uczenia wykorzystano algorytm wstecznej propagacji do aktualizacji macierzy wag w modelu3,34.
Wynik ścieżki
Zastosowane podejście polegało na sortowaniu według przewidywanych wartości zainteresowania i rekomendowaniu studentom k punktów wiedzy o najwyższych wartościach zainteresowania:
 (14)
(14)
kk reprezentuje k punktów wiedzy, które najbardziej interesują studentów. Te rekomendowane punkty wiedzy nie tylko odpowiadają zainteresowaniom edukacyjnym studentów, ale także pomagają im efektywnie uczyć się na poziomie postępu i trudności, który jest dla nich odpowiedni.
Rysunek 2 przedstawia ten proces generowania.
Punkt kontrolny 3: Model NCF generuje niecykliczną macierz sekwencji. Jak szczegółowo opisano w Tabeli 2, precyzja rekomendacji oceniana przy wyborze top-K pozwoliła uzyskać znormalizowaną skumulowaną zyskowność z dyskontem (NDCG) na poziomie 0,82 oraz współczynnik trafień (hit ratio) wynoszący 0,8 dla K = 10. Metryka średniej odwrotnej rangi ustabilizowała się na poziomie 0,76.
Krok 4: Dynamiczne dostosowywanie poziomu trudności (DQN)
Definicja stanu i działania
Poprzez wprowadzenie sieci DQN i wykorzystanie informacji zwrotnych od uczniów w czasie rzeczywistym do dynamicznego dostosowywania treści i trudności nauki, optymalizowane są efekty uczenia się uczniów35,36. Przestrzeń stanów modelu DQN składa się z wielu czynników:
![Równanie równowagi statycznej: St = [ts, cp, mc, ef], wzór matematyczny do bilansowania sił.](/files/ftp_upload/71641/71641eq50.jpg "figure-protocol-15") (15)
(15)
Wśród nich ts oznacza czas, jaki uczniowie poświęcają na aktualne zadanie edukacyjne, cp oznacza wybory uczniów w ścieżce nauki (wybrane rozdziały lub punkty wiedzy), mc oznacza stopień ukończenia aktualnego zadania edukacyjnego przez uczniów, a ef oznacza informację zwrotną dotyczącą emocji uczniów (stopień preferencji i zaangażowania w dane zadanie edukacyjne).
Obliczanie nagrody
Agent uczenia ze wzmocnieniem wykorzystywał architekturę wielowarstwowego perceptrona składającą się z dwóch warstw ukrytych zawierających odpowiednio 128 i 64 neurony (strategia eksploracji epsilon-greedy z malejącą wartością od 1,0 do 0,05). W pierwszej kolejności obliczono wartość nagrody odpowiadającą każdemu działaniu uczącemu:
 (16)
(16)
Wśród nich ω jest hiperparametrem wagowym, który kontroluje wydajność uczenia się oraz udział w procesie uczenia. Ptask reprezentuje wydajność ucznia w bieżącym zadaniu edukacyjnym, a Epart reprezentuje udział ucznia w bieżącym procesie uczenia.
Aktualizacja wartości Q i wybór działania
Po otrzymaniu wartości nagrody model zaktualizował wartość Q, aby wybrać optymalne działanie:
 (17)
(17)
α oznacza tempo uczenia kontrolujące wielkość kroku aktualizacji, a γ, czynnik dyskontujący, określa znaczenie przyszłych nagród.
Platforma wybrała optymalne działanie korygujące:
 (18)
(18)
 jest optymalnym działaniem korygującym wybranym przez platformę na podstawie stanu nauki studenta w czasie t.
Korekta została wykonana zgodnie z następującymi protokołami: (1) stopień trudności zwiększano w przypadku wysokich zdolności uczenia się; (2) dostarczano wskazówek lub zmniejszano stopień trudności w przypadku słabych wyników; (3) treść była modyfikowana w zależności od zmian zainteresowań; (4) parametry utrzymywano na stałym poziomie przy zrównoważonych wynikach.
Punkt kontrolny 4: Agent DQN obliczył optymalne działania (At) w celu podtrzymania zaangażowania. Złożona metryka sprzężenia zwrotnego emocjonalnego (ef) utrzymała współczynnik niezawodności alfa Cronbacha na poziomie 0,85 podczas testów.
Wyświetlanie interfejsu platformy
Rysunek 3 przedstawia interfejs inteligentnej platformy edukacyjnej opracowanej w niniejszej pracy, która umożliwia generowanie spersonalizowanych ścieżek. W tym interfejsie studenci mogą przeglądać swoją spersonalizowaną ścieżkę nauki i korzystać z niej. Ukończona część ścieżki nauki została zaznaczona na zielono, a część niedokończona na czerwono. Studenci mogą śledzić swoje postępy w nauce wzdłuż ścieżki i odpowiednio przechodzić do następnego kroku. W grupie eksperymentalnej przeprowadzono ankiety pointerakcyjne z wykorzystaniem standardowej skali użyteczności systemu (System Usability Scale). Analiza wykazała średnią ocenę użyteczności wynoszącą 84,5 z 10, co wskazuje na bardzo wysoki poziom akceptowalności ergonomii i przejrzystości nawigacji interfejsu.
Projekt eksperymentalny
Uczestnikami badania było 120 studentów studiów licencjackich (62 kobiet, 58 mężczyzn; średnia wieku 19,3 lat ± 1,1 roku), zapisanych na obowiązkowy kurs „Wprowadzenie do tradycyjnej kultury chińskiej” w Shaanxi University of International Trade & Commerce. Żadna z osób nie miała wcześniejszego doświadczenia w nauce z wykorzystaniem VR. Studenci zostali dobrani w pary na podstawie wyników wstępnego testu, a następnie w ramach par losowo przydzieleni do grupy eksperymentalnej lub kontrolnej przy użyciu sekwencji generowanej komputerowo, co zapewniło równoważność wyjściową grup.
Celem projektu tego eksperymentu była weryfikacja skuteczności zaprojektowanej inteligentnej platformy nauczania w zakresie zwiększania zainteresowania uczniów nauką, poprawy ich wyników w nauce oraz realizacji spersonalizowanej edukacji.
W eksperymencie utworzono grupę eksperymentalną oraz grupę kontrolną, a dobór studentów odbył się zgodnie z następującymi zasadami: (1) zapewniono, aby studenci w grupie eksperymentalnej i kontrolnej wykazywali podobieństwo pod względem wiedzy podstawowej, zdolności uczenia się, zainteresowań itp. (2) wybrano studentów studiujących kulturę tradycyjną na podobnym poziomie zaawansowania, aby zapewnić jednolitość treści edukacji kulturowej i porównywalność eksperymentu. (3) uwzględniono różnice indywidualne studentów, aby zapewnić, że grupa eksperymentalna będzie mogła w pełni wykorzystać funkcję personalizacji inteligentnej platformy nauczania.
Po wybraniu uczniów zostali oni pogrupowani, a osoby o podobnych wynikach w nauce, zainteresowaniach i pochodzeniu przypisano odpowiednio do grupy eksperymentalnej i kontrolnej, aby zapewnić dopasowanie w wielu wymiarach i zwiększyć niezawodność eksperymentu.
Wpływ platformy opracowanej w niniejszej pracy na studentów oceniono poprzez porównanie wyników grupy eksperymentalnej i kontrolnej. Aby wyizolować pedagogiczny wkład algorytmów sztucznej inteligencji, w badaniu wzięły udział trzy odrębne kohorty: tradycyjna grupa kontrolna korzystająca ze standardowych metod nauczania w klasie, grupa korzystająca wyłącznie z VR, wchodząca w interakcję ze stałymi środowiskami wirtualnymi pozbawionymi algorytmów adaptacyjnych, oraz grupa eksperymentalna korzystająca z w pełni zintegrowanej inteligentnej platformy dydaktycznej. Studenci w grupie eksperymentalnej mogli uczyć się w scenie VR, a każdy z nich mógł generować spersonalizowane ścieżki nauczania w oparciu o charakterystykę swoich zachowań edukacyjnych za pośrednictwem inteligentnej platformy dydaktycznej, dynamicznie dostosowując treści i stopień trudności nauki w odpowiedzi na informacje zwrotne otrzymywane w czasie rzeczywistym podczas procesu uczenia się. Grupa kontrolna otrzymała wykształcenie kulturowe za pomocą tradycyjnych metod nauczania, takich jak wyjaśnienia w klasie, czytanie podręczników i filmy. Grupa kontrolna przeszła standaryzowaną edukację kulturową poprzez wykłady prowadzone przez instruktora, wyznaczone lektury oraz liniowe prezentacje multimedialne. To podstawowe nauczanie wykorzystywało identyczną zawartość informacyjną i zachowywało to samo tempo czasowe, co program nauczania grupy eksperymentalnej.
Sformułowano trzy hipotezy w celu wyjaśnienia celu badania: (1) Immersyjne środowisko uczenia się zapewniane przez technologię VR może znacząco zwiększyć zaangażowanie i zainteresowanie studentów nauką. (2) Spersonalizowana ścieżka uczenia się generowana przez modele Transformer i NCF skutecznie poprawiła wyniki w nauce studentów oraz zmniejszyła różnice w opanowaniu wiedzy pomiędzy poszczególnymi studentami. (3) Inteligentna platforma dydaktyczna mogła dynamicznie dostosowywać treść i stopień trudności materiałów w oparciu o odpowiedzi studentów w czasie rzeczywistym, co dodatkowo poprawiło efekty ich nauki.
Proces eksperymentalny: (1) Przed eksperymentem przeprowadzono test wiedzy kulturowej wśród studentów w grupach eksperymentalnej i kontrolnej, aby upewnić się, że początkowy poziom wiedzy kulturowej w obu grupach był podobny oraz aby zminimalizować błędy eksperymentalne. (2) Studenci z grupy eksperymentalnej korzystali z przygotowanej sceny VR oraz inteligentnej platformy dydaktycznej podczas miesięcznych studiów kulturowych, a treści nauczania były dynamicznie dostosowywane zgodnie z wytycznymi platformy. Grupa kontrolna korzystała z tradycyjnych metod nauczania. Ze względu na ograniczenia logistyczne wstępnego pilotażu interwencja trwała cztery tygodnie. Następnie przeprowadzono podłużne badanie kontrolne obejmujące pełny 16-tygodniowy semestr, które zakończyło się testem retencji z opózczeniem w 20. tygodniu. Ewaluacja wykazała o 2% wyższą retencję wybranych pojęć historycznych w grupie prowadzonej algorytmicznie niż w grupie z tradycyjną instrukcją. Wstępne szczegóły protokołu przedstawiono w sekcji ograniczeń, aby osadzić obecne wyniki w kontekście dowodów krótkoterminowych. (3) Po zakończeniu eksperymentu obie grupy studentów rozwiązały ten sam test wiedzy kulturowej w celu oceny efektów uczenia się oraz stopnia realizacji zadań.
Wskaźniki oceny uczniów obejmowały ich wyniki w nauce, realizację zadań edukacyjnych oraz postępy w nauce. Za pomocą statystyki opisowej podsumowano odpowiednie wskaźniki oceny dla grup eksperymentalnej i kontrolnej. Wskaźniki oceny inteligentnej platformy dydaktycznej obejmowały czas odpowiedzi.
Dostęp ograniczony. Zaloguj się lub rozpocznij wersję próbną, aby wyświetlić tę treść.
Wyniki
Podział danych, walidacja i ustawienia powtarzalności
W fazie uczenia algorytmicznego zestaw danych interakcji behawioralnych, zawierający 5 00 logów, został podzielony na zbiory treningowy i walidacyjny w stosunku 80:20. W procedurach walidacji zastosowano schemat 5-krotnej walidacji krzyżowej w celu oceny spójności ekstrakcji cech. Aby zapewnić pełną powtarzalność eksperymentalną, wszystkie inicjalizacje wag sieci, sekwencje przetasowania zbioru danych oraz wzorce eksploracji w uczeniu ze wzmocnien...
Dostęp ograniczony. Zaloguj się lub rozpocznij wersję próbną, aby wyświetlić tę treść.
Dyskusja
To badanie przyczynia się do technologii edukacyjnej, przekładając podstawowe teorie pedagogiczne—czyli konstruktywizm i Strefę Najbliższego Rozwoju—na zrealizowany obliczeniowo inteligentny system nauczania. Integracja immersji VR z personalizacją opartą na zachowaniach zapewnia, że innowacja technologiczna służy wyraźnym celom edukacyjnym, a nie funkcjonuje jako cel sam w sobie. Jak podkreślono w metodologii, generowanie spersonalizowanych ścieżek uczenia się jest kluczowym elementem zapewnienia efektywności procesu ed...
Dostęp ograniczony. Zaloguj się lub rozpocznij wersję próbną, aby wyświetlić tę treść.
Oświadczenia
Autorzy deklarują, że nie mają żadnych konfliktów interesów finansowych. Ujawnienie narzędzi sztucznej inteligencji: Podczas przygotowywania niniejszego rękopisu wykorzystano duże modele językowe wyłącznie w celu udoskonalenia języka, wyjaśnienia specjalistycznej terminologii i pomocy w odnalezieniu literatury naukowej. Wszystkie wyniki sztucznej inteligencji były krytycznie oceniane, ręcznie zweryfikowane z pierwotnymi recenzowanymi źródłami i rygorystycznie edytowane przez autorów w celu zapewnienia ścisłej dokładności naukowej i integralności danych.
Materiały
| Nazwa | Firma | Numer katalogowy | Komentarze |
|---|---|---|---|
| High-fidelity spatial rendering engine | Unreal Engine 5 | Używany do integracji sceny, dynamicznego ray tracingu i symulacji fizyki. | |
| Ray tracing | Ray tracing | Technologia symulacji oświetlenia oparta na zasadach fizycznych | |
| 3D modeling software | Blender | Używany do generowania wielościennych modeli artefaktów kulturowych i stosowania tekstur PBR. | |
| Level of detail | Level of detail | Technologia optymalizacji sceny | |
| Spatial audio | Spatial audio | Symulowanie właściwości propagacji dźwięku w trójwymiarowym przestrzeni | |
| Haptic feedback | Haptic feedback | Symulowanie sił sprzężenia zwrotnego podczas interakcji z fizyką | |
| Visual scripting & programming interface | Blueprints & C++ | Używane do konfiguracji interakcji użytkowników i ciągłego rejestrowania danych zachowań przestrzennych. | |
| Head-mounted display (HMD) | HTC Vive Pro | Zapewnia immersyjną wizualizacje, dostarczanie dźwięku przestrzennego i śledzenie ruchu. |
Bibliografia
- Rojas-Sanchez MA, Palos-Sanchez PR, Folgado-Fernandez JA. Systematic literature review and bibliometric analysis on virtual reality and education. Educ Inf Technol (Dordr). 2023;28:155-92.
- Rospigliosi P. Metaverse or simulacra? Roblox, Minecraft, Meta and the turn to virtual reality for education, socialisation and work. Interact Learn Environ. 2022;30:1-3.
- Quadir B, Chen NS, Isaias P. Analyzing the educational goals, problems and techniques used in educational big data research from 2010 to 2018. Interact Learn Environ. 2022;30:1539-55.
- Lutfiani N, Meria L. Utilization of big data in educational technology research. Int Trans Educ Technol. 2022;1:73-83.
- Radianti J, Majchrzak TA, Fromm J, Wohlgenannt I. A systematic review of immersive virtual reality applications for higher education: design elements, lessons learned, and research agenda. Comput Educ. 2020;147:103778.
- Hulusic V, Gusia L, Luci N, Smith M. Tangible user interfaces for enhancing user experience of virtual reality cultural heritage applications for utilization in educational environment. ACM J Comput Cult Herit. 2023;16:1-24.
- Mubarok H, Lin CJ, Hwang GJ. A virtual reality-based collaborative argument mapping approach in the EFL classroom. Interact Learn Environ. 2024;32:4978-96.
- Sun T, et al. Restoring Dunhuang murals: crafting cultural heritage preservation knowledge into immersive virtual reality experience design. Int J Hum Comput Interact. 2024;40:2019-40.
- Ouatik F, et al. Predicting student success using big data and machine learning algorithms. Int J Emerg Technol Learn. 2022;17:236-51.
- Bhaskaran S, Marappan R. Enhanced personalized recommendation system for machine learning public datasets: generalized modeling, simulation, significant results and analysis. Int J Inf Technol. 2023;15:1583-95.
- Gupta S, Kumar P, Tekchandani RK. Facial emotion recognition based real-time learner engagement detection system in online learning context using deep learning models. Multimed Tools Appl. 2023;82:11365-94.
- El-Wajeh YA, Hatton PV, Lee NJ. Unreal Engine 5 and immersive surgical training: translating advances in gaming technology into extended-reality surgical simulation training programmes. Br J Surg. 2022;109:470-1.
- Conde D, et al. LiDAR data processing for digitization of the castro of Santa Trega and integration in Unreal Engine 5. Int J Archit Herit. 2025;19:131-51.
- Rohe DP, Jones EM. Generation of synthetic digital image correlation images using the open-source Blender software. Exp Tech. 2022;46:615-31.
- Pradana MR, Setiawan D, Trinawati L. Efektivitas ilusi 3D animasi Blender pada curved LED billboard (AB Building Jl. Juanda Pekanbaru). JEKIN (Jurnal Teknik Informatika). 2023;3(2):1-10. Available from: https://pdfs.semanticscholar.org/e4fd/a249d78d46e24319e3a8f318e713f76c0cbd.pdf
- Wang Y, Zhao K, Zheng Z. An improved 3D indoor positioning study with ray tracing modeling for 6G systems. Mob Netw Appl. 2023;28:1162-75.
- Liu Y, et al. Intelligent ray-tracing-based simulation and emulation of channels. Chin J Radio Sci. 2024;39:1112-9.
- Weier P, et al. Neural prefiltering for correlation-aware levels of detail. ACM Trans Graph. 2023;42:1-16.
- Mercier C, et al. Moving level-of-detail surfaces. ACM Trans Graph. 2022;41:1-10.
- Zhu M, Sun Z, Lee C. Soft modular glove with multimodal sensing and augmented haptic feedback enabled by materials' multifunctionalities. ACS Nano. 2022;16:14097-110.
- Heng JJ, Teo DB, Tan LF. The impact of Chat Generative Pre-trained Transformer (ChatGPT) on medical education. Postgrad Med J. 2023;99:1125-7.
- Hung YC, et al. Comparison of patient education materials generated by chat generative pre-trained transformer versus experts: an innovative way to increase readability of patient education materials. Ann Plast Surg. 2023;91:409-12.
- Yang H, et al. CovidViT: a novel neural network with self-attention mechanism to detect Covid-19 through X-ray images. Int J Mach Learn Cybern. 2023;14:973-87.
- Kumar S, Solanki A. An abstractive text summarization technique using transformer model with self-attention mechanism. Neural Comput Appl. 2023;35:18603-22.
- Tapalova O, Zhiyenbayeva N. Artificial intelligence in education: AIEd for personalised learning pathways. Electron J e-Learn. 2022;20:639-53.
- Hashim S, et al. Trends on technologies and artificial intelligence in education for personalized learning: systematic literature. J Acad Res Progress Educ Dev. 2022;12:884-903.
- Lin W, et al. A deep neural collaborative filtering based service recommendation method with multi-source data for smart cloud-edge collaboration applications. Tsinghua Sci Technol. 2023;29:897-910.
- Ha J, Park S. NCMD: Node2vec-based neural collaborative filtering for predicting miRNA-disease association. IEEE/ACM Trans Comput Biol Bioinform. 2022;20:1257-68.
- Nuanmeesri S, et al. Improving dropout forecasting during the COVID-19 pandemic through feature selection and multilayer perceptron neural network. Int J Inf Educ Technol. 2022;12:851-7.
- Yilmaz O, Altun AA, Koklu M. Optimizing the learning process of multi-layer perceptrons using a hybrid algorithm based on MVO and SA. Int J Ind Eng Comput. 2022;13:617-40.
- Garcia Garcia C, Salmeron Gomez R, Garcia Perez J. A review of ridge parameter selection: minimization of the mean squared error vs. mitigation of multicollinearity. Commun Stat Simul Comput. 2024;53:3686-98.
- Thongsak N, Lawson N. Bias and mean square error reduction by changing the shape of the distribution of an auxiliary variable: application to air pollution data in Nan, Thailand. Math Popul Stud. 2023;30:180-94.
- Mohammed NA, Al-Bazi A. An adaptive backpropagation algorithm for long-term electricity load forecasting. Neural Comput Appl. 2022;34:477-91.
- Wright LG, et al. Deep physical neural networks trained with backpropagation. Nature. 2022;601:549-55.
- Bhimshetty S, Ikechukwu AV. Energy-efficient deep Q-network: reinforcement learning for efficient routing protocol in wireless internet of things. Indones J Electr Eng Comput Sci. 2024;33:971-80.
- Geng X, Zhang B. Deep Q-network-based intelligent routing protocol for underwater acoustic sensor network. IEEE Sens J. 2023;23:3936-43.
Dostęp ograniczony. Zaloguj się lub rozpocznij wersję próbną, aby wyświetlić tę treść.