Proponowana Platforma Automatyzacji Odbiorów Niskiego Napięcia integruje Internet Rzeczy (IoT), wizualną orchestrację przepływu pracy, obliczenia krawędziowe i chmurowe, inżynierię cech oraz uczenie maszynowe w celu zautomatyzowania testów odbiorczych systemów niskiego napięcia (LV). Platforma umożliwia inteligentne wykrywanie usterek, podejmowanie decyzji w czasie rzeczywistym, automatyczny odbiór, wysoką dokładność, niskie opóźnienia operacyjne oraz skalowalne wdrożenie.
Subskrypcja JoVE jest wymagana do oglądania tego materiału. Zaloguj się lub rozpocznij bezpłatny okres próbny.
Artykuł badawczy
Zorientowana na procesy platforma automatyzacji odbiorów niskiego napięcia z wizualną orchestracją przepływu pracy i walidacją opartą na uczeniu maszynowym
W tym artykule
Podsumowanie
Streszczenie
The rapid expansion of low-voltage (LV) networks and their integration with distributed energy resources requires intelligent and automated management solutions. Cloud-edge collaborative Internet of Things (IoT) platforms support real-time monitoring, control, and data acquisition. However, existing platforms generally lack workflow automation, visual process orchestration, user-guided decision support, and comprehensive validation. Consequently, they do not provide process-driven solutions for automated LV network acceptance testing. This study presents the design and evaluation of a Low-Voltage Acceptance Automation Platform based on a visualized process canvas. The proposed platform adopts a process-driven architecture in which acceptance workflows are visually created, managed, and executed. The visual process canvas transforms conventional static monitoring into dynamic workflow automation by enabling real-time workflow execution, validation, and decision-making. The framework incorporates the Open LV Network & Smart Meter dataset to support realistic modeling of electrical load behavior. The workflow includes IoT-based data acquisition, data preprocessing, feature engineering, workflow orchestration using the visual process canvas, machine learning-based validation, and real-time dashboard visualization. The proposed framework achieved a fault detection rate of 98.4%, a receiver operating characteristic area under the curve (ROC-AUC) of 0.968, and an operational decision latency of 31 ms, outperforming traditional cloud-centric and IoT-based baseline approaches by approximately 30%–40%.
Wprowadzenie
Przemysł 4.0 (I4.0)1 jest możliwy dzięki kilku wyłaniającym się technologiom, spośród których przemysłowy internet rzeczy (IIoT) jest jedną z najważniejszych. IIoT odnosi się do zastosowania technologii internetu rzeczy (IoT) w środowiskach przemysłowych, w których połączone urządzenia i maszyny komunikują się głównie poprzez interakcje typu maszyna-maszyna. Ponieważ awarie w systemach przemysłowych mogą prowadzić do znacznych strat operacyjnych, aplikacje IIoT wymagają wysoce niezawodnej komunikacji, generując jednocześnie znacznie większe wolumeny danych niż konwencjonalne systemy IoT2. Ponadto niektóre badania traktują IIoT jako koncepcję ściśle powiązaną z Przemysłem 4.03. Technologie IoT przekształcają tradycyjne architektury hierarchiczne, umożliwiając tworzenie bardziej elastycznych systemów z płynną wymianą danych4. Liczne niedawne badania poddały analizie istniejące architektury IIoT i zaproponowały nowe projekty ramowe (frameworki)5,6,7,8,9. Pomimo tych osiągnięć, pozostają dwa główne ograniczenia. Po pierwsze, często proponowane są nowe ramy w celu przezwyciężenia niedoskonałości poprzednich architektur, co skutkuje rosnącą liczbą alternatywnych modeli, zwiększając różnorodność architektoniczną i złożoność wdrożenia. Po drugie, wysoki poziom abstrakcji wielu proponowanych architektur ogranicza ich praktyczne zastosowanie w środowiskach przemysłowych10.
W literaturze opisano kilka architektur IIoT. Architektura IIoT oparta na standardzie Open Platform Communications (OPC) została przedstawiona wraz z pośrednikiem (middleware) w języku Python do zarządzania komunikacją OPC11. Zaproponowano siedmiowarstwową architekturę IIoT; jednak nie podano szczegółów implementacji ani eksperymentów walidacyjnych12. Opisano framework integrujący technologie 5G i IIoT wraz z reprezentatywnym przypadkiem użycia, choć walidacja eksperymentalna była ograniczona13. Wprowadzono framework projektowania emocjonalnego dla Przemysłu 4.0 i omówiono jego potencjalne implikacje bez weryfikacji eksperymentalnej14. Wielowarstwowa platforma IIoT została oceniona w rzeczywistym środowisku testowym, z naciskiem na kwestie telekomunikacyjne15. Podobnie, przedstawiono modułowy framework IoT do monitorowania jakości powietrza wewnątrz pomieszczeń, a jego wydajność oceniono na podstawie danych zebranych z 84 gospodarstw domowych z dziećmi16.
Internet Rzeczy (IoT) stał się szybko rozwijającą się technologią o znacznym potencjale zastosowań w sektorze energetyki elektrycznej17,18. Integracja technologii IoT w węzłach systemu energetycznego umożliwia bardziej inteligentną i efektywną generację, przesył, dystrybucję, eksploatację i wykorzystanie energii dzięki autonomicznemu podejmowaniu decyzji wspieranemu przez ciągły monitoring przepływu elektryczności w inteligentnej sieci (smart grid) w czasie rzeczywistym. W rezultacie inteligentne węzły te poprawiają ogólną wydajność operacyjną sieci elektrycznej19. Technologia komunikacyjna stanowi fundamentalny element wdrażania inteligentnych sieci, ponieważ dwie główne kategorie informacji muszą być przesyłane niezawodnie: pomiary z czujników oraz sygnały sterujące. Oprócz niskich opóźnień komunikacyjnych, aplikacje inteligentnych sieci wymagają odpowiedniej jakości usług (QoS) oraz właściwego bezpieczeństwa danych w celu zapewnienia niezawodnego działania20.
Wybór odpowiedniej technologii komunikacyjnej dla zastosowań w inteligentnych sieciach energetycznych wymaga rozważenia interwałów komunikacyjnych, prędkości przesyłu danych oraz kosztów komunikacji21. Sieci komunikacyjne IoT zazwyczaj składają się z warstw oprogramowania, bezpieczeństwa, usług, systemowej oraz łączności. W obrębie warstwy łączności protokoły komunikacyjne są zazwyczaj klasyfikowane w trzech kategoriach. Protokoły dalekiego zasięgu obejmują Long Range (LoRa) oraz Narrowband-IoT (NB-IoT); protokoły średniego zasięgu obejmują Wi-Fi, 4G/LTE i 5G; natomiast protokoły krótkiego zasięgu obejmują Bluetooth i ZigBee. W miarę postępującej deregulacji rynków energii elektrycznej, prognozowanie obciążenia stało się bardziej istotne dla oceny wpływu warunków pogodowych, awarii sprzętu, zmian regulacyjnych i innych czynników operacyjnych na koszt usług elektrycznych. W konsekwencji dokładne prognozowanie obciążenia w sektorze mieszkalnym stało się niezbędne dla funkcjonowania i nadzoru nad inteligentnymi sieciami energetycznymi, mikrosieciami oraz inteligentnymi budynkami22.
Niezawodna praca sieci niskiego napięcia (LV) zależy od utrzymania wysokiej jakości energii23. Jakość energii jest określana przez skuteczność regulacji napięcia, zrównoważenie prądów oraz ograniczanie zakłóceń technicznych w niesymetrycznych warunkach pracy24. Wśród tych czynników szczególnie istotne jest zrównoważenie faz, ponieważ determinuje ono jednolity rozkład napięć i prądów w poszczególnych fazach25. Niewłaściwe zrównoważenie faz może prowadzić do zwiększonego nagrzewania przewodników, odchyłek napięcia oraz wzrostu prądów w przewodzie neutralnym, co obniża sprawność systemu i niezawodność eksploatacyjną26. W związku z tym, podczas procesu projektowania należy uwzględnić zrównoważenie faz, aby poprawić wydajność systemu, stabilność pracy i długoterminową niezawodność. Niemniej jednak aspekt ten jest rzadko uwzględniany w konwencjonalnych metodologiach projektowania mikrosieci.
Ostatnie postępy w systemach orchestracji przepływu pracy wykazały korzyści płynące z automatyzacji sterowanej zdarzeniami oraz wizualnego zarządzania procesami w środowiskach przemysłowego IoT. Niemniej jednak, ich zastosowanie w walidacji sieci dystrybucyjnych i odbiorczych badaniach niskiego napięcia pozostaje ograniczone. Większość istniejących systemów automatyki niskiego napięcia koncentruje się głównie na monitorowaniu i nadzorowaniu, podczas gdy stosunkowo niewiele badań dotyczy zarządzania odbiorami w oparciu o przepływy pracy lub zautomatyzowanej weryfikacji zgodności. Podobnie, choć techniki uczenia maszynowego przyciągnęły znaczną uwagę w zakresie wykrywania anomalii w inteligentnych licznikach i oceny jakości energii, podejścia te są zazwyczaj opracowywane jako niezależne modele analityczne, a nie jako komponenty zintegrowanego frameworku orchestracji przepływu pracy.
W ostatnich latach zaproponowano różne rozwiązania inteligentnych liczników energii dla zarządzania inteligentnymi budynkami i automatyki domowej27. W publikacji27 zaprezentowano prototyp inteligentnego licznika, aby zademonstrować integrację koncepcji edukacyjnych na poziomie uniwersyteckim z technologiami inteligentnego pomiaru. Opracowany inteligentny licznik wykazał znaczny potencjał w zakresie zarządzania i kontroli energii, redukując zużycie energii i przynosząc korzyści zarówno przedsiębiorstwom energetycznym, jak i konsumentom dzięki dwukierunkowej komunikacji IoT. Następnie wprowadzono system inteligentnych gniazdek oparty na mikrokontrolerze w celu wsparcia inteligentnego monitorowania energii28.
Zaproponowany system inteligentnych gniazdek wyświetla zużycie energii w czasie rzeczywistym za pomocą graficznego interfejsu użytkownika opartego na systemie Android. Ponadto urządzenie potrafi wykryć obecność podłączonych urządzeń elektrycznych, co jest funkcją określaną jako inwazyjny pomiar obciążenia28. Do implementacji wykorzystano niedrogi komercyjny inteligentny gniazdek. Przyszłe ulepszenia obejmują monitorowanie wartości skutecznej (RMS) prądu, mocy czynnej, mocy biernej oraz kąta przesunięcia fazowego między napięciem a prądem. Jak opisano w naszych poprzednich badaniach, częściowo przyłączona do sieci mikrosieć fotowoltaiczna wykorzystuje protokoły komunikacyjne ZigBee i LoRa do wymiany informacji z urządzeniami liczników inteligentnych, co wykazuje wykonalność komunikacji opartej na IoT dla rozproszonych systemów energetycznych29,30.
Aby rozwiązać ograniczenia konwencjonalnego planowania systemów dystrybucyjnych, praktyka inżynierska oraz badania naukowe rozwijały się w kilku komplementarnych kierunkach. Jeden z kierunków badań koncentrował się na planowaniu wysokopoziomowym z wykorzystaniem systemów informacji geograficznej (GIS) w celu wyboru lokalizacji i wstępnej oceny zasobów31,32. Inny kierunek skupiał się na ulepszaniu poszczególnych komponentów i podsystemów, w tym na wyborze przewodników, optymalnym doborze mocy generacji i pojemności magazynów energii oraz porównawczych ocenach systemów dystrybucji prądu przemiennego (AC) i prądu stałego (DC)33,34,35,36. Trzeci kierunek badań zastosował algorytmy optymalizacji do planowania sieci dystrybucyjnych, wyznaczania tras linii zasilających i projektowania topologii sieci. Niedawne osiągnięcia obejmują rozwiązania takie jak platforma uGrid opracowana przez badaczy, która integruje rozmieszczenie urządzeń i konfigurację sieci, lecz nie posiada standardowej analizy przepływu mocy do weryfikacji i optymalizacji. Inne podejścia opierają się na ręcznym dostrajaniu parametrów w celu generowania topologii lub koncentrują się na specjalistycznych zastosowaniach, takich jak niskomocowe mikrosieci DC37,38,39. Choć podejścia te reprezentują znaczący postęp, wymagane są dalsze prace w celu ustanowienia zintegrowanej metodologii kompleksowego projektowania niskonapięciowych systemów dystrybucyjnych. Ponadto kompleksowe oceny techniczno-ekonomiczne jednofazowych, trójfazowych i hybrydowych systemów niskonapięciowych pozostają ograniczone.
Ostatnie postępy w dziedzinie sztucznej inteligencji (AI) i uczenia maszynowego dodatkowo rozszerzyły możliwości inteligentnych systemów energetycznych. Kompleksowy przegląd przedstawiony w podsumowaniu omówił zastosowania AI i uczenia maszynowego w inteligentnych sieciach energetycznych, w tym technologie wschodzące, takie jak Federated Learning, Generative AI, Large Language Models, Artificial Intelligence of Things (AIoT) oraz Cyfrowe Bliźniaki (Digital Twins)40. Przegląd ten wyróżnił zastosowania w prognozowaniu obciążenia, konserwacji predykcyjnej, detekcji anomalii, zarządzaniu stroną popytową oraz integracji pojazdów elektrycznych, kładąc jednocześnie nacisk na nieustające wyzwania związane z interoperacyjnością, prywatnością, skalowalnością, odpornością i kwestiami etycznymi. Inny niedawny przegląd oceniał metody AI w zakresie rozproszonego zarządzania energią w infrastrukturach typu IoT-edge-cloud, koncentrując się na uczeniu maszynowym, uczeniu ze wzmocnieniem i systemach wieloagentowych dla zdecentralizowanego sterowania energią41.
W ujęciu zbiorczym poprzednie badania przyczyniły się do rozwoju monitorowania w oparciu o IoT, inteligentnego pomiaru, obliczeń krawędziowo-chmurowych (cloud-edge computing), sztucznej inteligencji oraz inteligentnego zarządzania energią w niskonapięciowych (LV) systemach dystrybucyjnych. Technologie te były jednak w dużej mierze rozwijane niezależnie. Orkiestracja przepływu pracy, zautomatyzowane zarządzanie akceptacją, walidacja sterowana procesem oraz zintegrowane wsparcie decyzji pozostają ograniczone, co podkreśla potrzebę stworzenia ujednoliconego, zorientowanego na przepływ pracy frameworka automatyzacji.
W związku z tym niniejsze badanie przedstawia platformę automatyzacji odbiorów sieci niskiego napięcia opartą na wizualizowanym płótnie procesowym. Zaproponowana struktura integruje akwizycję danych w oparciu o IoT, wstępne przetwarzanie danych, inżynierię cech, orchestrację przepływu pracy, walidację opartą na uczeniu maszynowym, obliczenia chmurowo-krawędziowe oraz wizualizację w czasie rzeczywistym w ramach jednolitej architektury, aby wspierać zautomatyzowane i niezawodne testy odbiorowe sieci LV z wykorzystaniem rzeczywistych danych z inteligentnych liczników. Rycina 1 przedstawia ogólny schemat zorientowanej na przepływ pracy architektury proponowanej platformy. Przepływ pracy obejmuje akwizycję danych, wstępne przetwarzanie, inżynierię cech, orchestrację przepływu pracy, inteligentne podejmowanie decyzji oraz integrację chmurowo-krawędziową, co umożliwia zautomatyzowaną walidację sieci dystrybucyjnych LV poprzez ramy zorientowane procesowo. Platforma wykazała wysoką dokładność walidacji, jednocześnie redukując opóźnienia w podejmowaniu decyzji operacyjnych oraz czas wykonywania przepływu pracy w porównaniu z podejściami konwencjonalnymi.
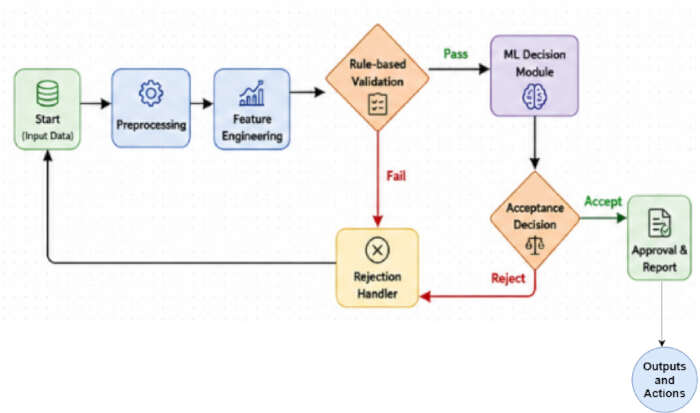
Rysunek 1. Zorientowana na przepływ pracy architektura proponowanej platformy automatyzacji odbiorów niskiego napięcia. Architektura wysokiego poziomu proponowanej, sterowanej procesowo platformy automatyzacji odbiorów niskiego napięcia (LV). Schemat przedstawia sekwencyjną integrację akwizycji danych za pomocą IoT, preprocessingu danych, inżynierii cech, orchestracji przepływu pracy, inteligentnego podejmowania decyzji, współpracy w modelu chmura-krawędź (cloud-edge) oraz zautomatyzowanego odbioru dla walidacji sieci rozpdzielczej LV. IoT = Internet Rzeczy; LV = niskie napięcie; ML = uczenie maszynowe. Aby wyświetlić powiększoną wersję tego rysunku, kliknij tutaj.
Dostęp ograniczony. Zaloguj się lub rozpocznij wersję próbną, aby wyświetlić tę treść.
Protokół
This study did not involve human participants, animals, or identifiable personal data. The analyses were performed using a publicly available dataset (UK Power Networks Open LV Network & Smart Meter dataset) together with synthetically generated data for validation; therefore, ethics committee approval and informed consent were not required. The research tools used in the protocol are listed in the Table of Materials.
1. Data acquisition
The Low-Voltage (LV) Acceptance Automation Platform was developed using electrical measurements acquired from smart meters, IoT sensors, and the Open LV Network & Smart Meter Dataset. Electrical parameters, including voltage, current, active power, reactive power, and energy consumption, were collected through Wi-Fi-, PLC-, and RS-485-based communication protocols. Real-time measurements were used for live system monitoring, whereas historical data supported model development and validation.
The proposed framework used the Open LV Network & Smart Meter Dataset provided by UK Power Networks42. The dataset comprises household smart meter consumption, feeder-level load profiles, and feeder voltage measurements. Time-series subsets containing load consumption and voltage data were selected for model training and evaluation. In addition, a simulated smart meter dataset was generated to represent operational conditions and fault scenarios required for workflow validation and machine learning model evaluation. The simulated dataset included timestamped measurements of voltage, current, active power, reactive power, energy consumption, total harmonic distortion (THD), and voltage imbalance. Fault samples were generated by simulating undervoltage, overvoltage, excessive harmonic distortion, and voltage imbalance based on established low-voltage operational thresholds. The dataset characteristics are summarized in Table 1.
| Attribute | Description |
| Dataset Name | Open LV Network & Smart Meter Dataset |
| Simulated Smart Meter Dataset | Geneated 1000 smaples for Fault simulation and workflow validation |
| Data Type | Time-series (historical smart meter data) |
| Data Granularity | Household-level and feeder-level measurements |
| Key Features | Voltage, current, active power, reactive power, energy consumption, timestamps |
| Data Frequency | High-resolution (e.g., half-hourly / minute-level depending on subset) |
| Coverage | Residential low-voltage distribution networks |
| Usage in Proposed Work | Model training, validation, load behavior analysis, and acceptance workflow evaluation |
Table 1: Dataset description. Summary of the Open LV Network & Smart Meter dataset used for model development and performance evaluation. The table presents the dataset components, measured electrical variables, sampling characteristics, and dataset partitioning for training, validation, and testing.
Because the Open LV Network & Smart Meter Dataset does not contain predefined fault labels, a rule-based labeling strategy was applied to both the real and simulated datasets. Samples satisfying normal operating limits were assigned a label of 0 (Normal), whereas samples exceeding operational thresholds (e.g., voltage deviations greater than ±10% of the nominal voltage, THD > 5%, or voltage unbalance > 2%) were assigned a label of 1 (Fault). These labels served as the ground truth during model training, validation, and testing. The proposed rule engine also allows threshold values to be configured in accordance with regional standards or utility-specific acceptance criteria.
The dataset was partitioned into training (70%), validation (15%), and testing (15%) subsets. Missing values were addressed using linear interpolation, mean imputation, and forward-fill techniques as described in the preprocessing stage. To ensure statistical robustness and reproducibility, all experiments were repeated five times using different random seeds.
2. Data preprocessing
Raw data from the Open LV Network & Smart Meter Dataset and IoT sensor measurements were preprocessed to improve data quality prior to feature extraction and model development. Missing values, noise, and inconsistencies caused by communication interruptions and sensor malfunctions were identified and corrected using interpolation, mean imputation, and forward-fill techniques. The detailed mathematical derivations are provided in Supplementary File 1 (Section S1).
The preprocessed time-series data were segmented into representative operational intervals (S₁–S₅ and Sk). Statistical and electrical features, including average load, peak load, minimum load, standard deviation, voltage deviation, and power consumption, were extracted from each segment. The extracted features are summarized in Table 2 and served as inputs for the subsequent feature engineering stage.
| Segment ID | Mean Load (kW) | Peak Load (kW) | Min Load (kW) | Std Deviation (kW) | Voltage Deviation (p.u.) | Power Consumption (kWh) | Time Interval |
| S₁ | 2.45 | 3.8 | 1.2 | 0.65 | 0.032 | 58.4 | 00:00–01:00 |
| S₂ | 2.9 | 4.1 | 1.5 | 0.72 | 0.028 | 64.2 | 01:00–02:00 |
| S₃ | 3.25 | 4.85 | 1.8 | 0.81 | 0.035 | 71.6 | 02:00–03:00 |
| S₄ | 3.8 | 5.2 | 2.1 | 0.9 | 0.041 | 78.9 | 03:00–04:00 |
| S₅ | 4.1 | 5.75 | 2.4 | 0.95 | 0.045 | 85.3 | 04:00–05:00 |
| Sk | 3.6 | 5.1 | 2 | 0.88 | 0.038 | 76.5 | tk |
Table 2: Representative feature representation extracted from time-series segments. Representative statistical, electrical, load behavior, voltage stability, and power quality features extracted from segmented LV time-series data during feature engineering. The values illustrate the engineered feature representation and are not experimental performance results. LF = Load Factor; PAR = Peak-to-Average Ratio; VSI = Voltage Stability Index; PF = Power Factor; THD = Total Harmonic Distortion.
3. Feature engineering
Feature engineering was performed to improve the representation of the preprocessed data for workflow orchestration and intelligent decision-making. Principal Component Analysis (PCA)^43 was applied to reduce data dimensionality by removing redundant and highly correlated variables while retaining the most informative feature components. The mathematical derivations are provided in Supplementary File 1 (Section S2).
Statistical descriptors, load behavior indicators, voltage stability indices, and power quality metrics were derived from the segmented time-series data. These engineered features included Load Factor (LF), Peak-to-Average Ratio (PAR), Voltage Stability Index (VSI), Voltage Unbalance Index, Power Factor (PF), and Total Harmonic Distortion (THD). The resulting feature set was used as the input to the workflow orchestration and intelligent decision-making modules.
The feature engineering workflow is summarized in Supplementary File 1 (Supplementary Algorithm 1). The procedure consisted of segmenting the preprocessed data, extracting statistical and electrical features, calculating load behavior, voltage stability, and power quality indicators, and applying PCA to generate the final feature vector used for model training and validation.
4. Visualized process canvas design
The Visualized Process Canvas was developed as a graph-based workflow orchestration framework for automating low-voltage (LV) acceptance procedures. The workflow was represented as a directed graph, G = (N, E), where N = {n1, n2, …, nm}denotes the workflow nodes corresponding to individual processing stages (e.g., data input, preprocessing, validation, and decision-making), and E = {eij}represents the directed edges defining the execution sequence between nodes. This graph-based representation enabled the creation of configurable workflows and their automated execution without manual coding.
Each workflow node performed a specific processing task by receiving input data, executing predefined operations, and forwarding the processed output to subsequent nodes. Acceptance criteria, including voltage and load thresholds, were implemented as configurable validation rules that could be updated without modifying the workflow structure. The workflow supported both sequential and parallel execution to improve computational efficiency. Machine learning models were integrated into designated workflow nodes to perform anomaly detection and automated acceptance validation (Figure 2).
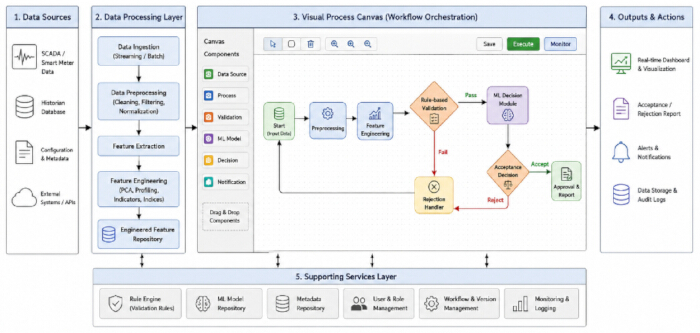
Figure 2: Visualized process canvas architecture for LV acceptance automation. Overview of the visual workflow orchestration framework used for LV acceptance automation. The process canvas illustrates the graphical organization of workflow nodes for data processing, feature engineering, rule-based validation, intelligent decision-making, and output generation to support workflow design, execution, and monitoring. Please click here to view a larger version of this figure.
The mathematical formulation describing information flow through the workflow graph is provided in Supplementary File 1 (Section S3). Supplementary File 1 (Supplementary Algorithm 2) describes the workflow orchestration procedure, including workflow traversal, node execution, rule validation, decision generation, and output aggregation.
The Visualized Process Canvas was implemented using a microservice-oriented software architecture to support scalability and modular deployment. The graphical workflow interface was developed using React.js to provide drag-and-drop workflow configuration. Backend orchestration services were implemented using Flask/FastAPI, while Eclipse Mosquitto served as the MQTT message broker for communication between workflow modules. EdgeX Foundry provided edge device management and IoT integration. Machine learning services were implemented with Scikit-learn, TensorFlow, and PyTorch, and containerized with Docker and Kubernetes.
5. Workflow orchestration engine
The workflow orchestration engine coordinated execution of the configured acceptance workflow. A detailed description is provided in Supplementary File 1 (Section S4), and the execution sequence is summarized in Supplementary Figure 1.
The workflow execution process consisted of validating the workflow definition, initializing the execution environment, scheduling workflow nodes according to their dependencies, executing nodes sequentially or in parallel, applying rule-based validation, aggregating intermediate outputs, and generating the final acceptance or rejection decision based on rule-based and machine learning evaluation. Execution results were published through dashboards, reports, application programming interfaces (APIs), and data storage services. The overall workflow orchestration process is illustrated in Figure 3.
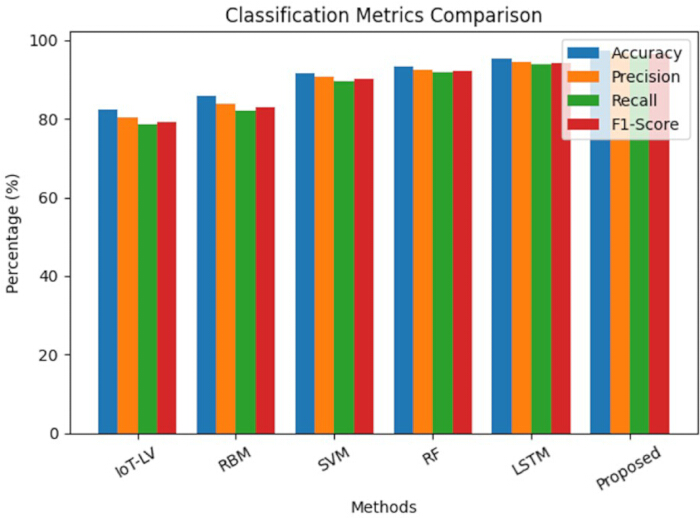
Figure 3: Comparison of classification performance metrics across different methods. Comparison of the classification performance of IoT-LV, RBM, Support Vector Machine (SVM), Random Forest (RF), Long Short-Term Memory (LSTM), and the proposed framework using the Open LV Network & Smart Meter dataset. Performance is evaluated using Accuracy, Precision, Recall, and F1-score. Results are presented as mean ± standard deviation (SD) from five independent experimental runs using a 70%/15%/15% training/validation/testing split. Error bars represent one standard deviation. Please click here to view a larger version of this figure.
6. Intelligent decision module
The Intelligent Decision Module was developed to automate low-voltage (LV) acceptance decisions using supervised machine learning models. Classification and regression algorithms were applied to the engineered feature vectors to support operational decision-making. Classification models identified normal and abnormal operating conditions, whereas regression models estimated future energy consumption and operational trends.
The input feature vector, X ∈ ℝd, comprised the statistical, voltage stability, load behavior, and power quality features extracted during the feature engineering stage. Standalone Support Vector Machine (SVM)44, Random Forest (RF)45, and Long Short-Term Memory (LSTM)46 models were implemented as baseline classifiers for comparative evaluation. The mathematical formulation of the learning models is provided in Supplementary File 1 (Section S5).
For classification, the output variable y ∈ {0,1} represented normal (0) and abnormal (1) operating conditions. When abnormal operating conditions or overload events were detected, the workflow generated a fault notification and flagged the acceptance process as invalid; otherwise, the process was classified as accepted.
The workflow orchestration engine integrated machine-learning predictions with rule-based validation, using a priority-based conflict-resolution strategy. Safety-critical operational rules and regulatory acceptance criteria were treated as hard constraints and therefore took precedence over machine-learning predictions when conflicts occurred. Final acceptance decisions were generated using the combined outputs of the rule-based validation and intelligent decision modules.
7. Cloud–edge integration and visualization dashboard
A cloud-edge computing architecture was implemented to support scalable data processing, storage, and visualization for the LV acceptance automation platform. Smart meters, SCADA systems, and IoT devices continuously collect electrical measurements, which are processed at the edge layer via filtering, normalization, feature extraction, and real-time inference to reduce communication overhead and enable low-latency decision-making. The mathematical derivations are provided in Supplementary File 1 (Section S6).
Processed data were transmitted to the cloud layer for long-term storage, advanced analytics, feature engineering, model training, and model management. Interactive dashboards provided real-time system monitoring, alerts, reporting, and operational decision support. The cloud-edge architecture is illustrated in Supplementary Figure 2, and the implementation details are summarized in Table 3.
| Layer | Component | Hardware / Software | Specification / Version | Purpose / Description |
| Edge Layer | Edge Device | Raspberry Pi 4 / NVIDIA Jetson Nano | Quad-core CPU, 4–8 GB RAM | Real-time data acquisition and local processing |
| IoT Gateway | Industrial IoT Gateway | MQTT / Modbus / OPC-UA support | Communication between sensors and edge/cloud | |
| Sensors / Smart Meters | Digital Smart Meters | Voltage, Current, Power Measurement | Data collection from LV network | |
| Edge Software | Python, EdgeX Foundry, MQTT Broker | Python 3.x | Data preprocessing, filtering, local inference | |
| Communication Protocols | Wi-Fi / PLC / RS-485 | Standard protocols | Data transmission to cloud layer | |
| Cloud Layer | Cloud Platform | AWS / Microsoft Azure / Google Cloud | Scalable cloud services | Data storage, analytics, and model training |
| Storage | AWS S3 / Azure Blob / InfluxDB | Time-series database | Storing historical and real-time data | |
| Compute & ML | Python, TensorFlow, PyTorch, Scikit-learn | ML libraries (latest versions) | Model training, evaluation, deployment | |
| Containerization | Docker, Kubernetes | Latest stable versions | Workflow orchestration and scalability | |
| Data Processing | Apache Spark / Pandas | Distributed processing | Large-scale data analytics | |
| Visualization Layer | Dashboard Tools | Grafana / Apache Superset / Plotly Dash | Web-based tools | Real-time monitoring and visualization |
| Web Framework | React.js / Angular / Flask / FastAPI | Modern web stack | UI development and API integration | |
| Notification System | Email / SMS Gateway / Push Notifications | Twilio / Firebase | Alert generation and communication | |
| API Services | REST APIs | JSON-based communication | Integration between modules |
Table 3: System implementation details. Summary of the hardware configuration, software environment, communication protocols, and cloud–edge computing components used for implementing the proposed LV acceptance automation platform.
Dostęp ograniczony. Zaloguj się lub rozpocznij wersję próbną, aby wyświetlić tę treść.
Wyniki
The performance of the proposed Low-Voltage (LV) Acceptance Automation Platform was evaluated using the Open LV Network & Smart Meter Dataset together with a synthetic smart meter dataset generated to represent additional operating conditions and fault scenarios. The synthetic dataset enabled controlled evaluation of workflow orchestration, intelligent decision-making, and fault detection under abnormal operating conditions. The Open LV Network & Smart Meter Dataset comprised household smart meter measurements, f...
Dostęp ograniczony. Zaloguj się lub rozpocznij wersję próbną, aby wyświetlić tę treść.
Dyskusja
The experimental evaluation demonstrated that the proposed workflow-oriented Low-Voltage (LV) Acceptance Automation Platform consistently outperformed the benchmark approaches in classification, forecasting, fault detection, operational decision latency, and scalability. These performance improvements resulted from the integration of advanced feature engineering, workflow orchestration, cloud-edge collaboration, and hybrid rule-based and machine learning decision-making rather than from the use of a single machine learni...
Dostęp ograniczony. Zaloguj się lub rozpocznij wersję próbną, aby wyświetlić tę treść.
Oświadczenia
Autorzy oświadczają, że nie posiadają żadnych sprzecznych interesów finansowych lub niefinansowych.
Podziękowania
The authors thank the UK Power Networks Open Data Portal for providing the publicly available Open LV Network & Smart Meter dataset used in this study. This research received no external funding.
Dostęp ograniczony. Zaloguj się lub rozpocznij wersję próbną, aby wyświetlić tę treść.
Materiały
| Nazwa | Firma | Numer katalogowy | Komentarze |
|---|---|---|---|
| Apache Spark | Apache Software Foundation | Wersja 3.4+ | Wielkoskalowa analityka danych |
| Apache Superset | Apache Software Foundation | Wersja 3.x | Panel analityczny |
| Docker Engine | Docker Inc. | Wersja 24.x | Wdrażanie aplikacji |
| Eclipse Mosquitto MQTT Broker | Eclipse Foundation | Wersja 2.x | Wymiana danych |
| EdgeX Foundry (Jakarta Release lub nowsza) | LF Edge (Linux Foundation) | Wersja Jakarta / Geneva | Zarządzanie urządzeniami krawędziowymi |
| Flask / FastAPI | Pallets Projects / Sebastián Ramírez | Flask 2.3+ / FastAPI 0.100+ | Integracja API backendu |
| Grafana | Grafana Labs | Wersja 10.x | Wizualizacja i monitorowanie |
| Bramka Industrial IoT | Advantech / Siemens | ECU-1251 / SIMATIC IOT2040 | Komunikacja sensor-chmura |
| Czujniki IoT (czujniki napięcia/prądu) | Texas Instruments / Analog Devices | INA219 / ACS712 | Monitorowanie sieci w czasie rzeczywistym |
| Jetson Nano Developer Kit | NVIDIA Corporation | 945-13450-0000-100 | Wnioskowanie AI na krawędzi |
| Kubernetes | Cloud Native Computing Foundation (CNCF) | Wersja 1.27+ | Skalowalność przepływu pracy |
| Model LSTM (Keras/TensorFlow) | Google (TensorFlow/Keras) | Zawarty w TF 2.12+ | Predykcja i prognozowanie obciążenia |
| Moduł PLC (Power Line Communication) | STMicroelectronics | ST7580 | Komunikacja w inteligentnych sieciach energetycznych |
| Plotly Dash | Plotly Inc. | Wersja 2.x | Interaktywna wizualizacja |
| Python 3.10 | Python Software Foundation | Wersja 3.10.x | Przetwarzanie i analityka danych |
| PyTorch | Meta AI | Wersja 2.0+ | Implementacja głębokiego uczenia |
| Algorytm Random Forest | Scikit-learn | Zawarty w v1.3+ | Klasyfikacja usterek |
| Raspberry Pi 4 Model B (4GB RAM) | Raspberry Pi Foundation | RPI4-MODBP-4GB | Przetwarzanie krawędziowe |
| React.js / Angular | Meta / Google | React 18.x / Angular 16+ | Tworzenie interfejsu użytkownika |
| Moduł transceivera RS-485 | Maxim Integrated (Analog Devices) | MAX485 | Łączność z urządzeniami przemysłowymi |
| Scikit-learn | Scikit-learn Developers | Wersja 1.3+ | Modele uczenia maszynowego |
| Maszyna wektorów nośnych (SVM) | Scikit-learn | Zawarty w v1.3+ | Klasyfikacja i walidacja |
| TensorFlow | Google LLC | Wersja 2.12+ | Trenowanie modelu |
| Twilio / Firebase Cloud Messaging | Twilio Inc. / Google | Nie dotyczy | Alerty i powiadomienia |
| Moduł Wi-Fi | Espressif Systems | ESP8266 / ESP32 | Transmisja danych |
| XGBoost | DMLC (Distributed ML Community) | Wersja 1.7+ | Inteligentne wsparcie decyzji |
Bibliografia
- Tong L, Zhou J, Li J. IoT-based low-voltage power distribution system management and control platform. Front Energy Res. 2022;10:902715. https://doi.org/10.3389/fenrg.2022.902715
- Babayigit B, Abubaker M. Industrial Internet of Things: A review of improvements over traditional SCADA systems for industrial automation. IEEE Syst J. 2023;18:120–133.
- Nakagawa EY, et al. Industry 4.0 reference architectures: State of the art and future trends. Comput Ind Eng. 2021;156:107241. https://doi.org/10.1016/j.cie.2021.107241
- Ladegourdie M, Kua J. Performance analysis of OPC UA for industrial interoperability towards Industry 4.0. Internet Things. 2022;3:507–525.
- Bader SR, Maleshkova M, Lohmann S. Structuring reference architectures for the industrial Internet of Things. Future Internet. 2019;11:151. https://doi.org/10.3390/fi11070151
- Fun TS, Samsudin A. Recent technologies, security countermeasure and ongoing challenges of industrial Internet of Things (IIoT): A survey. Sensors (Basel). 2021;21:6647. https://doi.org/10.3390/s21196647
- Mirani AA, et al. Key challenges and emerging technologies in industrial IoT architectures: A review. Sensors (Basel). 2022;22:5836. https://doi.org/10.3390/s22155836
- Fraile F, et al. Reference models for digital manufacturing platforms. Appl Sci. 2019;9:4433. https://doi.org/10.3390/app9204433
- Serôdio C, et al. Software and architecture orchestration for process control in Industry 4.0 enabled by cyber-physical systems technologies. Appl Sci. 2024;14:2160. https://doi.org/10.3390/app14052160
- Ungurean I, Gaitan NC. A software architecture for the industrial Internet of Things—A conceptual model. Sensors (Basel). 2020;20:5603. https://doi.org/10.3390/s20195603
- Hsiao CH, Lee WP. OPIIoT: Design and implementation of an open communication protocol platform for industrial Internet of Things. Internet Things. 2021;16:100441. https://doi.org/10.1016/j.iot.2021.100441
- Domínguez-Bolaño T, et al. An overview of IoT architectures, technologies, and existing open-source projects. Internet Things. 2022;20:100626. https://doi.org/10.1016/j.iot.2022.100626
- Sasiain J, et al. Towards flexible integration of 5G and IIoT technologies in Industry 4.0: A practical use case. Appl Sci. 2020;10:7670. https://doi.org/10.3390/app10217670
- Cañas H, et al. A conceptual framework for smart production planning and control in Industry 4.0. Comput Ind Eng. 2022;173:108659. https://doi.org/10.1016/j.cie.2022.108659
- Cabrini FH, et al. Enabling the industrial Internet of Things to cloud continuum in a real city environment. Sensors (Basel). 2021;21:7707. https://doi.org/10.3390/s21227707
- Gabriel MF, et al. Implementation of an IoT architecture for promoting healthy air quality in 84 homes of families with children. Build Environ. 2024;266:112040. https://doi.org/10.1016/j.buildenv.2024.112040
- Silva BN, Khan M, Han K. Internet of Things: A comprehensive review of enabling technologies, architecture, and challenges. IETE Tech Rev. 2018;35:205–220.
- Dhaou ISB, et al. Internet of Things technologies for smart grid. In: Research Anthology on Smart Grid and Microgrid Development. IGI Global; Hershey; 2022. p. 805–832.
- Kondoro A, et al. A low latency secure communication architecture for microgrid control. Energies. 2021;14:6262. https://doi.org/10.3390/en14196262
- Tightiz L, Yang H. A comprehensive review on IoT protocols' features in smart grid communication. Energies. 2020;13:2762. https://doi.org/10.3390/en13112762
- Kondoro A, et al. Real-time performance analysis of secure IoT protocols for microgrid communication. Future Gener Comput Syst. 2021;116:1–12.
- Rodrigues R, et al. A review of solid-state circuit breakers. IEEE Trans Power Electron. 2020;36:364–377.
- IEEE. IEEE Std 1159-2019: IEEE recommended practice for monitoring electric power quality. IEEE; Piscataway (NJ); 2019. https://doi.org/10.1109/IEEESTD.2019.8800097
- Otcenasova A, et al. The influence of power quality indices on active power losses in a local distribution grid. Energies. 2019;12:1389. https://doi.org/10.3390/en12071389
- Ma K, et al. Review of distribution network phase unbalance: Scale, causes, consequences, solutions, and future research direction. CSEE J Power Energy Syst. 2020;6:479–488.
- Peppanen J, et al. Modeling power electronic equipment to improve distribution feeder current and voltage balance [Presentation]. Presented at: IEEE PES Transmission and Distribution Conference and Exposition (T&D); Denver, CO; 2018. Available from: https://ieeexplore.ieee.org/ https://doi.org/10.1109/TDC.2018.8440261
- Sayed S, et al. Design and realization of an open-source and modular smart meter. Energy Sci Eng. 2019;7:1405–1422.
- Satapathy LM, et al. Arduino based home automation using Internet of Things (IoT). Int J Pure Appl Math. 2018;118:769–778.
- Shaban M, et al. Design of a partially grid-connected photovoltaic microgrid using IoT technology. Appl Sci. 2021;11:11651. https://doi.org/10.3390/app112411651
- Shaban M, Dhaou IB. Design of an IoT-enabled microgrid architecture for a partial grid-connected mode [Presentation]. Presented at: 18th International Multi-Conference on Systems, Signals and Devices (SSD); Virtual; 2021. Available from: https://ieeexplore.ieee.org/ https://doi.org/10.1109/SSD52085.2021.9429443
- Taye BZ, et al. Rural electrification planning using geographic information system (GIS). Cogent Eng. 2020;7:1836730. https://doi.org/10.1080/23311916.2020.1836730
- Huld T, et al. Geospatial analysis of photovoltaic mini-grid system performance. Energies. 2017;10:218. https://doi.org/10.3390/en10020218
- Domínguez J, et al. IntiGIS-Local: A geospatial approach to assessing rural electrification alternatives for sustainable socio-economic development in isolated communities—A case study of Guasasa, Cuba. Energies. 2024;17:3835. https://doi.org/10.3390/en17153835
- Tafula JE, et al. Multicriteria decision-making approach for optimum site selection for off-grid solar photovoltaic microgrids in Mozambique. Energies. 2023;16:2894. https://doi.org/10.3390/en16062894
- Isihak S, et al. Evolution of GIS-based rural electrification planning models and an application of OnSSET in Nigeria. Renew Sustain Energy Transit. 2022;2:100019. https://doi.org/10.1016/j.rset.2022.100019
- Korkovelos A, et al. The role of open access data in geospatial electrification planning and the achievement of SDG7: An OnSSET-based case study for Malawi. Energies. 2019;12:1395. https://doi.org/10.3390/en12071395
- Cicilio P, et al. uGrid: Reliable minigrid design and planning toolset for rural electrification. IEEE Access. 2019;7:163988–163999.
- Nasir M, et al. Optimal planning and design of low-voltage low-power solar DC microgrids. IEEE Trans Power Syst. 2018;33:2919–2928.
- Vai V, et al. Optimal low-voltage distribution topology with integration of PV and storage for rural electrification in developing countries: A case study of Cambodia. J Mod Power Syst Clean Energy. 2020;8:531–539.
- Banad Y, Sharif S, Rezaei Z. Artificial intelligence and machine learning for smart grids: from foundational paradigms to emerging technologies with digital twin and large language model-driven intelligence. Energy Convers Manag X. 2025;28:101329. https://doi.org/10.1016/j.ecmx.2025.101329
- Álvarez-López C, González-Briones A, Li T. Explainable AI and multi-agent systems for energy management in IoT-edge environments: a state-of-the-art review. Electronics. 2026;15(2):385. https://doi.org/10.3390/electronics15020385
- UK Power Networks. Open data portal [Online]. Available from: https://www.ukpowernetworks.co.uk/our-company/open-data-portal (Accessed June 2026).
- Jolliffe IT. Principal Component Analysis. 2nd ed. Springer; New York; 2002. https://doi.org/10.1007/b98835
- Cortes C, Vapnik V. Support-vector networks. Mach Learn. 1995;20:273–297.
- Breiman L. Random forests. Mach Learn. 2001;45:5–32.
- Hochreiter S, Schmidhuber J. Long short-term memory. Neural Comput. 1997;9:1735–1780.
- Fawcett T. An introduction to ROC analysis. Pattern Recognit Lett. 2006;27:861–874.
- Montgomery DC, Runger GC. Applied Statistics and Probability for Engineers. 8th ed. John Wiley & Sons; Hoboken (NJ); 2020.
- Montgomery DC. Design and Analysis of Experiments. 10th ed. John Wiley & Sons; Hoboken (NJ); 2020.
Dostęp ograniczony. Zaloguj się lub rozpocznij wersję próbną, aby wyświetlić tę treść.