O ensaio de inundação de mudas facilita a rápida triagem das adesões de tomate selvagem para a resistência à bactéria Pseudomonas seringae. Este ensaio, usado em conjunto com o ensaio de crescimento bacteriano de mudas, pode auxiliar na caracterização da resistência subjacente à bactéria, e pode ser usado para mapear populações para determinar a base genética da resistência.
É necessária uma assinatura do JoVE para visualizar este conteúdo. Faça login ou inicie seu teste gratuito.
Artigo de método
Identificação de alta duração da resistência a Pseudomonas syringae pv. Tomate no Tomate usando Ensaio de Inundação de Mudas
Neste artigo
Aviso de errata
Important: There has been an erratum issued for this article. View Erratum Notice
Resumo
Resumo
O tomate é uma cultura agronômica importante que pode ser infectada pela Pseudomonas singae, uma bactéria Gram-negativa, resultando em doenças bacterianas. Otomate-P. sinringae pv. o patosistema de tomate é amplamente utilizado para dissecar a base genética das respostas inatas da planta e da resistência à doença. Embora a doença tenha sido gerida com sucesso por muitas décadas através da introdução do aglomerado genético Pto/PRF de Solanum pimpinellifolium em tomate cultivado, as cepas de raça 1 de P. sinringae evoluíram para superar a resistência conferida pelo grupo genético Pto/PRF e ocorrem em todo o mundo.
As espécies de tomate silvestre são importantes reservatórios de diversidade natural no reconhecimento de patógenos, pois evoluíram em diversos ambientes com diferentes pressões patogênicas. Em telas típicas para resistência a doenças no tomate selvagem, plantas adultas são usadas, o que pode limitar o número de plantas que podem ser rastreadas devido ao seu tempo de crescimento prolongado e maiores exigências de espaço de crescimento. Desenvolvemos um método para testar mudas de tomate de 10 dias de idade para resistência, o que minimiza o tempo de crescimento das plantas e o espaço da câmara de crescimento, permite uma rápida rotatividade de plantas e permite que grandes tamanhos de amostra sejam testados. Os desfechos de sobrevivência ou morte das mudas podem ser tratados como fenótipos discretos ou em uma escala de resistência definida pela quantidade de novo crescimento nas mudas sobreviventes após inundações. Este método foi otimizado para tela de mudas de tomate de 10 dias de idade para resistência a duas cepas p. sinringae e pode ser facilmente adaptado a outras cepas p. syringae.
Introdução
Pseudomonas sinringae é uma bactéria patogênica gram-negativa que infecta uma ampla gama de hospedeiros vegetais. As bactérias entram na planta hospedeira através dos estomatos ou feridas físicas e proliferam no apoplast1. As plantas desenvolveram uma resposta imune de duas camadas para proteger contra infecções por patógenos bacterianos. O primeiro nível ocorre na superfície celular da planta, onde receptores de reconhecimento de padrões na membrana celular vegetal percebem padrões moleculares altamente conservados associados ao patógeno (PAMPs) em um processo chamado imunidade desencadeada por PAMP (PTI)2. Durante esse processo, a planta hospedeira regula as vias de resposta à defesa, incluindo deposição de calose na parede celular, fechamento de estomatas, produção de espécies reativas de oxigênio e indução de genes relacionados à patogênese.
As bactérias podem superar o PTI utilizando um sistema de secreção tipo III para fornecer proteínas, chamadas de efeitos, diretamente na célula vegetal3. As proteínas dos efeitos geralmente visam componentes do PTI e promovem a virulência patogênica4. A segunda camada de imunidade vegetal ocorre dentro da célula vegetal após o reconhecimento das proteínas eficazes. Este reconhecimento depende de genes de resistência, que codificam a repetição de nucleotídeos que contém receptores (NLRs). As NLRs são capazes de reconhecer os efeitos diretamente ou reconhecer sua atividade em um alvo de virulência ou isca5. Eles então desencadeiam uma resposta imune secundária em um processo chamado imunidade desencadeada por efeitos (ETI), que é frequentemente associada a uma resposta hipersensível (HR), uma forma de morte celular localizada no local da infecção6. Em contraste com a resistência gene-for-gene associada ao ETI, as plantas podem apresentar resistência parcial quantitativa, que depende da contribuição de múltiplos genes7.
P. sinringae pv. tomate (Pst) é o agente causal da mancha bacteriana no tomate e é um problema agrícola persistente. As cepas predominantes no campo têm sido tipicamente cepas de raça Pst 0 que expressam ambos os efeitos tipo III AvrPto e AvrPtoB. DC3000 (PstDC3000) é uma cepa representativa de raça 0 e um modelo de patógeno que pode causar manchas bacterianas no tomate. Para combater a doença das manchas bacterianas, os criadores introgressaram o pto [P. singae pv. tomate]/ Prf [Pto resistência e sensibilidade à fenthion] aglomerado da espécie de tomate selvagem Solanum pimpinellifolium em cultivares modernas8,9. O gene Pto codifica uma quinase de proteína serina-threonine que, juntamente com o PRF NLR, confere resistência ao PstDC3000 através do reconhecimento dos efetuantes AvrPto e AvrPtoB10,11,12,13,14. No entanto, essa resistência é ineficaz contra cepas emergentes da raça 1, permitindo sua rápida e agressiva propagação nos últimos anos15,16. As cepas da raça 1 evitam o reconhecimento pelo cluster Pto/PRF, porque a AvrPto está perdida ou mutada nessas cepas, e a AvrPtoB parece acumular minimamente15,17,18.
As populações de tomate silvestre são importantes reservatórios de variação natural para a resistência pst e já foram utilizadas anteriormente para identificar potenciais loci de resistência19,20,21. No entanto, as telas atuais para resistência ao patógeno utilizam plantas adultas de 4 a 5 semanas de idade20,21. Portanto, eles são limitados pelo tempo de crescimento, espaço da câmara de crescimento e tamanhos amostrais relativamente pequenos. Para abordar as limitações das abordagens convencionais, desenvolvemos um ensaio de resistência ao tomate de alto throughput P. sinringae utilizando mudas de tomate de 10 dias de idade22. Esta abordagem oferece várias vantagens sobre o uso de plantas adultas: ou seja, menor tempo de crescimento, requisitos de espaço reduzidos e maior rendimento. Além disso, demonstramos que essa abordagem recapitula fielmente os fenótipos de resistência à doença observados em plantas adultas22.
No ensaio de inundação de mudas descrito neste protocolo, as mudas de tomate são cultivadas em placas de Petri de mídia estéril murashige e skoog (MS) por 10 dias e, em seguida, são inundadas com um inóculo contendo as bactérias de interesse e um surfactante. Após inundações, as mudas podem ser avaliadas quantitativamente para resistência à doença através de ensaios de crescimento bacteriano. Além disso, a sobrevivência ou morte das mudas pode atuar como uma resistência discreta ou fenótipo da doença 7-14 dias após a inundação. Esta abordagem oferece uma alternativa de alto rendimento para a triagem de um grande número de adesões de tomate selvagem para resistência às cepas de raça 1 do Pst, como a cepa Pst T1 (PstT1), e pode ser facilmente adaptada a outras cepas bacterianas de interesse.
Acesso restrito. Inicie sessão ou comece um teste para visualizar este conteúdo.
Protocolo
1. Preparação e uso de armário de biossegurança
- Limpe o armário de biossegurança com 70% de etanol.
- Feche a faixa e ligue a luz ultravioleta no armário de biossegurança por 15 min.
- Depois de 15 min, desligue a luz ultravioleta no armário de biossegurança. Levante a faixa e ligue o soprador por 15 min.
- Limpe todos os itens a serem usados no gabinete de biossegurança com 70% de etanol antes de colocar os itens no armário esterilizado.
- Luvas limpas ou mãos nuas com 70% de etanol antes de trabalhar no armário de biossegurança.
- Trabalhe no centro do armário de biossegurança, longe do soprador.
- Use garrafas não abertas de 10 mM MgCl2 autolaved e ultrapure H2O para experimentos. Coloque garrafas no armário de biossegurança e só abra-as apenas no armário esterilizado de biossegurança, não na bancada.
- Use pipetas de vidro dedicadas e pontas de pipeta para trabalhar no armário de biossegurança esterilizado. Certifique-se de que estes só são abertos no armário de biossegurança, nunca na bancada.
- Após o uso do armário de biossegurança, autoclave todos os resíduos (exceto resíduos de alvejante) e limpe a superfície com 70% de etanol.
2. Preparação da mídia vegetal
- Pesar e dissolver 0,5x sais basais MS em H2O. Pesar 0,8% de ágar bacto e, em seguida, adicionar a dissolvido 0,5x MS.
- Autoclave e deixe a mídia esfriar em banho de água de 50 °C por 1 h antes de derramar ou pipetting.
- Para garantir que as placas não estejam cheias demais, marque placas estéreis descartáveis de poliestireno 100 x 25 mm para um nível de enchimento de 40 mL. Despeje a mídia em placas estéreis de 100 x 25 mm em um armário de biossegurança esterilizado.
3. Preparação de materiais vegetais e condições de crescimento
- Coloque as sementes de tomate em um tubo de microcentrífuga de 2,2 mL e adicione 2,0 mL de solução alvejante de 50%.
- Balance o tubo em um roqueiro por 25 min.
- Depois de 25 min, retire as sementes do roqueiro e remova a solução de alvejante com uma pipeta no armário de biossegurança estéril. Certifique-se de que todo o alvejante está removido.
- Adicione 2 mL de H2O ultrapuro estéril para lavar as sementes. Inverta o tubo 5x.
- Remova o líquido do tubo com uma pipeta.
- Repita as etapas 3.3-3.5 para lavar as sementes 4x mais.
- Adicione 2 mL de H2O ultrapuro estéril e despeje as sementes em uma placa de Petri estéril vazia.
- Fórceps de chama no etanol e permitem esfriar antes de transferir e espaçar uniformemente as sementes em placas de 100 x 25 mm contendo 0,5x MS + 0,8% de mídia ágar.
- Transfira 5-7 sementes em uma linha no meio de uma placa e sele as bordas das placas com fita cirúrgica (1,25 cm x 9,1 m).
- Estrate as sementes esterilizadas a 4 °C no escuro por pelo menos 3 dias para sincronizar a germinação. Certifique-se de que as placas estão empilhadas planas e viradas para cima, para que as sementes não mudem sobre a placa.
- Orientar verticalmente as placas para que as raízes cresçam ao longo da superfície da placa, com a linha de sementes orientada horizontalmente, ao transferir para a câmara de crescimento.
NOTA: Coloque a câmara de crescimento a 22 °C e forneça 16 h de luz a uma intensidade leve de ~200-220 μE metro-2 s-1 e 8 h de escuridão. - Antes das inundações, plante mudas por 10 dias na câmara de crescimento em que as mudas tipicamente exibem cotiledons totalmente emergidos e expandidos e as primeiras folhas verdadeiras emergentes(Figura 1).

Figura 1: Estágio de desenvolvimento de mudas típicas de tomate de 10 dias de idade. As sementes de tomate RioGrande-PtoR foram esterilizadas, banhadas e estratificadas por pelo menos 3 dias no escuro a 4 °C. As mudas foram cultivadas em placas de MS de 0,5x por 10 dias a 22 °C antes de serem alagadas. Normalmente, em 10 dias os cotyledons são totalmente expandidos, e as primeiras folhas verdadeiras estão começando a surgir. Clique aqui para ver uma versão maior desta figura.
4. Preparação da mídia B23 (KB) do Rei
- Encha o béquer com 500 mL de H2O ultrapuro e mexa em uma placa de agitação.
- Dissolver completamente 20 g de peptoto bacto, 1,5 g de anidro K2HPO4, e 12,5 mL de glicerol em um béquer com H2O ultrapuro.
- Despeje a mistura dissolvida em um cilindro graduado de 1 L e leve até um volume final de 1 L com H2O ultrapuro.
- Despeje o caldo de volta no béquer e mexa até misturar.
- Pesar 7,5 g de ágar bacto em duas garrafas de vidro de 500 mL e adicionar 500 mL de caldo KB do passo 4.4 em cada garrafa. Autoclave por 20 min.
- Retire as garrafas da autoclave e gire suavemente para distribuir o ágar.
- Transfira as garrafas para um banho de água de 50 °C por 1h.
- Após 1h, transfira a garrafa para o armário de biossegurança e condições assépticas, adicione 1.600 μL de 1 M MgSO4estéril e antibióticos apropriados à mídia.
NOTA: Para as cepas resistentes à rifampicina PstDC3000 e PstT1, use rifampicina dissolvida em dimetilformana a uma concentração final de 50 μg/mL. Use cicloheximida dissolvida em etanol a uma concentração final de 50 μg/mL para evitar o crescimento fúngico nas placas. - Gire a mídia suavemente para misturar e, em seguida, despeje para cobrir o fundo das placas.
- Deixe pelo menos 1 h para que as placas se solidifiquem antes de armazená-las de cabeça para baixo a 4 °C.
5. Manutenção de cepas bacterianas e condições de cultura
- Manter um estoque de glicerol de uma única colônia de bactérias como 1 mL de cultura bacteriana saturada e 333 μL de glicerol estéril 80% a -80 °C.
- Bactérias de remendar (ou seja, PstT1) de um estoque de glicerol no ágar KB com antibióticos apropriados (seção 4).
- Permita que as bactérias se recuperem por 2 dias a 28 °C antes de colocar bactérias frescas no ágar KB seletivo usando um palito de dente plano e estéril.
- Streak bactérias frescas do estoque de glicerol em ágar KB seletivo apropriado usando um palito de dente plano e estéril.
NOTA: Certifique-se de que o estoque de glicerol remendado não tem mais de 2 semanas. - Para PstDC3000, incubar a placa KB a 28 °C por 24h antes de usar bactérias no experimento de inundação.
- Para PstT1, incubar a placa KB a 28 °C por 48 h antes de usar bactérias no experimento de inundação.
6. Preparação do PstT1 inoculum
- Resuspender as bactérias assepticamente em unidades de formação de 10 mM De 10 mM para uma densidade ópticaa 600 nm (OD600) de 0,1, ou aproximadamente 5 x 10⁷ unidades formadoras de colônias (UFC)/mL).
- Realize diluições seriais utilizando solução Estéril mgCl2 de 10 mM no gabinete de biossegurança. Para pstT1, use um espectrofotômetro para fazer inóculo com uma concentração inicial de OD600 = 0,1.
- Para pstT1, faça uma diluição de 1/10 da resuspensão inicial emOD 600 = 0,1 para obter uma diluição serial a uma concentração deOD 600 = 0,01.
- Utilizando a diluição serial emOD 600 = 0,01 da etapa 6.3, faça uma diluição 3/4 para obter um OD final600 = 0,0075.
- Faça uma diluição 1/10 do copolímero organosilicone não iônico C13H34O4Si3 (ou seja, surfactante) em 10 mM MgCl2 e vórtice para 15 s. Adicione o estoque de 1/10 de surfactante à última diluição serial (OD600 = 0,0075) a uma concentração final de 0,015% e gire bem para misturar.
7. Preparação do PstDC3000 inoculum
- Assepticamente resuspender bactérias em MgCl2 estéril de 10 mM para uma densidade óptica a 600 nm (OD600) de 0,1 (aproximadamente 5 x 10⁷ UFC/mL).
- Realize diluições seriais utilizando solução Estéril mgCl2 de 10 mM no gabinete de biossegurança. Para PstDC3000, use um espectrofotômetro para fazer inóculo com uma concentração inicial de OD600 = 0,1.
- Para PstDC3000, faça uma diluição de 1/10 da resuspensão inicial emOD 600 = 0,1 para obter uma diluição serial a uma concentração deOD 600 = 0,01.
- Utilizando a diluição serial emOD 600 = 0,01 do passo 3, faça uma diluição de 1/2 para obter um OD final600 = 0,005.
- Faça uma diluição de 1/10 de surfactante em 10 mM MgCl2 e vórtice para 15 s. Adicione o estoque de 1/10 de surfactante à última diluição serial (OD600 = 0,005) a uma concentração final de 0,015% e gire bem para misturar.
8. Método de inundação de mudas de tomate
- Tire as placas com as mudas de 10 dias da câmara de crescimento e coloque no armário de biossegurança para preparar as placas para inundações.
- Remova a fita cirúrgica de duas placas.
- Defina um temporizador para 3 min. Mede 6 mL de inóculo final(PstT1 OD600 = 0,0075 [seção 6] ou PstDC3000 OD600 = 0,005 [seção 7]) e transfira 6 mL de inóculo para cada placa com as mudas de 10 dias de idade.
- Empurre suavemente as mudas para baixo no inóculo com uma ponta de pipeta estéril. Comece o temporizador.
- Segure um prato em cada mão. Incline a frente da placa para baixo para acumular inóculo e, principalmente, submergir os cotiledons e folhas das mudas.
- Swish lado a lado 5-7x e, em seguida, ponta as placas de volta para cobrir as raízes e toda a placa.
- Incline as placas para baixo novamente para submergir os cotiledons e folhas, e repita por um total de 3 min.
- Despeje o inóculo das placas, coloque as placas sobre uma superfície plana e, em seguida, despeje qualquer inóculo residual uma segunda vez.
- Reembrulhe as placas com fita cirúrgica e repita os passos 8.2-8.8 para quaisquer placas restantes.
- Reincubar as placas na câmara de crescimento (ver passo 3.11 NOTA) depois de todas as placas terem sido inundadas.
- Fenótipo após 7-10 dias para PstDC3000 ou 10-14 dias para PstT1 (seção 11). Se realizar ensaios de crescimento bacteriano, colete tecido folha após 4 dias (seções 9 e 10) e, em seguida, fenótipo (seção 11). Alternativamente, realize análises phenotípicas e ensaios de crescimento bacteriano em conjuntos separados de plantas.
9. Esterilização superficial de cotiledons para ensaio de crescimento bacteriano
- Quatro dias após alagamento e reincubação das mudas na câmara de crescimento (seção 8), remova as placas com as mudas de tomate da câmara de crescimento.
- Numerar as mudas individuais no exterior inferior da placa onde a muda se prende à placa para cada genótipo.
- Rotular tubos de microcentrífuga estéril de 1,5 mL com os números de mudas individuais e usar fórceps limpos para soltar uma esfera de borosilicato estéril de 3 mm em cada tubo para uso com um batedor de contas. (Veja NOTA no passo 10.1.)
- Pipeta 200 μL de 10 mM MgCl2 em cada tubo e tubos de fechamento.
- Prepare 70% de etanol e despeje 100 mL em um copo limpo. Despeje 100 mL de H2O ultrapuro estéril em um béquer separado e limpo.
- Limpar fórceps de ponta fina em linha reta de aço inoxidável com pontas serrilhadas com etanol. Abra ligeiramente a placa para permitir a remoção asséptica de um cotiledon com os fórceps limpos.
- Aperte o petiole na base do cotiledon para remover uma folha e solte no béquer com 70% de etanol para esterilizar a superfície por 10 s. Enxágüe o cotiledon em H2O ultrapuro para 10 s.
- Coloque o cotyledon em uma toalha de papel e seque com delicados lenços científicos.
- Pesar individualmente cada cotiledon após a esterilização e manchas de superfície, e registrar o peso.
- Coloque o cotiledon em um tubo de microcentrífuga de 1,5 mL previamente preparado (das etapas 9.3 e 9.4) rotulado com o genótipo correspondente e o número individual.
- Reselar as placas com fita estéril e reincubar as mudas na câmara de crescimento (ver passo 3.11 NOTA).
10. Ensaio de crescimento bacteriano
- Utilizando amostras da etapa 9.10, homogeneize o tecido usando o batedor de tala em 10 mM MgCl2 por 1-2 min. Se o tecido não for adequadamente macerado, homogeneize novamente.
NOTA: Muitos fabricantes produzem homogeneizadores de bicos. O número e o tipo de contas, bem como o tempo de homogeneização e velocidade (se programável) devem ser otimizados para cada tipo de homogeneizador. Certifique-se de que as amostras não superaqueçam durante a homogeneização. - Adicione 800 μL de 10 mM MgCl2 a cada tubo contendo tecido macerado do passo 10.1 e inverta várias vezes para misturar.
- Preparar diluições seriais para cada amostra em 10 mM MgCl2 em 96 placa de poço (100, 10-1, 10-2, 10-3, 10-4, 10-5) usando uma pipeta multicanal(Figura 2A).
- Pipeta 5 μL de cada série de diluição usando uma pipeta multicanal em uma placa de ágar KB (150 mm x 15 mm) com cicloheximida e seleção apropriada para a cepa bacteriana de interesse (ver passo 4.8 NOTA). Deixe as placas secarem completamente.
- Incubar a placa de cabeça para baixo a 28 °C por 36 h e, em seguida, visualizar(Figura 2B) as colônias nas placas usando um microscópio dissecando para determinar se as colônias são grandes o suficiente para contar.
NOTA: Se as colônias não forem grandes o suficiente, reincuba as placas e verifique novamente o tamanho das colônias a cada poucas horas. Normalmente, as colônias são contáveis ~36-48 h após a incubação.

Figura 2: Diluições seriais para ensaios de crescimento bacteriano de mudas. (A) Otecido de folhas maceradas de plantas infectadas é diluído antes da contagem da colônia. As diluições são realizadas em uma placa de poço de 96 (100 não é diluída). Normalmente, as diluições são feitas de 10-1 a 10-5. (B)Diluições de revestimento para contagem de colônias bacterianas. Um total de 5 μL de cada coluna da série de diluição é banhado, da maioria diluída à mais concentrada. Depois que as colônias secam completamente, a placa é incubada a 28 °C por 36-48 h. As colônias são contadas um microscópio de dissecação de 10x. Clique aqui para ver uma versão maior desta figura.
- Conte as colônias um microscópio de dissecação antes de se fundirem(Figura 2B). Conte as colônias das placas da série de diluição com menos de 100 colônias.
- Após a obtenção da contagem das colônias(Figura 2B),normalize as contagens para 0,01 g de tecido para mudas e converta-se em crescimento bacteriano de troncos(Tabela 1).
NOTA: A massa média de um cotyledonMoneymaker-PtoS é de 0,01 g e é empiricamente determinada22.
| Genótipo1 Coluna A | Peso do tecido (g) Coluna B | # de Colônias em um ponto Coluna C | Fator de diluição para o ponto2 Coluna D | Ajustado # de Colônias3 Coluna E | Fator de diluição para a coluna de diluição serial F | Total # de Colônias Coluna G (cfu/0,01 g)4 | Média # de Colônias (cfu/0,01 g) Coluna H | Crescimento médio do registro (cfu/0,01 g (log10)) Coluna I |
| Amostra 1 | 0,004 g | 10 | 200 | calculado como: (C2 x 0,01 g) / B2 = 25 | 1000 | calculado como: (D2 x E2 x F2) = 5000000 | média da amostra 1 até a última amostra: (ou seja, média G1:G3) = 7000000 | log de média ou seja. log(H2) = 6,85 |
| Amostra 2 | 0,003 g | 15 | 200 | 50 | 1000 | 10000000 | ||
| Amostra 3 | 0,002 g | 6 | 200 | 30 | 1000 | 6000000 | ||
| 1 Dados mostrados para 3 amostras | ||||||||
| 2 Baseado em chapeamento 5 μL x 200 para 1 mL | ||||||||
| 3 Os cotiledons são muito pequenos para o núcleo, de modo que as contagens de colônias foram normalizadas para 0,01 g de tecido com base na massa média de um cotyledonMoneyMaker-PtoS (dados não mostrados) | ||||||||
| 4 Ajustado por mL com base no volume banhado | ||||||||
Tabela 1: Cálculos amostrais para ensaio de crescimento bacteriano de mudas. Os cálculos da amostra demonstram como normalizar a contagem bacteriana e determinar o crescimento bacteriano.
- Para adesões selvagens e outras linhas com bases genéticas complexas, correlaciona o nível de crescimento bacteriano em mudas individuais com seu fenótipo conforme descrito na seção 11.
11. Fenotipagem para resistência
- Remova as placas da câmara de crescimento e as mudas individuais de fenótipo para morte (devido à doença) ou sobrevida (devido à resistência) após 7-14 dias.
- Plantas de fenótipo infectadas com uma cepa altamente virulenta como pstDC3000 mais cedo, em 7-10 dias após a inoculação de inundação.
- Plantas de fenótipo infectadas com PstT1 em 10-14 dias após a inoculação de inundação.
- Determine um sistema de pontuação com base na gama de fenótipos de resistência observados. Registro de fenótipos binários para cultivares, linhas isogênicas e adesões selvagens com fenótipos de resistência consistentes e fortes a intermediários(Figura 4A, 4B).
- Se a muda apresentar um novo crescimento a partir do meristem apical dentro do prazo para fenotipagem, conte-a como uma sobrevivência. Se a muda tiver um meristem apical marrom e não apresentar crescimento vegetativo verde novo, conte-a como morte(Figura 3).

Figura 3: Representação esquemática de uma muda de tomate. Diferentes partes de uma muda de tomate são retratadas, incluindo o hipocotilo, cotiledons, epicotil, meristem apical e folhas verdadeiras. Clique aqui para ver uma versão maior desta figura.
- Os fenótipos registrados em um espectro de doenças para populações, como as populações de mapeamento F2, com uma ampla gama de fenótipos de resistência(Figura 4C).
- Monitore cuidadosamente as mudas para o aparecimento de sintomas da doença e morte para identificar a janela apropriada para a fenotipagem.
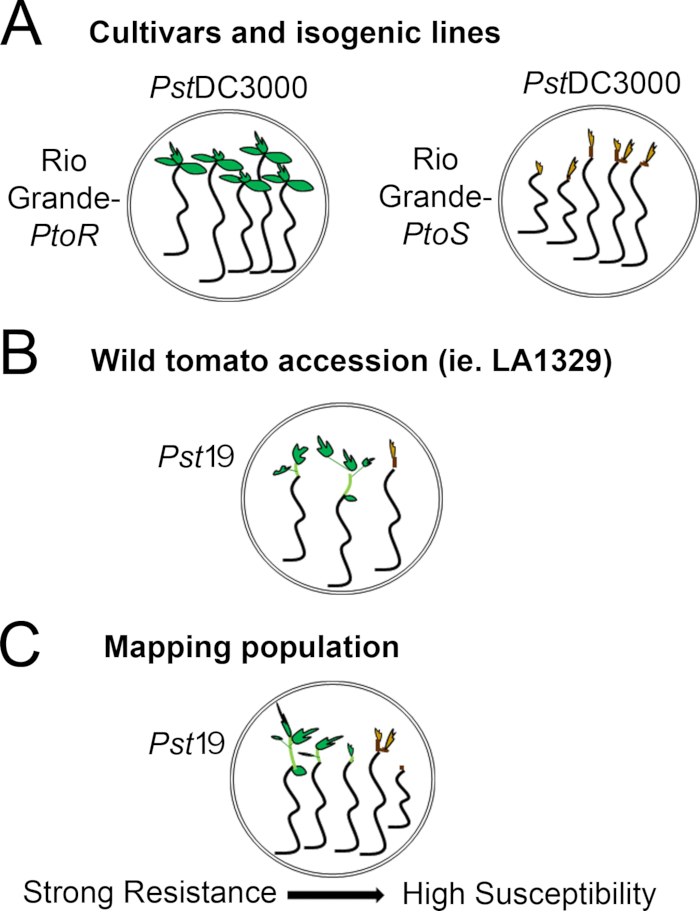
Figura 4: Representação esquemática de fenótipos esperados para resistência e morte de mudas em diversos contextos genéticos. (A) As mudas de RioGrande-PtoR e da cultivar quase isogênica RioGrande-PtoS são exibidas 7 dias após alagamento com PstDC3000 (OD600 = 0,005) + 0,015% surfactante. Rio Grande-PtoR apresenta resistência consistente, e RioGrande-PtoS apresenta suscetibilidade consistente à infecção com PstDC3000. Essas linhas dão origem a fenótipos discretos e binários. (B) As mudas de uma adesão selvagem, como o Solanum neorickii LA1329, são mostradas 10 dias após a inundação com o PstT1(OD 600 = 0,0075) + 0,015% surfactante. As mudas apresentam variabilidade fenotípica, mas foram registradas como fenótipos binários. A quantidade de variabilidade fenotípica e o método de fenotipagem (resistência binária ou espectro de resistência) dependerá da adesão particular testada. (C) Mapear populações geradas pela superação de adesões selvagens a cultivares suscetíveis pode apresentar um espectro mais amplo de fenótipos em populações segregadoras de F2. Neste caso, pode ser mais apropriado registrar fenótipos de mudas em um espectro. Mudas altamente suscetíveis de uma população de mapeamento podem ser fenotipotipadas para morte já no dia 7, quando inundadas com PstT1, e tipicamente mostram um meristem alítico marrom, não a muito pouca extensão do epicotil, e nenhum novo crescimento vegetativo verde. O meristem apical de mudas suscetíveis pode permanecer verde ou marrom muito claro por mais tempo, e pode haver alguma extensão do epicotyl e muito pouco crescimento vegetativo, que fica marrom e prende até o dia 10. As mudas individuais podem ser fenotipoadas para resistência com base na quantidade de crescimento vegetativo novo e contínuo até o dia 14. As mudas podem então ser agrupadas com base nos fenótipos descritos acima em diferentes categorias de resistência, como resistência fraca, média ou forte. Clique aqui para ver uma versão maior desta figura.
Acesso restrito. Inicie sessão ou comece um teste para visualizar este conteúdo.
Resultados
Detecção de imunidade mediada por PTORem cultivares e linhas isogênicas usando o ensaio de resistência a mudas
A Figura 5 mostra resultados representativos para as cultivares Moneymaker-PtoR e Moneymaker-PtoS 7-10 dias após a inundação com o PstDC3000. Antes da infecção, as mudas de 10 dias de idade exibiam cotyledons totalmente emergidos e expandidos e emergentes primeiras folhas verdadeiras. As mudas foram alagadas com 10 mM MgCl...
Acesso restrito. Inicie sessão ou comece um teste para visualizar este conteúdo.
Discussão
Um protocolo para inoculação de inundação com PstDC3000 ou PstT1 otimizado para detectar resistência a essas cepas bacterianas em mudas de tomate é descrito. Existem vários parâmetros críticos para os resultados ótimos no ensaio de resistência às mudas, incluindo concentração bacteriana e concentração surfactante, que foram empiricamentedeterminados 22. Para o PstDC3000, a densidade óptica foi otimizada para alcançar a sobrevida completa em uma cultivar resistente conten...
Acesso restrito. Inicie sessão ou comece um teste para visualizar este conteúdo.
Divulgações
Os autores não têm nada para revelar.
Agradecimentos
Agradecemos a Jamie Calma por testar o efeito do volume de mídia sobre os desfechos de doenças ou resistência. Agradecemos ao Dr. Maël Baudin e ao Dr. Karl J. Scheiber do Laboratório Lewis por fornecerem comentários construtivos e sugestões sobre o manuscrito. A pesquisa sobre imunidade vegetal no laboratório de Lewis foi apoiada pelo USDA ARS 2030-21000-046-00D e 2030-21000-050-00D (JDL), e pela Diretoria de Ciências Biológicas iOS-1557661 (JDL).
Acesso restrito. Inicie sessão ou comece um teste para visualizar este conteúdo.
Materiais
| Nome | Empresa | Número de catálogo | Comentários |
|---|---|---|---|
| Fita 3M Micropore 1/2" x 10 YD CS 240 (1,25 cm x 9,1 m) | VWR International | 56222-182 | |
| Esferas de vidro borossilicato de 3 mm | Friedrich & Dimmock | GB3000B | |
| Bacto peptona | BD | 211677 | |
| Bacto ágar | BD | 214010 | |
| Biofotômetro Plus | Eppendorf | E952000006 | |
| Gabinete de biossegurança, classe II tipo A2 | |||
| MARCA Cuvetes de plástico descartáveis, poliestireno | VWR International | 47744-642 | |
| Palitos de dente de madeira lisa de Chenille | Kraft VWR International | 500029-808 | |
| cicloheximida | Research Products | International C81040-5.0 | |
| Fosfato de potássio dibásico anidro, grau ACS | |||
| Etanol - 190 Prova | |||
| Falcon poliestireno 96 poços microplacas, fundo plano | Fisher Scientific | 08-772-3 | |
| Queimador de Álcool de Vidro Wick Fisher | Scientific | S41898A / No. W-125 | |
| Queimadores de Álcool de Vidro | Fisher Scientific | S41898 / No. BO125 | |
| Glicerol Reagente ACS | VWR International | EMGX0185-5 | |
| Kimberly-Clark™ Kimtech Science™ Kimwipes™ Limpadores de Tarefas Delicadas | Fisher Scientific | 06-666-A | |
| Cloreto de magnésio, grau ACS | VWR International | 97061-356 | |
| Sulfato de magnésio heptahidratado, grau ACS | VWR International | 97062-130 | |
| Tubos de microcentrífuga, Tubos | |||
| 2,2 mL | |||
| , 115 volts | Bio Spec Products Inc. | 1001 | |
| Murashige & Skoog, Sais Basais | Caisson Laboratories, Inc. | MSP01-50LT | |
| Pipet-Lite XLS LTS 8-CH Pipet 20-200uL | Rainin | L8-200XLS | |
| Pipet-Lite XLS LTS 8-CH Pipet 2-20uL | Rainin | L8-20XLS | |
| Poliestireno 100mm x 25mm placa de Petri estéril | VWR International | 89107-632 | |
| Placa de Petri estéril de poliestireno 150mm x 15mm | Fisher Scientific | FB08-757-14 | |
| Placa de Petri estéril de poliestireno 150x15mm | Fisher Scientific | 08-757-148 | |
| Pure Bright Germicidal Ultra Bleach 5,7% Cloro Disponível (definido como 100% alvejante) | Staples | 1013131 | |
| Rifampicin | Gold Biotechnology | R-120-25 | |
| Silwet L-77 (copolímero de surfactante organosilicone não iônico C13H34O4 Si3 surfactante) | Fisher Scientific | NCO138454 | |
| Tips LTS 20 μ L 960/10 GPS-L10 | Rainin | 17005091 | |
| Pontas LTS 250 μ L 960/10 GPS-L250 | Rainin | 17005093 | |
| pinça de dissecação VWR ponta fina, 4,5" | VWR International | 82027-386 |
Referências
- Underwood, W., Melotto, M., He, S. Y. Role of plant stomata in bacterial invasion. Cell Microbiology. 9 (7), 1621-1629 (2007).
- Zipfel, C. Early molecular events in PAMP-triggered immunity. Current Opinion in Plant Biology. 12 (4), 414-420 (2009).
- Galan, J. E., Wolf-Watz, H. Protein delivery into eukaryotic cells by type III secretion machines. Nature. 444 (7119), 567-573 (2006).
- Lewis, J. D., Desveaux, D., Guttman, D. S. The targeting of plant cellular systems by injected type III effector proteins. Seminars in Cell and Developmental Biology. 20 (9), 1055-1063 (2009).
- Schreiber, K. J., Baudin, M., Hassan, J. A., Lewis, J. D. Die another day: molecular mechanisms of effector-triggered immunity elicited by type III secreted effector proteins. Seminars in Cell and Developmental Biology. 56, 124-133 (2016).
- Heath, M. C. Hypersensitive response-related death. Plant Molecular Biology. 44 (3), 321-334 (2000).
- Boyd, L. A., Ridout, C., O'Sullivan, D. M., Leach, J. E., Leung, H. Plant-pathogen interactions: disease resistance in modern agriculture. Trends in Genetics. 29 (4), 233-240 (2013).
- Pitblado, R. E., MacNeill, B. H. Genetic basis of resistance to Pseudomonas syringae pv. tomato in field tomatoes. Canadian Journal of Plant Pathology. 5 (4), 251-255 (1983).
- Pedley, K. F., Martin, G. B. Molecular basis of Pto-mediated resistance to bacterial speck disease in tomato. Annual Reviews of Phytopathology. 41, 215-243 (2003).
- Ronald, P. C., Salmeron, J. M., Carland, F. M., Mehta, A. Y., Staskawicz, B. J. The cloned avirulence gene AvrPto induces disease resistance in tomato cultivars containing the Pto resistance gene. Journal of Bacteriology. 174 (5), 1604-1611 (1992).
- Martin, G. B., et al. Map-based cloning of a protein kinase gene conferring disease resistance in tomato. Science. 262 (5138), 1432-1436 (1993).
- Salmeron, J. M., Barker, S. J., Carland, F. M., Mehta, A. Y., Staskawicz, B. J. Tomato mutants altered in bacterial disease resistance provide evidence for a new locus controlling pathogen recognition. Plant Cell. 6 (4), 511-520 (1994).
- Salmeron, J. M., et al. Tomato Prf is a member of the leucine-rich repeat class of plant disease resistance genes and lies embedded within the Pto kinase gene cluster. Cell. 86 (1), 123-133 (1996).
- Scofield, S. R., et al. Molecular basis of gene-for-gene specificity in bacterial speck disease of tomato. Science. 274 (5295), 2063-2065 (1996).
- Kunkeaw, S., Tan, S., Coaker, G. Molecular and evolutionary analyses of Pseudomonas syringae pv. tomato race 1. Molecular Plant-Microbe Interactions. 23 (4), 415-424 (2010).
- Cai, R., et al. The plant pathogen Pseudomonas syringae pv. tomato is genetically monomorphic and under strong selection to evade tomato immunity. PLoS Pathogens. 7 (8), 1002130(2011).
- Almeida, N. F., et al. A draft genome sequence of Pseudomonas syringae pv. tomato T1 reveals a type III effector repertoire significantly divergent from that of Pseudomonas syringae pv. tomato DC3000. Molecular Plant-Microbe Interactions. 22 (1), 52-62 (2009).
- Lin, N. C., Abramovitch, R. B., Kim, Y. J., Martin, G. B. Diverse AvrPtoB homologs from several Pseudomonas syringae pathovars elicit Pto-dependent resistance and have similar virulence activities. Applied and Environmental Microbiology. 72 (1), 702-712 (2006).
- Rose, L. E., Langley, C. H., Bernal, A. J., Michelmore, R. W. Natural variation in the Pto pathogen resistance gene within species of wild tomato (Lycopersicon). I. Functional analysis of Pto alleles. Genetics. 171 (1), 345-357 (2005).
- Thapa, S. P., Miyao, E. M., Davis, R. M., Coaker, G. Identification of QTLs controlling resistance to Pseudomonas syringae pv. tomato race 1 strains from the wild tomato Solanum habrochaites LA1777. Theoretical and Applied Genetics. 128 (4), 681-692 (2015).
- Bao, Z. L., et al. Identification of a candidate gene in Solanum habrochaites for resistance to a race 1 strain of Pseudomonas syringae pv. tomato. Plant Genome. 8 (3), 1-15 (2015).
- Hassan, J. A., Zhou, Y. J., Lewis, J. D. A rapid seedling resistance assay identifies wild tomato lines that are resistant to Pseudomonas syringae pv. tomato race 1. Molecular Plant-Microbe Interactions. 30 (9), 701-709 (2017).
- King, E. O., Ward, M. K., Raney, D. E. Two simple media for the demonstration of pyocyanin and fluorescin. Journal of Laboratory and Clinical Medicine. 44 (2), 301-307 (1954).
- Uppalapati, S. R., et al. Pathogenicity of Pseudomonas syringae pv. tomato on tomato seedlings: phenotypic and gene expression analyses of the virulence function of coronatine. Molecular Plant-Microbe Interactions. 21 (4), 383-395 (2008).
- Bhardwaj, V., Meier, S., Petersen, L. N., Ingle, R. A., Roden, L. C. Defence responses of Arabidopsis thaliana to infection by Pseudomonas syringae are regulated by the circadian clock. PLoS One. 6 (10), 26968(2011).
- Lu, H., McClung, C. R., Zhang, C. Tick tock: circadian regulation of plant innate immunity. Annual Review of Phytopathology. 55, 287-311 (2017).
- Wang, W., et al. Timing of plant immune responses by a central circadian regulator. Nature. 470 (7332), 110-114 (2011).
Acesso restrito. Inicie sessão ou comece um teste para visualizar este conteúdo.
Reimpressões e permissões
Errata
Formal Correction: Erratum: High-Throughput Identification of Resistance to Pseudomonas syringae pv. Tomato in Tomato using Seedling Flood Assay
Posted by JoVE Editors on 10/18/2023. Citeable Link.
An erratum was issued for: High-Throughput Identification of Resistance to Pseudomonas syringae pv. Tomato in Tomato using Seedling Flood Assay. The Introduction, Protocol, Representative Results and Discussion sections were updated.
The last paragraph of the Introduction section was updated from:
In the seedling flood assay described in this protocol, tomato seedlings are grown on Petri dishes of sterile Murashige and Skoog (MS) media for 10 days and then are flooded with an inoculum containing the bacteria of interest and a surfactant. Following flooding, seedlings can be quantitatively evaluated for disease resistance via bacterial growth assays. Additionally, seedling survival or death can act as a discrete resistance or disease phenotype 7–14 days after flooding. This approach offers a high-throughput alternative for screening large numbers of wild tomato accessions for resistance to Pst race 1 strains, such as Pst strain T1 (PstT1), and can easily be adapted to other bacterial strains of interest.
to:
In the seedling flood assay described in this protocol, tomato seedlings are grown on Petri dishes of sterile Murashige and Skoog (MS) media for 10 days and then are flooded with an inoculum containing the bacteria of interest and a surfactant. Following flooding, seedlings can be quantitatively evaluated for disease resistance via bacterial growth assays. Additionally, seedling survival or death can act as a discrete resistance or disease phenotype 7–14 days after flooding. This approach offers a high-throughput alternative for screening large numbers of wild tomato accessions for resistance to Pst race 1 strains, such as Pst strain 19 (Pst19), and can easily be adapted to other bacterial strains of interest.
Step 4.8 of the Protocol section was updated from:
- After 1 h, transfer the bottle to the biosafety cabinet and under aseptic conditions, add 1,600 µL of sterile 1 M MgSO4, and appropriate antibiotics to the media.
NOTE: For rifampicin resistant strains PstDC3000 and PstT1, use rifampicin dissolved in dimethylformamide at a final concentration of 50 µg/mL. Use cycloheximide dissolved in ethanol at a final concentration of 50 µg/mL to prevent fungal growth on the plates.
to:
- After 1 h, transfer the bottle to the biosafety cabinet and under aseptic conditions, add 1,600 µL of sterile 1 M MgSO4, and appropriate antibiotics to the media.
NOTE: For rifampicin resistant strains PstDC3000 and Pst19, use rifampicin dissolved in dimethylformamide at a final concentration of 50 µg/mL. Use cycloheximide dissolved in ethanol at a final concentration of 50 µg/mL to prevent fungal growth on the plates.
Step 5.2 of the Protocol section was updated from:
- Patch bacteria (i.e., PstT1) from a glycerol stock onto KB agar with appropriate antibiotics (section 4).
to:
- Patch bacteria (i.e., Pst19) from a glycerol stock onto KB agar with appropriate antibiotics (section 4).
Step 5.6 of the Protocol section was updated from:
- For PstT1, incubate the KB plate at 28 ˚C for 48 h prior to using bacteria in the flood experiment.
to:
- For Pst19, incubate the KB plate at 28 ˚C for 48 h prior to using bacteria in the flood experiment.
Step 6 of the Protocol section was updated from:
6. Preparation of PstT1 inoculum
to
6. Preparation of Pst19 inoculum
Step 6.2 of the Protocol section was updated from:
- Perform serial dilutions using sterile 10 mM MgCl2 solution in the biosafety cabinet. For PstT1, use a spectrophotometer to make inoculum with a starting concentration of OD600 = 0.1.
to:
- Perform serial dilutions using sterile 10 mM MgCl2 solution in the biosafety cabinet. For Pst19, use a spectrophotometer to make inoculum with a starting concentration of OD600 = 0.1.
Step 6.3 of the Protocol section was updated from:
- For PstT1, make a 1/10 dilution from the initial resuspension at OD600 = 0.1 to obtain a serial dilution at a concentration of OD600 = 0.01.
to:
- For Pst19, make a 1/10 dilution from the initial resuspension at OD600 = 0.1 to obtain a serial dilution at a concentration of OD600 = 0.01.
Step 8.3 of the Protocol section was updated from:
- Set a timer for 3 min. Measure 6 mL of final inoculum (PstT1 OD600 = 0.0075 [section 6] or PstDC3000 OD600 = 0.005 [section 7]) and transfer 6 mL of inoculum to each plate with the 10-day-old seedlings.
to:
- Set a timer for 3 min. Measure 6 mL of final inoculum (Pst19 OD600 = 0.0075 [section 6] or PstDC3000 OD600 = 0.005 [section 7]) and transfer 6 mL of inoculum to each plate with the 10-day-old seedlings.
Step 8.11 of the Protocol section was updated from:
- Phenotype after 7–10 days for PstDC3000 or 10–14 days for PstT1 (section 11). If carrying out bacterial growth assays, collect leaf tissue after 4 days (sections 9 and 10) and then phenotype (section 11). Alternatively, perform phenotypic analysis and bacterial growth assays on separate sets of plants.
to:
- Phenotype after 7–10 days for PstDC3000 or 10–14 days for Pst19 (section 11). If carrying out bacterial growth assays, collect leaf tissue after 4 days (sections 9 and 10) and then phenotype (section 11). Alternatively, perform phenotypic analysis and bacterial growth assays on separate sets of plants.
Step 10.7 of the Protocol section was updated from:
- After obtaining colony counts (Figure 2B), normalize the counts to 0.01 g of tissue for seedlings and convert to log bacterial growth (Table 1).
NOTE: The average mass of one Moneymaker-PtoS cotyledon is 0.01 g and is empirically determined22.
| Genotype1 Column A | Tissue Weight (g) Column B | # of Colonies in a spot Column C | Dilution factor for spot2 Column D | Adjusted # of Colonies3 Column E | Dilution factor for serial dilution Column F | Total # of Colonies Column G (cfu/0.01 g)4 | Average # of Colonies (cfu/0.01 g) Column H | Average Log Growth (cfu/0.01 g (log10)) Column I |
| Sample 1 | 0.004 g | 10 | 200 | calculated as: (C2 x 0.01 g) / B2 = 25 | 1000 | calculated as: (D2 x E2 x F2) = 5000000 | average for sample 1 through last sample: (ie. average G1:G3) = 7000000 | log of average ie. log(H2) = 6.85 |
| Sample 2 | 0.003 g | 15 | 200 | 50 | 1000 | 10000000 | ||
| Sample 3 | 0.002 g | 6 | 200 | 30 | 1000 | 6000000 | ||
| 1Data shown for 3 samples | ||||||||
| 2Based on plating 5 µL x 200 for 1 mL | ||||||||
| 3Cotyledons are too small to core so colony counts were normalized to 0.01 g of tissue based on the average mass of one MoneyMaker-PtoS cotyledon (data not shown) | ||||||||
| 4Adjusted per mL based on volume plated | ||||||||
Table 1: Sample calculations for seedling bacterial growth assay. Sample calculations demonstrate how to normalize bacterial counts and determine log bacterial growth.
to:
- After obtaining colony counts (Figure 2B), normalize the counts to 0.1 g of tissue for seedlings and convert to log bacterial growth (Table 1).
NOTE: The average mass of one Moneymaker-PtoS cotyledon is 0.1 g and is empirically determined22.
| Genotype1 Column A | Tissue Weight (g) Column B | # of Colonies in a spot Column C | Dilution factor for spot2 Column D | Adjusted # of Colonies3 Column E | Dilution factor for serial dilution Column F | Total # of Colonies Column G (cfu/0.01 g)4 | Average # of Colonies (cfu/0.01 g) Column H | Average Log Growth (cfu/0.1 g (log10)) Column I |
| Sample 1 | 0.04 g | 10 | 200 | calculated as: (C2 x 0.1 g) / B2 = 25 | 1000 | calculated as: (D2 x E2 x F2) = 5000000 | average for sample 1 through last sample: (ie. average G1:G3) = 7000000 | log of average ie. log(H2) = 6.85 |
| Sample 2 | 0.03 g | 15 | 200 | 50 | 1000 | 10000000 | ||
| Sample 3 | 0.02 g | 6 | 200 | 30 | 1000 | 6000000 | ||
| 1Data shown for 3 samples | ||||||||
| 2Based on plating 5 µL x 200 for 1 mL | ||||||||
| 3Cotyledons are too small to core so colony counts were normalized to 0.1 g of tissue based on the average mass of one MoneyMaker-PtoS cotyledon (data not shown) | ||||||||
| 4Adjusted per mL based on volume plated | ||||||||
Table 1: Sample calculations for seedling bacterial growth assay. Sample calculations demonstrate how to normalize bacterial counts and determine log bacterial growth.
Step 11.3 of the Protocol section was updated from:
- Phenotype plants infected with PstT1 at 10–14 days after flood inoculation.
to:
- Phenotype plants infected with Pst19 at 10–14 days after flood inoculation.
Figure 4 in the Protocol section was updated from:
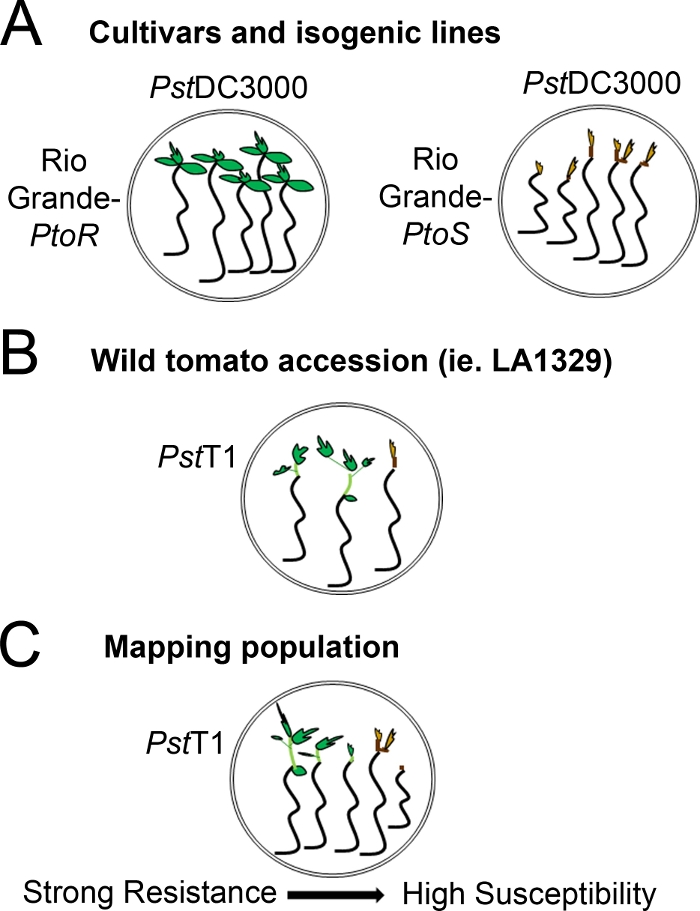
Figure 4: Schematic representation of expected phenotypes for seedling resistance and death in various genetic backgrounds. (A) Seedlings of Rio Grande-PtoR and the near-isogenic cultivar Rio Grande-PtoS are displayed 7 days after flooding with PstDC3000 (OD600 = 0.005) + 0.015% surfactant. Rio Grande-PtoR displays consistent resistance, and Rio Grande-PtoS displays consistent susceptibility to infection with PstDC3000. These lines give rise to discrete and binary phenotypes. (B) Seedlings of a wild accession, such as Solanum neorickii LA1329, are shown 10 days after flooding with PstT1 (OD600 = 0.0075) + 0.015% surfactant. Seedlings display phenotypic variability but were recorded as binary phenotypes. The amount of phenotypic variability and the method of phenotyping (binary resistance or resistance spectrum) will depend on the particular accession tested. (C) Mapping populations generated by outcrossing wild accessions to susceptible cultivars may display a wider spectrum of phenotypes in F2 segregating populations. In this case, it may be most appropriate to record seedling phenotypes on a spectrum. Highly susceptible seedlings from a mapping population may be phenotyped for death as early as day 7 when flooded with PstT1, and typically show a brown apical meristem, no to very little extension of the epicotyl, and no new, green vegetative growth. The apical meristem of susceptible seedlings may stay green or very light brown for more time, and there may be some extension of the epicotyl and very little vegetative growth, which turns brown and arrests by day 10. Individual seedlings can be phenotyped for resistance based on the amount of new and ongoing vegetative growth by day 14. Seedlings can then be grouped based on the phenotypes described above into different categories of resistance such as weak, medium, or strong resistance. Please click here to view a larger version of this figure.
to:
Figure 4: Schematic representation of expected phenotypes for seedling resistance and death in various genetic backgrounds. (A) Seedlings of Rio Grande-PtoR and the near-isogenic cultivar Rio Grande-PtoS are displayed 7 days after flooding with PstDC3000 (OD600 = 0.005) + 0.015% surfactant. Rio Grande-PtoR displays consistent resistance, and Rio Grande-PtoS displays consistent susceptibility to infection with PstDC3000. These lines give rise to discrete and binary phenotypes. (B) Seedlings of a wild accession, such as Solanum neorickii LA1329, are shown 10 days after flooding with Pst19 (OD600 = 0.0075) + 0.015% surfactant. Seedlings display phenotypic variability but were recorded as binary phenotypes. The amount of phenotypic variability and the method of phenotyping (binary resistance or resistance spectrum) will depend on the particular accession tested. (C) Mapping populations generated by outcrossing wild accessions to susceptible cultivars may display a wider spectrum of phenotypes in F2 segregating populations. In this case, it may be most appropriate to record seedling phenotypes on a spectrum. Highly susceptible seedlings from a mapping population may be phenotyped for death as early as day 7 when flooded with Pst19, and typically show a brown apical meristem, no to very little extension of the epicotyl, and no new, green vegetative growth. The apical meristem of susceptible seedlings may stay green or very light brown for more time, and there may be some extension of the epicotyl and very little vegetative growth, which turns brown and arrests by day 10. Individual seedlings can be phenotyped for resistance based on the amount of new and ongoing vegetative growth by day 14. Seedlings can then be grouped based on the phenotypes described above into different categories of resistance such as weak, medium, or strong resistance. Please click here to view a larger version of this figure.
The second paragraph of the Representative Results section was updated from:
Phenotypic screening of wild accessions using the seedling resistance assay
Figure 6 shows representative results for seedlings of susceptible and resistant accessions 10–14 days after flooding with PstT1. Susceptible accessions include RG-PtoR, S. pimpinellifolium LA1375, and S. pimpinellifolium LA1606, and resistant accessions include S. neorickii LA1329. Ten-day-old seedlings were flooded with 10 mM MgCl2 + 0.015% surfactant as a negative control, and PstT1 at an optical density of 0.0075 + 0.015% surfactant. The seedlings were phenotyped at least 10 days after flooding, as PstT1-infected seedlings died more slowly than PstDC3000-infected seedlings. Mock-inoculated seedlings were green, healthy, and actively growing. This control is important to ensure that the accessions are not sensitive to the concentration of surfactant, and to ensure there is no bacterial contamination. Susceptible accessions (Rio Grande-PtoR [n = 7], S. pimpinellifolium LA1375 [n = 7], and S. pimpinellifolium LA1606 [n = 5]) were dead, had brown apical meristems, and lacked new growth 10–14 days after inoculation with PstT1. In contrast, two S. neorickii LA1329 (n = 3) seedlings displayed a high level of new, green growth and survived infection with PstT1 (Figure 6). Three LA1329 seedlings did not germinate. Typically, 5–7 individuals were screened for each accession in a primary screen to determine the prevalence of resistance in the population. When a more genetically complex wild accession, such as LA1329, is flooded with PstT1, the resistance phenotypes display slightly more variability among individual seedlings, compared to Moneymaker-PtoR treated with PstDC3000. However, the resistance phenotypes were usually less variable than those seen in F2 mapping populations. Thus, binary phenotyping criteria was used for LA1329.
to:
Phenotypic screening of wild accessions using the seedling resistance assay
Figure 6 shows representative results for seedlings of susceptible and resistant accessions 10–14 days after flooding with Pst19. Susceptible accessions include RG-PtoR, S. pimpinellifolium LA1375, and S. pimpinellifolium LA1606, and resistant accessions include S. neorickii LA1329. Ten-day-old seedlings were flooded with 10 mM MgCl2 + 0.015% surfactant as a negative control, and Pst19 at an optical density of 0.0075 + 0.015% surfactant. The seedlings were phenotyped at least 10 days after flooding, as Pst19-infected seedlings died more slowly than PstDC3000-infected seedlings. Mock-inoculated seedlings were green, healthy, and actively growing. This control is important to ensure that the accessions are not sensitive to the concentration of surfactant, and to ensure there is no bacterial contamination. Susceptible accessions (Rio Grande-PtoR [n = 7], S. pimpinellifolium LA1375 [n = 7], and S. pimpinellifolium LA1606 [n = 5]) were dead, had brown apical meristems, and lacked new growth 10–14 days after inoculation with Pst19. In contrast, two S. neorickii LA1329 (n = 3) seedlings displayed a high level of new, green growth and survived infection with Pst19 (Figure 6). Three LA1329 seedlings did not germinate. Typically, 5–7 individuals were screened for each accession in a primary screen to determine the prevalence of resistance in the population. When a more genetically complex wild accession, such as LA1329, is flooded with Pst19, the resistance phenotypes display slightly more variability among individual seedlings, compared to Moneymaker-PtoR treated with PstDC3000. However, the resistance phenotypes were usually less variable than those seen in F2 mapping populations. Thus, binary phenotyping criteria was used for LA1329.
Figure 6 in the Representative Results section was updated from:
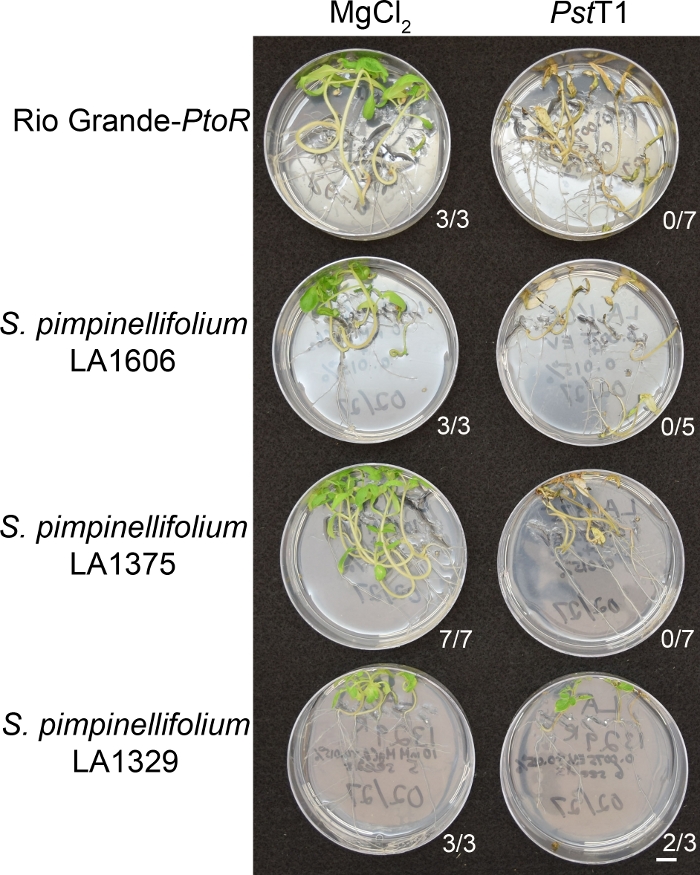
Figure 6: Phenotypic characterization of resistance or disease symptoms 10–14 days post-infection in wild accessions. Rio Grande-PtoR, S. pimpinellifolium LA1606, S. pimpinellifolium LA1375 and S. neorickii LA1329 tomato seedlings were grown on 0.5x MS plates for 10 days, and then flooded with PstT1 (OD600 = 0.0075) + 0.015% surfactant. The number of surviving seedlings for each wild accession out of the total number tested is shown. Scale bar = 1 cm. Please click here to view a larger version of this figure.
to:
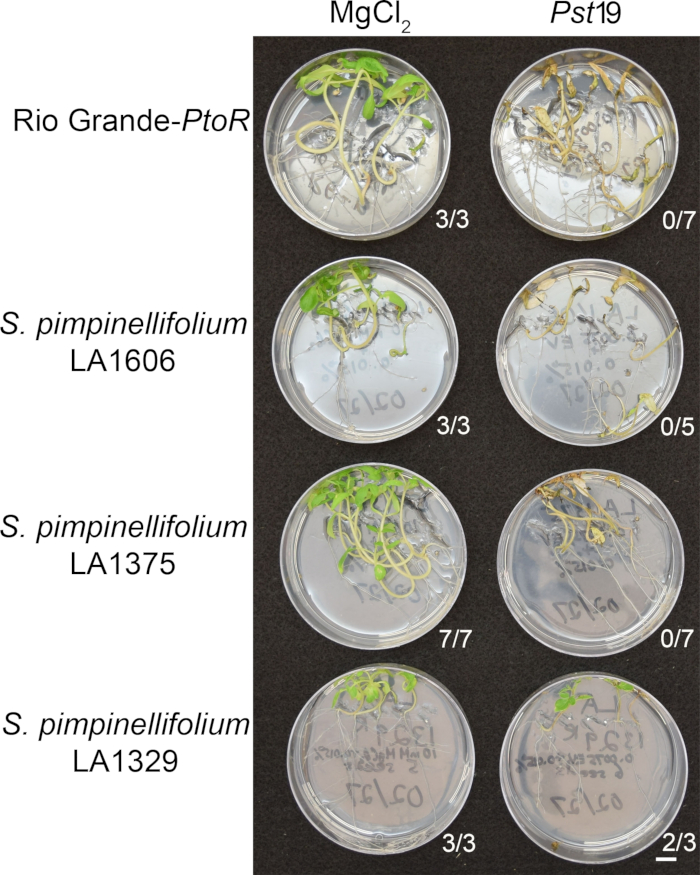
Figure 6: Phenotypic characterization of resistance or disease symptoms 10–14 days post-infection in wild accessions. Rio Grande-PtoR, S. pimpinellifolium LA1606, S. pimpinellifolium LA1375 and S. neorickii LA1329 tomato seedlings were grown on 0.5x MS plates for 10 days, and then flooded with Pst19 (OD600 = 0.0075) + 0.015% surfactant. The number of surviving seedlings for each wild accession out of the total number tested is shown. Scale bar = 1 cm. Please click here to view a larger version of this figure.
The third paragraph of the Representative Results section was updated from:
Quantitative assessment of bacterial growth using the seedling flood assay
To confirm that the observed resistance in LA1329 to PstT1 resulted in lower bacterial growth, bacterial growth assays were carried out in tomato seedlings. The level of PstT1 growth in Moneymaker-PtoS and S. neorickii LA1329 was determined 4 days post-infection. Moneymaker-PtoS is a near-isogenic line with consistent susceptibility among individual seedlings. Wild accessions such as S. neorickii LA1329 are often more genetically complex. LA1329 displays approximately 60% resistance to PstT1 across the population22. Because seedlings may drop their cotyledons after infection, one seedling was grown on each plate to correlate bacterial growth in the harvested cotyledon with overall seedling survival or death as determined phenotypically at least 10 days after flooding. The bacterial counts on day 4 for each seedling were normalized to 0.01 g of tissue and converted to log growth (CFU/0.01 g(log10)). Log growth for phenotypically resistant LA1329 seedlings (LA1329RES) or phenotypically susceptible seedlings (LA1329SUS) were separately pooled and compared to each other and the susceptible cultivar Moneymaker-PtoS. For example, there was a 1.7 log difference in bacterial growth between LA1329RES (log 6.3) and LA1329SUS (log 8.0), and a 1.6 log difference between LA1329RES (log 6.3) and Moneymaker-PtoS (log 7.9) (Figure 7). Therefore, phenotypic resistance correlated with quantitative resistance in the seedling assays.
to:
Quantitative assessment of bacterial growth using the seedling flood assay
To confirm that the observed resistance in LA1329 to Pst19 resulted in lower bacterial growth, bacterial growth assays were carried out in tomato seedlings. The level of Pst19 growth in Moneymaker-PtoS and S. neorickii LA1329 was determined 4 days post-infection. Moneymaker-PtoS is a near-isogenic line with consistent susceptibility among individual seedlings. Wild accessions such as S. neorickii LA1329 are often more genetically complex. LA1329 displays approximately 60% resistance to Pst19 across the population22. Because seedlings may drop their cotyledons after infection, one seedling was grown on each plate to correlate bacterial growth in the harvested cotyledon with overall seedling survival or death as determined phenotypically at least 10 days after flooding. The bacterial counts on day 4 for each seedling were normalized to 0.01 g of tissue and converted to log growth (CFU/0.01 g(log10)). Log growth for phenotypically resistant LA1329 seedlings (LA1329RES) or phenotypically susceptible seedlings (LA1329SUS) were separately pooled and compared to each other and the susceptible cultivar Moneymaker-PtoS. For example, there was a 1.7 log difference in bacterial growth between LA1329RES (log 6.3) and LA1329SUS (log 8.0), and a 1.6 log difference between LA1329RES (log 6.3) and Moneymaker-PtoS (log 7.9) (Figure 7). Therefore, phenotypic resistance correlated with quantitative resistance in the seedling assays.
Figure 7 in the Representative Results section was updated from:
x
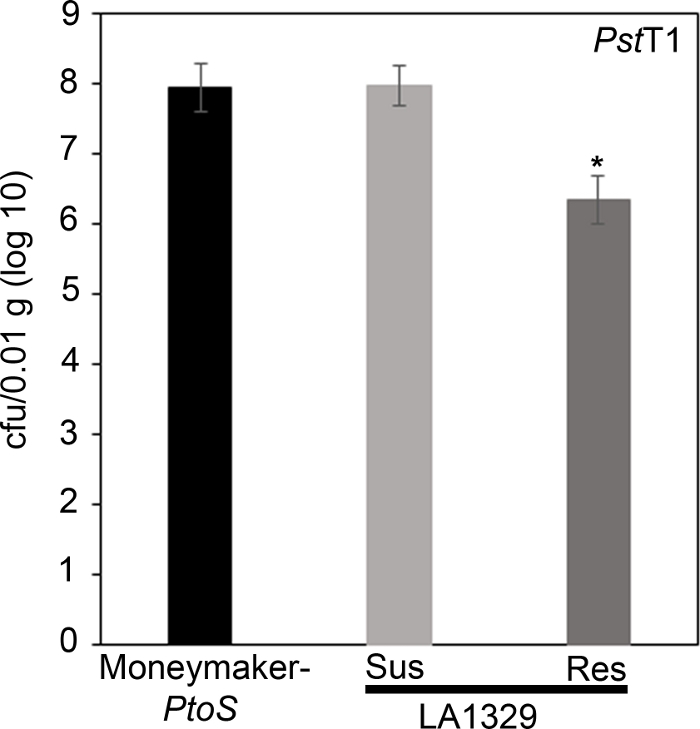
Figure 7: Resistant Solanum neorickii LA1329 seedlings support lower bacterial growth than Moneymaker-PtoS or susceptible S. neorickii LA1329. Bacterial counts were determined 4 days post-inoculation from S. neorickii LA1329 (n = 14) and Moneymaker-PtoS (n = 10) seedlings infected with PstT1 and normalization was performed to 0.01 g of tissue. For LA1329, the two phenotypic groups, susceptible (SUS) or resistant (RES), were observed and counted separately. Above the bar * = statistically significant difference determined by a one-factor analysis of variance. A general linear model procedure (p < 0.001) followed by a multiple comparison of means using Tukey's post hoc test was used. Error bars = standard error. The figure indicates one representative experiment. Please click here to view a larger version of this figure.
x
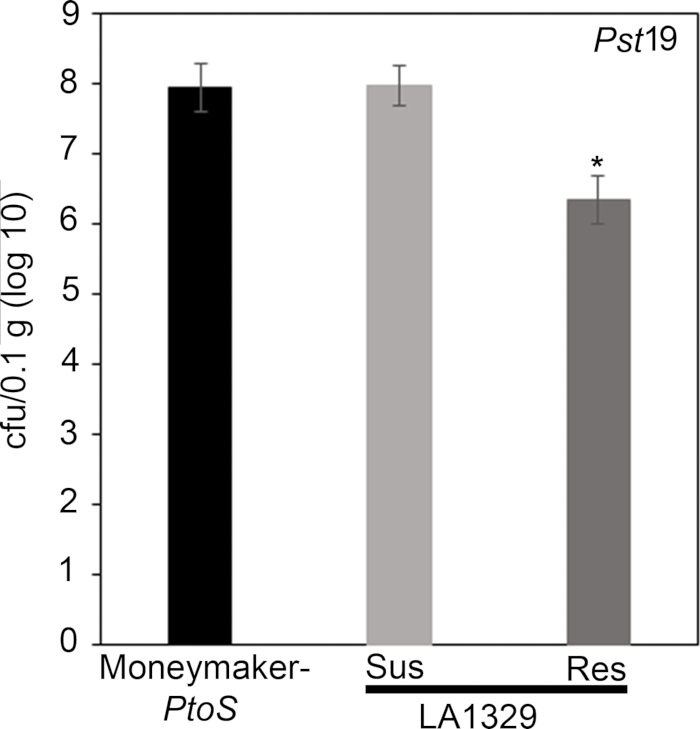
Figure 7: Resistant Solanum neorickii LA1329 seedlings support lower bacterial growth than Moneymaker-PtoS or susceptible S. neorickii LA1329. Bacterial counts were determined 4 days post-inoculation from S. neorickii LA1329 (n = 14) and Moneymaker-PtoS (n = 10) seedlings infected with Pst19 and normalization was performed to 0.1 g of tissue. For LA1329, the two phenotypic groups, susceptible (SUS) or resistant (RES), were observed and counted separately. Above the bar * = statistically significant difference determined by a one-factor analysis of variance. A general linear model procedure (p < 0.001) followed by a multiple comparison of means using Tukey's post hoc test was used. Error bars = standard error. The figure indicates one representative experiment. Please click here to view a larger version of this figure.
The first paragraph of the Discussion section was updated from:
A protocol for flood inoculation with PstDC3000 or PstT1 optimized to detect resistance to these bacterial strains in tomato seedlings is described. There are several critical parameters for optimal results in the seedling resistance assay, including bacterial concentration and surfactant concentration, which were empirically determined22. For PstDC3000, the optical density was optimized to achieve complete survival on a resistant cultivar containing the Pto/Prf cluster and complete death on a susceptible cultivar lacking the Pto/Prf cluster22. For a strain such as PstT1, where there are no known resistant varieties, the optical density was optimized to be the lowest possible for consistent and complete plant death22. Uppalapati et al.24 designed a tomato seedling assay to investigate the pathogenesis of PstDC3000 and the virulence function of coronatine. In this virulence assay, infections were performed using bacteria concentrated to an OD600 of 0.124, 20x higher than the optical density of strains used in our resistance assay. Recognition of PstDC3000 effectors AvrPto and AvrPtoB in tomato seedlings carrying the Pto/Prf gene cluster results in ETI and a macroscopic HR22. In the context of a strong immune response such as ETI, a lower bacterial titer was used for PstDC3000 to avoid overwhelming genetic resistance from the Pto/Prf gene cluster22. In addition, these results suggest that a high bacterial concentration could overwhelm weaker immune responses such as PTI or quantitative partial resistance, where multiple genes contribute to the overall phenotype. Surfactant is necessary for the bacteria to adhere to the leaf surface; however, high concentrations can cause chlorosis of the leaf22. We previously tested a range of surfactant concentrations to empirically determine the ideal concentration in 10-day-old tomato seedlings22. When testing new species that may differ in their sensitivity to surfactant, the surfactant concentration should be optimized to identify a concentration that does not cause damage or chlorosis in the absence of bacteria. Appropriate assay conditions will require optimization of a surfactant concentration that does not cause damage, and a bacterial concentration that causes disease in all susceptible controls.
to:
A protocol for flood inoculation with PstDC3000 or Pst19 optimized to detect resistance to these bacterial strains in tomato seedlings is described. There are several critical parameters for optimal results in the seedling resistance assay, including bacterial concentration and surfactant concentration, which were empirically determined22. For PstDC3000, the optical density was optimized to achieve complete survival on a resistant cultivar containing the Pto/Prf cluster and complete death on a susceptible cultivar lacking the Pto/Prf cluster22. For a strain such as Pst19, where there are no known resistant varieties, the optical density was optimized to be the lowest possible for consistent and complete plant death22. Uppalapati et al.24 designed a tomato seedling assay to investigate the pathogenesis of PstDC3000 and the virulence function of coronatine. In this virulence assay, infections were performed using bacteria concentrated to an OD600 of 0.124, 20x higher than the optical density of strains used in our resistance assay. Recognition of PstDC3000 effectors AvrPto and AvrPtoB in tomato seedlings carrying the Pto/Prf gene cluster results in ETI and a macroscopic HR22. In the context of a strong immune response such as ETI, a lower bacterial titer was used for PstDC3000 to avoid overwhelming genetic resistance from the Pto/Prf gene cluster22. In addition, these results suggest that a high bacterial concentration could overwhelm weaker immune responses such as PTI or quantitative partial resistance, where multiple genes contribute to the overall phenotype. Surfactant is necessary for the bacteria to adhere to the leaf surface; however, high concentrations can cause chlorosis of the leaf22. We previously tested a range of surfactant concentrations to empirically determine the ideal concentration in 10-day-old tomato seedlings22. When testing new species that may differ in their sensitivity to surfactant, the surfactant concentration should be optimized to identify a concentration that does not cause damage or chlorosis in the absence of bacteria. Appropriate assay conditions will require optimization of a surfactant concentration that does not cause damage, and a bacterial concentration that causes disease in all susceptible controls.
The third paragraph of the Discussion section was updated from:
Pst is a foliar pathogen that preferentially colonizes the aerial parts of tomato seedlings, including the cotyledons24 (Figure 3). Therefore, qualitative phenotyping in the seedling flood assay focuses on growth and disease symptoms in aerial portions of the seedling, and tissue for the bacterial growth assay is sampled from the cotyledons for quantitative analysis. After flood inoculation, seedlings may die within 7–10 days after inoculation with PstDC3000 or 10–14 days after inoculation with PstT1, as discussed in section 11. Seedling death is visualized by a brown apical meristem, arrested epicotyl elongation, and/or arrested vegetative growth. If different bacterial strains are used, the timing will have to be empirically determined. In addition, the progression of disease on control plants should be monitored daily after flooding until a consistent time frame from the onset of disease symptoms to seedling death can be identified. Depending on the genotypes and treatments used in the flood assay, seedling phenotypes can be recorded as binary phenotypes or on a disease spectrum (Figure 4). A broader spectrum of phenotypes may be observed when flood inoculating F2 mapping populations from wild tomato accessions crossed to susceptible cultivars (Figure 4C). It may be best to phenotype segregating populations on a disease spectrum depending on how quickly the seedling dies and the degree of new vegetative growth and branching (Figure 4C). The seedling flood assay can also be used in conjunction with the seedling bacterial growth assay to quantitatively assess levels of bacterial growth associated with qualitative phenotypes in individual seedlings (Figure 7). Very large reductions (i.e., ~log 3) in bacterial growth or strong resistance in resistant seedlings of a wild accession compared to a susceptible cultivar suggest that the underlying genetic basis of resistance may be due to ETI22. Smaller reductions in bacterial growth (i.e., ~log 1.7), as observed in LA1329 seedlings, may be due to the contribution of weaker resistance from quantitative trait loci and/or PTI. Thus, the seedling growth assay can be an important tool in further characterizing resistance in wild tomato lines.
to:
Pst is a foliar pathogen that preferentially colonizes the aerial parts of tomato seedlings, including the cotyledons24 (Figure 3). Therefore, qualitative phenotyping in the seedling flood assay focuses on growth and disease symptoms in aerial portions of the seedling, and tissue for the bacterial growth assay is sampled from the cotyledons for quantitative analysis. After flood inoculation, seedlings may die within 7–10 days after inoculation with PstDC3000 or 10–14 days after inoculation with Pst19, as discussed in section 11. Seedling death is visualized by a brown apical meristem, arrested epicotyl elongation, and/or arrested vegetative growth. If different bacterial strains are used, the timing will have to be empirically determined. In addition, the progression of disease on control plants should be monitored daily after flooding until a consistent time frame from the onset of disease symptoms to seedling death can be identified. Depending on the genotypes and treatments used in the flood assay, seedling phenotypes can be recorded as binary phenotypes or on a disease spectrum (Figure 4). A broader spectrum of phenotypes may be observed when flood inoculating F2 mapping populations from wild tomato accessions crossed to susceptible cultivars (Figure 4C). It may be best to phenotype segregating populations on a disease spectrum depending on how quickly the seedling dies and the degree of new vegetative growth and branching (Figure 4C). The seedling flood assay can also be used in conjunction with the seedling bacterial growth assay to quantitatively assess levels of bacterial growth associated with qualitative phenotypes in individual seedlings (Figure 7). Very large reductions (i.e., ~log 3) in bacterial growth or strong resistance in resistant seedlings of a wild accession compared to a susceptible cultivar suggest that the underlying genetic basis of resistance may be due to ETI22. Smaller reductions in bacterial growth (i.e., ~log 1.7), as observed in LA1329 seedlings, may be due to the contribution of weaker resistance from quantitative trait loci and/or PTI. Thus, the seedling growth assay can be an important tool in further characterizing resistance in wild tomato lines.
The fourth paragraph of the Discussion section was updated from:
Typically, genetic screens have been performed on four- to five-week-old adult tomato plants to identify the genetic basis of P. syringae resistance in wild accessions20,21. Adult tomato plants require much longer growth times, require more space in the growth chamber, and are much larger plants, which means that usually few individuals are screened for each line. The seedling flood assay provides a powerful, alternative approach in the identification of P. syringae resistance in wild tomato accessions. Screening at the seedling stage permits a large sample size to be tested which can be particularly advantageous in detecting resistance in genetically complex populations. Reduced growth chamber space requirements and growth time facilitate a high-throughput approach and rapid detection of natural resistance in wild accessions to emerging pathogens. Furthermore, P. syringae resistance that was identified at the seedling stage in this assay is not restricted to the developmental stage. S. neorickii LA1329 and S. habrochaites LA1253 were initially identified at the seedling stage and also display resistance to PstT1 in adult plants as previously described22.
to:
Typically, genetic screens have been performed on four- to five-week-old adult tomato plants to identify the genetic basis of P. syringae resistance in wild accessions20,21. Adult tomato plants require much longer growth times, require more space in the growth chamber, and are much larger plants, which means that usually few individuals are screened for each line. The seedling flood assay provides a powerful, alternative approach in the identification of P. syringae resistance in wild tomato accessions. Screening at the seedling stage permits a large sample size to be tested which can be particularly advantageous in detecting resistance in genetically complex populations. Reduced growth chamber space requirements and growth time facilitate a high-throughput approach and rapid detection of natural resistance in wild accessions to emerging pathogens. Furthermore, P. syringae resistance that was identified at the seedling stage in this assay is not restricted to the developmental stage. S. neorickii LA1329 and S. habrochaites LA1253 were initially identified at the seedling stage and also display resistance to Pst19 in adult plants as previously described22.
Explorar mais artigos
Ensaio de Inundação de Plântulas de TomateResistência a Pseudomonas SyringaeTriagem de Alto RendimentoAcessões de Tomate SelvagemProtocolo de Inoculação de PlântulasEnsaios de Crescimento BacterianoCluster Gênico Pto/PrfFenotipagem de Resistência a DoençasMétodo de Esterilização de SementesCondições de Câmara de Crescimento
