A plataforma automatizada de aceitação em baixa tensão proposta integra a Internet das Coisas (IoT), orquestração visual de fluxos de trabalho, computação em nuvem e de borda, engenharia de características e aprendizado de máquina para automatizar os testes de aceitação em sistemas de baixa tensão (LV). A plataforma permite detecção inteligente de falhas, tomada de decisão em tempo real, aceitação automatizada, alta precisão, baixa latência operacional e implantação escalável.
É necessária uma assinatura do JoVE para visualizar este conteúdo. Faça login ou inicie seu teste gratuito.
Artigo de investigação
Uma Plataforma de Automação de Aceitação de Baixa Tensão Orientada a Processos com Orquestração de Fluxo de Trabalho Visual e Validação por Aprendizado de Máquina
Neste artigo
Resumo
Resumo
The rapid expansion of low-voltage (LV) networks and their integration with distributed energy resources requires intelligent and automated management solutions. Cloud-edge collaborative Internet of Things (IoT) platforms support real-time monitoring, control, and data acquisition. However, existing platforms generally lack workflow automation, visual process orchestration, user-guided decision support, and comprehensive validation. Consequently, they do not provide process-driven solutions for automated LV network acceptance testing. This study presents the design and evaluation of a Low-Voltage Acceptance Automation Platform based on a visualized process canvas. The proposed platform adopts a process-driven architecture in which acceptance workflows are visually created, managed, and executed. The visual process canvas transforms conventional static monitoring into dynamic workflow automation by enabling real-time workflow execution, validation, and decision-making. The framework incorporates the Open LV Network & Smart Meter dataset to support realistic modeling of electrical load behavior. The workflow includes IoT-based data acquisition, data preprocessing, feature engineering, workflow orchestration using the visual process canvas, machine learning-based validation, and real-time dashboard visualization. The proposed framework achieved a fault detection rate of 98.4%, a receiver operating characteristic area under the curve (ROC-AUC) of 0.968, and an operational decision latency of 31 ms, outperforming traditional cloud-centric and IoT-based baseline approaches by approximately 30%–40%.
Introdução
A Indústria 4.0 (I4.0)1 é viabilizada por diversas tecnologias emergentes, dentre as quais a Internet Industrial das Coisas (IIoT) é uma das mais importantes. A IIoT refere-se à aplicação de tecnologias da Internet das Coisas (IoT) em ambientes industriais, onde dispositivos e máquinas interconectados se comunicam principalmente por meio de interações máquina-a-máquina. Como falhas em sistemas industriais podem resultar em perdas operacionais significativas, as aplicações de IIoT exigem comunicação altamente confiável, além de gerar volumes substancialmente maiores de dados do que os sistemas convencionais de IoT2. Além disso, alguns estudos consideram a IIoT um conceito intimamente relacionado à Indústria 4.03. As tecnologias IoT estão transformando arquiteturas hierárquicas tradicionais ao permitir sistemas mais flexíveis com troca de dados contínua4. Inúmeros estudos recentes revisaram arquiteturas IIoT existentes e propuseram novos designs de estruturas5,6,7,8,9. Apesar desses avanços, duas limitações principais permanecem. Primeiro, novas estruturas são frequentemente propostas para superar as deficiências das arquiteturas anteriores, resultando em um número crescente de modelos alternativos que aumentam a diversidade arquitetônica e a complexidade de implementação. Segundo, o alto nível de abstração associado a muitas arquiteturas propostas limita sua adoção prática em ambientes industriais10.
Várias arquiteturas de IIoT foram relatadas na literatura. Uma arquitetura de IIoT baseada no padrão Open Platform Communications (OPC) foi apresentada em conjunto com um middleware em Python para gerenciar a comunicação OPC11. Uma arquitetura de IIoT em sete camadas foi proposta em; no entanto, detalhes de implementação e experimentos de validação não foram fornecidos12. Um framework que integra tecnologias 5G e IIoT foi descrito em conjunto com um caso de uso representativo, embora a validação experimental tenha sido limitada13. Um framework de design emocional para a Indústria 4.0 foi introduzido, e suas possíveis implicações foram discutidas sem verificação experimental14. Uma plataforma de IIoT em múltiplas camadas foi avaliada em um ambiente de testes no mundo real, com ênfase em considerações de telecomunicações15. De forma semelhante, um framework modular de IoT para monitoramento da qualidade do ar interno foi apresentado e seu desempenho foi avaliado utilizando dados coletados de 84 domicílios com crianças16.
A Internet das Coisas (IoT) tornou-se uma tecnologia em rápida evolução com grande potencial de aplicação no setor de energia elétrica17,18. A integração de tecnologias IoT nos nós do sistema elétrico permite uma geração, transmissão, distribuição, operação e utilização de energia mais inteligentes e eficientes, por meio de tomada de decisões autônomas apoiadas pelo monitoramento contínuo em tempo real do fluxo de eletricidade dentro da rede inteligente. Consequentemente, esses nós inteligentes melhoram o desempenho operacional geral da rede elétrica19. A tecnologia de comunicação representa um componente fundamental da implementação da rede inteligente, pois duas categorias principais de informações precisam ser transmitidas com confiabilidade: medições de sensores e sinais de controle. Além da baixa latência na comunicação, as aplicações em redes inteligentes exigem uma qualidade de serviço (QoS) adequada e segurança suficiente dos dados para garantir operação confiável20.
A seleção de uma tecnologia de comunicação apropriada para aplicações em redes inteligentes exige a consideração de intervalos de comunicação, taxas de transmissão de dados e custos de comunicação21. As redes de comunicação IoT normalmente compreendem camadas de software, segurança, serviço, sistema e conectividade. Na camada de conectividade, os protocolos de comunicação são geralmente classificados em três categorias. Os protocolos de longo alcance incluem Long Range (LoRa) e Narrowband-IoT (NB-IoT); os protocolos de médio alcance incluem Wi-Fi, 4G/LTE e 5G; e os protocolos de curto alcance incluem Bluetooth e ZigBee. À medida que os mercados de eletricidade se tornaram cada vez mais desregulamentados, a previsão de carga tornou-se mais importante para avaliar os efeitos das condições climáticas, falhas de equipamentos, mudanças regulatórias e outros fatores operacionais sobre o custo dos serviços elétricos. Consequentemente, a previsão precisa de carga residencial tornou-se essencial para a operação e supervisão de redes inteligentes, microrredes e edifícios inteligentes22.
O funcionamento confiável de redes de baixa tensão (BT) depende da manutenção de alta qualidade de energia23. A qualidade de energia é determinada pela eficácia da regulação de tensão, equilíbrio de corrente e mitigação de distúrbios técnicos sob condições operacionais desequilibradas24. Dentre esses fatores, o balanceamento de fases é particularmente importante, pois determina a distribuição uniforme de tensões e correntes entre as fases25. Um mau balanceamento de fases pode aumentar o aquecimento dos condutores, as variações de tensão e as correntes no neutro, reduzindo assim a eficiência do sistema e sua confiabilidade operacional26. Consequentemente, o balanceamento de fases deve ser considerado durante o processo de projeto, a fim de melhorar o desempenho do sistema, a estabilidade operacional e a confiabilidade a longo prazo. No entanto, esse aspecto raramente é incorporado nas metodologias convencionais de projeto de microrredes.
Avanços recentes em sistemas de orquestração de fluxo de trabalho demonstraram os benefícios da automação orientada a eventos e do gerenciamento visual de processos em ambientes de IoT industrial. No entanto, sua aplicação à validação de redes de distribuição e testes de aceitação em baixa tensão permanece limitada. A maioria dos sistemas de automação em baixa tensão existentes concentra-se principalmente em monitoramento e controle supervisório, enquanto estudos comparativamente poucos investigam o gerenciamento de aceitação orientado a fluxos de trabalho ou a verificação automatizada de conformidade. Da mesma forma, embora técnicas de aprendizado de máquina tenham atraído considerável atenção para detecção de anomalias em medidores inteligentes e avaliação da qualidade de energia, essas abordagens são geralmente desenvolvidas como modelos analíticos independentes, em vez de componentes de uma estrutura integrada de orquestração de fluxo de trabalho.
Várias soluções de medidores inteligentes de energia para gestão de edifícios inteligentes e automação residencial foram propostas nos últimos anos27. Um protótipo de medidor inteligente foi apresentado na referência27 para demonstrar a integração de conceitos educacionais de nível universitário nas tecnologias de medição inteligente. O medidor inteligente desenvolvido exibiu grande potencial para gestão e controle de energia, reduzindo o consumo energético e beneficiando tanto as concessionárias quanto os consumidores por meio de comunicação IoT bidirecional. Um sistema de tomada inteligente baseado em microcontrolador foi posteriormente introduzido para apoiar o monitoramento inteligente de energia28.
O sistema proposto de plugue inteligente exibe o consumo de energia em tempo real por meio de uma interface gráfica baseada em Android. Além disso, o dispositivo pode detectar a presença de aparelhos elétricos conectados, uma capacidade denominada medição invasiva de carga28. Um plugue inteligente comercial de baixo custo foi utilizado para a implementação. Melhorias futuras incluem o monitoramento da corrente eficaz (RMS), potência ativa, potência reativa e o ângulo de fase entre tensão e corrente. Conforme descrito em nossos estudos anteriores, uma microrrede fotovoltaica parcialmente conectada à rede utiliza os protocolos de comunicação ZigBee e LoRa para trocar informações com dispositivos de medidores inteligentes, demonstrando a viabilidade da comunicação habilitada para IoT em sistemas de energia distribuídos29,30.
Para abordar as limitações do planejamento convencional de sistemas de distribuição, a prática de engenharia e a pesquisa científica avançaram em várias direções complementares. Uma direção de pesquisa tem-se concentrado no planejamento de alto nível utilizando sistemas de informação geográfica (SIG) para seleção de locais e avaliação preliminar de recursos31,32. Outra direção tem-se concentrado na melhoria de componentes e subsistemas individuais, incluindo seleção de condutores, dimensionamento ótimo de geração e armazenamento de energia, e avaliações comparativas de sistemas de distribuição em corrente alternada (CA) e corrente contínua (CC)33,34,35,36. Uma terceira direção de pesquisa tem aplicado algoritmos de otimização ao planejamento de redes de distribuição, roteamento de alimentadores e projeto de topologia de rede. Desenvolvimentos recentes incluem estruturas como a plataforma uGrid dos pesquisadores, que integra posicionamento de dispositivos e configuração de rede, mas carece de uma análise padrão de fluxo de potência para verificação e otimização. Outras abordagens dependem do ajuste manual de parâmetros para geração de topologia ou concentram-se em aplicações especializadas, como microrredes CC de baixa potência37,38,39. Embora essas abordagens representem um progresso significativo, trabalhos adicionais são necessários para estabelecer uma metodologia integrada para o projeto completo de sistemas de distribuição de baixa tensão. Além disso, avaliações técnico-econômicas abrangentes de sistemas de baixa tensão monofásicos, trifásicos e híbridos permanecem limitadas.
Avanços recentes na inteligência artificial (AI) e no aprendizado de máquina expandiram ainda mais as capacidades dos sistemas de energia inteligentes. Uma revisão abrangente apresentada sumarizou aplicações de inteligência artificial e aprendizado de máquina em redes elétricas inteligentes, incluindo tecnologias emergentes como Aprendizado Federado, IA Generativa, Modelos de Linguagem de Grande Porte, Internet das Coisas com Inteligência Artificial (AIoT) e Gêmeos Digitais40. A revisão destacou aplicações na previsão de carga, manutenção preditiva, detecção de anomalias, gestão do lado da demanda e integração de veículos elétricos, enfatizando desafios contínuos relacionados à interoperabilidade, privacidade, escalabilidade, robustez e considerações éticas. Outra revisão recente avaliou métodos de IA para gestão distribuída de energia em infraestruturas IoT-edge-cloud, com foco em aprendizado de máquina, aprendizado por reforço e sistemas multiagente para controle descentralizado de energia41.
Coletivamente, estudos anteriores avançaram no monitoramento habilitado por IoT, medição inteligente, computação nuvem-borda, inteligência artificial e gerenciamento inteligente de energia para sistemas de distribuição de baixa tensão (LV). No entanto, essas tecnologias foram amplamente desenvolvidas de forma independente. A orquestração de fluxos de trabalho, o gerenciamento automatizado de aceitação, a validação orientada por processos e o suporte integrado à tomada de decisão ainda são limitados, destacando a necessidade de um framework unificado de automação orientado a fluxos de trabalho.
Assim, este estudo apresenta uma Plataforma de Automação de Aceitação em Baixa Tensão baseada em uma Tela de Processo Visualizada. A estrutura proposta integra a aquisição de dados baseada em IoT, pré-processamento de dados, engenharia de características, orquestração de fluxo de trabalho, validação baseada em aprendizado de máquina, computação nuvem-borda e visualização em tempo real dentro de uma arquitetura unificada, para apoiar testes automatizados e confiáveis de aceitação em redes de BT utilizando dados reais de medidores inteligentes. Figura 1 apresenta uma visão geral da arquitetura orientada a fluxo de trabalho da plataforma proposta. O fluxo de trabalho compreende aquisição de dados, pré-processamento, engenharia de características, orquestração de fluxo de trabalho, tomada de decisão inteligente e integração nuvem-borda, permitindo a validação automatizada de redes de distribuição em BT por meio de uma estrutura orientada a processos. A plataforma demonstrou alta precisão de validação, ao mesmo tempo que reduziu a latência na tomada de decisões operacionais e o tempo de execução do fluxo de trabalho em comparação com abordagens convencionais.
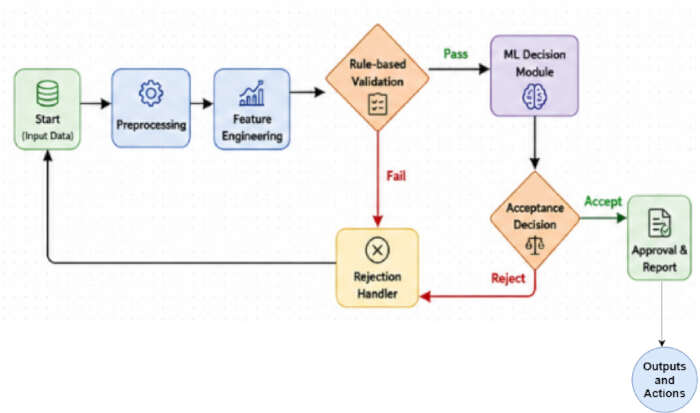
Figura 1. Arquitetura orientada a fluxo de trabalho da plataforma proposta de automação para aceitação em baixa tensão. Arquitetura de alto nível da plataforma proposta de automação para aceitação em baixa tensão (LV) orientada a processos. O framework ilustra a integração sequencial da aquisição de dados habilitada por IoT, pré-processamento de dados, engenharia de características, orquestração de fluxo de trabalho, tomada de decisão inteligente, colaboração nuvem-borda e aceitação automatizada para validação de redes de distribuição em baixa tensão. IoT = Internet of Things; LV = low voltage; ML = machine learning. Clique aqui para visualizar uma versão maior desta figura.
Acesso restrito. Inicie sessão ou comece um teste para visualizar este conteúdo.
Protocolo
This study did not involve human participants, animals, or identifiable personal data. The analyses were performed using a publicly available dataset (UK Power Networks Open LV Network & Smart Meter dataset) together with synthetically generated data for validation; therefore, ethics committee approval and informed consent were not required. The research tools used in the protocol are listed in the Table of Materials.
1. Data acquisition
The Low-Voltage (LV) Acceptance Automation Platform was developed using electrical measurements acquired from smart meters, IoT sensors, and the Open LV Network & Smart Meter Dataset. Electrical parameters, including voltage, current, active power, reactive power, and energy consumption, were collected through Wi-Fi-, PLC-, and RS-485-based communication protocols. Real-time measurements were used for live system monitoring, whereas historical data supported model development and validation.
The proposed framework used the Open LV Network & Smart Meter Dataset provided by UK Power Networks42. The dataset comprises household smart meter consumption, feeder-level load profiles, and feeder voltage measurements. Time-series subsets containing load consumption and voltage data were selected for model training and evaluation. In addition, a simulated smart meter dataset was generated to represent operational conditions and fault scenarios required for workflow validation and machine learning model evaluation. The simulated dataset included timestamped measurements of voltage, current, active power, reactive power, energy consumption, total harmonic distortion (THD), and voltage imbalance. Fault samples were generated by simulating undervoltage, overvoltage, excessive harmonic distortion, and voltage imbalance based on established low-voltage operational thresholds. The dataset characteristics are summarized in Table 1.
| Attribute | Description |
| Dataset Name | Open LV Network & Smart Meter Dataset |
| Simulated Smart Meter Dataset | Geneated 1000 smaples for Fault simulation and workflow validation |
| Data Type | Time-series (historical smart meter data) |
| Data Granularity | Household-level and feeder-level measurements |
| Key Features | Voltage, current, active power, reactive power, energy consumption, timestamps |
| Data Frequency | High-resolution (e.g., half-hourly / minute-level depending on subset) |
| Coverage | Residential low-voltage distribution networks |
| Usage in Proposed Work | Model training, validation, load behavior analysis, and acceptance workflow evaluation |
Table 1: Dataset description. Summary of the Open LV Network & Smart Meter dataset used for model development and performance evaluation. The table presents the dataset components, measured electrical variables, sampling characteristics, and dataset partitioning for training, validation, and testing.
Because the Open LV Network & Smart Meter Dataset does not contain predefined fault labels, a rule-based labeling strategy was applied to both the real and simulated datasets. Samples satisfying normal operating limits were assigned a label of 0 (Normal), whereas samples exceeding operational thresholds (e.g., voltage deviations greater than ±10% of the nominal voltage, THD > 5%, or voltage unbalance > 2%) were assigned a label of 1 (Fault). These labels served as the ground truth during model training, validation, and testing. The proposed rule engine also allows threshold values to be configured in accordance with regional standards or utility-specific acceptance criteria.
The dataset was partitioned into training (70%), validation (15%), and testing (15%) subsets. Missing values were addressed using linear interpolation, mean imputation, and forward-fill techniques as described in the preprocessing stage. To ensure statistical robustness and reproducibility, all experiments were repeated five times using different random seeds.
2. Data preprocessing
Raw data from the Open LV Network & Smart Meter Dataset and IoT sensor measurements were preprocessed to improve data quality prior to feature extraction and model development. Missing values, noise, and inconsistencies caused by communication interruptions and sensor malfunctions were identified and corrected using interpolation, mean imputation, and forward-fill techniques. The detailed mathematical derivations are provided in Supplementary File 1 (Section S1).
The preprocessed time-series data were segmented into representative operational intervals (S₁–S₅ and Sk). Statistical and electrical features, including average load, peak load, minimum load, standard deviation, voltage deviation, and power consumption, were extracted from each segment. The extracted features are summarized in Table 2 and served as inputs for the subsequent feature engineering stage.
| Segment ID | Mean Load (kW) | Peak Load (kW) | Min Load (kW) | Std Deviation (kW) | Voltage Deviation (p.u.) | Power Consumption (kWh) | Time Interval |
| S₁ | 2.45 | 3.8 | 1.2 | 0.65 | 0.032 | 58.4 | 00:00–01:00 |
| S₂ | 2.9 | 4.1 | 1.5 | 0.72 | 0.028 | 64.2 | 01:00–02:00 |
| S₃ | 3.25 | 4.85 | 1.8 | 0.81 | 0.035 | 71.6 | 02:00–03:00 |
| S₄ | 3.8 | 5.2 | 2.1 | 0.9 | 0.041 | 78.9 | 03:00–04:00 |
| S₅ | 4.1 | 5.75 | 2.4 | 0.95 | 0.045 | 85.3 | 04:00–05:00 |
| Sk | 3.6 | 5.1 | 2 | 0.88 | 0.038 | 76.5 | tk |
Table 2: Representative feature representation extracted from time-series segments. Representative statistical, electrical, load behavior, voltage stability, and power quality features extracted from segmented LV time-series data during feature engineering. The values illustrate the engineered feature representation and are not experimental performance results. LF = Load Factor; PAR = Peak-to-Average Ratio; VSI = Voltage Stability Index; PF = Power Factor; THD = Total Harmonic Distortion.
3. Feature engineering
Feature engineering was performed to improve the representation of the preprocessed data for workflow orchestration and intelligent decision-making. Principal Component Analysis (PCA)^43 was applied to reduce data dimensionality by removing redundant and highly correlated variables while retaining the most informative feature components. The mathematical derivations are provided in Supplementary File 1 (Section S2).
Statistical descriptors, load behavior indicators, voltage stability indices, and power quality metrics were derived from the segmented time-series data. These engineered features included Load Factor (LF), Peak-to-Average Ratio (PAR), Voltage Stability Index (VSI), Voltage Unbalance Index, Power Factor (PF), and Total Harmonic Distortion (THD). The resulting feature set was used as the input to the workflow orchestration and intelligent decision-making modules.
The feature engineering workflow is summarized in Supplementary File 1 (Supplementary Algorithm 1). The procedure consisted of segmenting the preprocessed data, extracting statistical and electrical features, calculating load behavior, voltage stability, and power quality indicators, and applying PCA to generate the final feature vector used for model training and validation.
4. Visualized process canvas design
The Visualized Process Canvas was developed as a graph-based workflow orchestration framework for automating low-voltage (LV) acceptance procedures. The workflow was represented as a directed graph, G = (N, E), where N = {n1, n2, …, nm}denotes the workflow nodes corresponding to individual processing stages (e.g., data input, preprocessing, validation, and decision-making), and E = {eij}represents the directed edges defining the execution sequence between nodes. This graph-based representation enabled the creation of configurable workflows and their automated execution without manual coding.
Each workflow node performed a specific processing task by receiving input data, executing predefined operations, and forwarding the processed output to subsequent nodes. Acceptance criteria, including voltage and load thresholds, were implemented as configurable validation rules that could be updated without modifying the workflow structure. The workflow supported both sequential and parallel execution to improve computational efficiency. Machine learning models were integrated into designated workflow nodes to perform anomaly detection and automated acceptance validation (Figure 2).
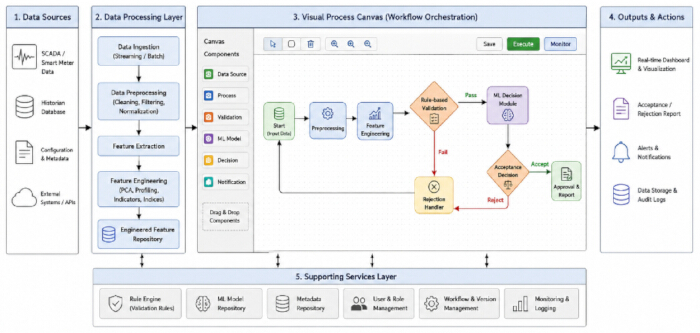
Figure 2: Visualized process canvas architecture for LV acceptance automation. Overview of the visual workflow orchestration framework used for LV acceptance automation. The process canvas illustrates the graphical organization of workflow nodes for data processing, feature engineering, rule-based validation, intelligent decision-making, and output generation to support workflow design, execution, and monitoring. Please click here to view a larger version of this figure.
The mathematical formulation describing information flow through the workflow graph is provided in Supplementary File 1 (Section S3). Supplementary File 1 (Supplementary Algorithm 2) describes the workflow orchestration procedure, including workflow traversal, node execution, rule validation, decision generation, and output aggregation.
The Visualized Process Canvas was implemented using a microservice-oriented software architecture to support scalability and modular deployment. The graphical workflow interface was developed using React.js to provide drag-and-drop workflow configuration. Backend orchestration services were implemented using Flask/FastAPI, while Eclipse Mosquitto served as the MQTT message broker for communication between workflow modules. EdgeX Foundry provided edge device management and IoT integration. Machine learning services were implemented with Scikit-learn, TensorFlow, and PyTorch, and containerized with Docker and Kubernetes.
5. Workflow orchestration engine
The workflow orchestration engine coordinated execution of the configured acceptance workflow. A detailed description is provided in Supplementary File 1 (Section S4), and the execution sequence is summarized in Supplementary Figure 1.
The workflow execution process consisted of validating the workflow definition, initializing the execution environment, scheduling workflow nodes according to their dependencies, executing nodes sequentially or in parallel, applying rule-based validation, aggregating intermediate outputs, and generating the final acceptance or rejection decision based on rule-based and machine learning evaluation. Execution results were published through dashboards, reports, application programming interfaces (APIs), and data storage services. The overall workflow orchestration process is illustrated in Figure 3.
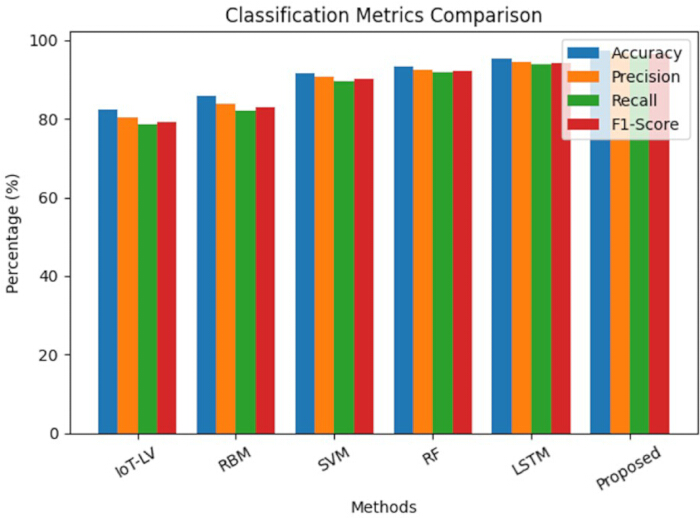
Figure 3: Comparison of classification performance metrics across different methods. Comparison of the classification performance of IoT-LV, RBM, Support Vector Machine (SVM), Random Forest (RF), Long Short-Term Memory (LSTM), and the proposed framework using the Open LV Network & Smart Meter dataset. Performance is evaluated using Accuracy, Precision, Recall, and F1-score. Results are presented as mean ± standard deviation (SD) from five independent experimental runs using a 70%/15%/15% training/validation/testing split. Error bars represent one standard deviation. Please click here to view a larger version of this figure.
6. Intelligent decision module
The Intelligent Decision Module was developed to automate low-voltage (LV) acceptance decisions using supervised machine learning models. Classification and regression algorithms were applied to the engineered feature vectors to support operational decision-making. Classification models identified normal and abnormal operating conditions, whereas regression models estimated future energy consumption and operational trends.
The input feature vector, X ∈ ℝd, comprised the statistical, voltage stability, load behavior, and power quality features extracted during the feature engineering stage. Standalone Support Vector Machine (SVM)44, Random Forest (RF)45, and Long Short-Term Memory (LSTM)46 models were implemented as baseline classifiers for comparative evaluation. The mathematical formulation of the learning models is provided in Supplementary File 1 (Section S5).
For classification, the output variable y ∈ {0,1} represented normal (0) and abnormal (1) operating conditions. When abnormal operating conditions or overload events were detected, the workflow generated a fault notification and flagged the acceptance process as invalid; otherwise, the process was classified as accepted.
The workflow orchestration engine integrated machine-learning predictions with rule-based validation, using a priority-based conflict-resolution strategy. Safety-critical operational rules and regulatory acceptance criteria were treated as hard constraints and therefore took precedence over machine-learning predictions when conflicts occurred. Final acceptance decisions were generated using the combined outputs of the rule-based validation and intelligent decision modules.
7. Cloud–edge integration and visualization dashboard
A cloud-edge computing architecture was implemented to support scalable data processing, storage, and visualization for the LV acceptance automation platform. Smart meters, SCADA systems, and IoT devices continuously collect electrical measurements, which are processed at the edge layer via filtering, normalization, feature extraction, and real-time inference to reduce communication overhead and enable low-latency decision-making. The mathematical derivations are provided in Supplementary File 1 (Section S6).
Processed data were transmitted to the cloud layer for long-term storage, advanced analytics, feature engineering, model training, and model management. Interactive dashboards provided real-time system monitoring, alerts, reporting, and operational decision support. The cloud-edge architecture is illustrated in Supplementary Figure 2, and the implementation details are summarized in Table 3.
| Layer | Component | Hardware / Software | Specification / Version | Purpose / Description |
| Edge Layer | Edge Device | Raspberry Pi 4 / NVIDIA Jetson Nano | Quad-core CPU, 4–8 GB RAM | Real-time data acquisition and local processing |
| IoT Gateway | Industrial IoT Gateway | MQTT / Modbus / OPC-UA support | Communication between sensors and edge/cloud | |
| Sensors / Smart Meters | Digital Smart Meters | Voltage, Current, Power Measurement | Data collection from LV network | |
| Edge Software | Python, EdgeX Foundry, MQTT Broker | Python 3.x | Data preprocessing, filtering, local inference | |
| Communication Protocols | Wi-Fi / PLC / RS-485 | Standard protocols | Data transmission to cloud layer | |
| Cloud Layer | Cloud Platform | AWS / Microsoft Azure / Google Cloud | Scalable cloud services | Data storage, analytics, and model training |
| Storage | AWS S3 / Azure Blob / InfluxDB | Time-series database | Storing historical and real-time data | |
| Compute & ML | Python, TensorFlow, PyTorch, Scikit-learn | ML libraries (latest versions) | Model training, evaluation, deployment | |
| Containerization | Docker, Kubernetes | Latest stable versions | Workflow orchestration and scalability | |
| Data Processing | Apache Spark / Pandas | Distributed processing | Large-scale data analytics | |
| Visualization Layer | Dashboard Tools | Grafana / Apache Superset / Plotly Dash | Web-based tools | Real-time monitoring and visualization |
| Web Framework | React.js / Angular / Flask / FastAPI | Modern web stack | UI development and API integration | |
| Notification System | Email / SMS Gateway / Push Notifications | Twilio / Firebase | Alert generation and communication | |
| API Services | REST APIs | JSON-based communication | Integration between modules |
Table 3: System implementation details. Summary of the hardware configuration, software environment, communication protocols, and cloud–edge computing components used for implementing the proposed LV acceptance automation platform.
Acesso restrito. Inicie sessão ou comece um teste para visualizar este conteúdo.
Resultados
The performance of the proposed Low-Voltage (LV) Acceptance Automation Platform was evaluated using the Open LV Network & Smart Meter Dataset together with a synthetic smart meter dataset generated to represent additional operating conditions and fault scenarios. The synthetic dataset enabled controlled evaluation of workflow orchestration, intelligent decision-making, and fault detection under abnormal operating conditions. The Open LV Network & Smart Meter Dataset comprised household smart meter measurements, f...
Acesso restrito. Inicie sessão ou comece um teste para visualizar este conteúdo.
Discussão
The experimental evaluation demonstrated that the proposed workflow-oriented Low-Voltage (LV) Acceptance Automation Platform consistently outperformed the benchmark approaches in classification, forecasting, fault detection, operational decision latency, and scalability. These performance improvements resulted from the integration of advanced feature engineering, workflow orchestration, cloud-edge collaboration, and hybrid rule-based and machine learning decision-making rather than from the use of a single machine learni...
Acesso restrito. Inicie sessão ou comece um teste para visualizar este conteúdo.
Divulgações
Os autores declaram que não possuem interesses financeiros ou não financeiros conflitantes.
Agradecimentos
The authors thank the UK Power Networks Open Data Portal for providing the publicly available Open LV Network & Smart Meter dataset used in this study. This research received no external funding.
Acesso restrito. Inicie sessão ou comece um teste para visualizar este conteúdo.
Materiais
| Nome | Empresa | Número de catálogo | Comentários |
|---|---|---|---|
| Apache Spark | Apache Software Foundation | Version 3.4+ | Análise de dados em larga escala |
| Apache Superset | Apache Software Foundation | Version 3.x | Painel analítico |
| Docker Engine | Docker Inc. | Version 24.x | Implantação de aplicativos |
| Eclipse Mosquitto MQTT Broker | Eclipse Foundation | Version 2.x | Troca de dados |
| EdgeX Foundry (Versão Jakarta ou posterior) | LF Edge (Linux Foundation) | Version Jakarta / Geneva | Gerenciamento de dispositivos de borda |
| Flask / FastAPI | Pallets Projects / Sebastián Ramírez | Flask 2.3+ / FastAPI 0.100+ | Integração de API de back-end |
| Grafana | Grafana Labs | Version 10.x | Visualização e monitoramento |
| Gateway de IoT Industrial | Advantech / Siemens | ECU-1251 / SIMATIC IOT2040 | Comunicação de sensores à nuvem |
| Sensores IoT (Sensores de Tensão/Corrente) | Texas Instruments / Analog Devices | INA219 / ACS712 | Monitoramento em tempo real da rede |
| Kit de Desenvolvimento Jetson Nano | NVIDIA Corporation | 945-13450-0000-100 | Inferência de IA na borda |
| Kubernetes | Cloud Native Computing Foundation (CNCF) | Version 1.27+ | Escalabilidade de fluxo de trabalho |
| Modelo LSTM (Keras/TensorFlow) | Google (TensorFlow/Keras) | Incluído no TF 2.12+ | Previsão e previsão de carga |
| Módulo PLC (Comunicação por Linha Elétrica) | STMicroelectronics | ST7580 | Comunicação de rede inteligente |
| Plotly Dash | Plotly Inc. | Version 2.x | Visualização interativa |
| Python 3.10 | Python Software Foundation | Version 3.10.x | Processamento e análise de dados |
| PyTorch | Meta AI | Version 2.0+ | Implementação de aprendizado profundo |
| Algoritmo Random Forest | Scikit-learn | Incluído na v1.3+ | Classificação de falhas |
| Raspberry Pi 4 Modelo B (4GB de RAM) | Raspberry Pi Foundation | RPI4-MODBP-4GB | Processamento na borda |
| React.js / Angular | Meta / Google | React 18.x / Angular 16+ | Desenvolvimento de interface do usuário |
| Módulo Transceptor RS-485 | Maxim Integrated (Analog Devices) | MAX485 | Conectividade de dispositivos industriais |
| Scikit-learn | Desenvolvedores do Scikit-learn | Version 1.3+ | Modelos de aprendizado de máquina |
| Máquina de Vetores de Suporte (SVM) | Scikit-learn | Incluído na v1.3+ | Classificação e validação |
| TensorFlow | Google LLC | Version 2.12+ | Treinamento de modelo |
| Twilio / Firebase Cloud Messaging | Twilio Inc. / Google | Não aplicável | Alertas e notificações |
| Módulo Wi-Fi | Espressif Systems | ESP8266 / ESP32 | Transmissão de dados |
| XGBoost | DMLC (Distributed ML Community) | Version 1.7+ | Apoio inteligente à decisão |
Referências
- Tong L, Zhou J, Li J. IoT-based low-voltage power distribution system management and control platform. Front Energy Res. 2022;10:902715. https://doi.org/10.3389/fenrg.2022.902715
- Babayigit B, Abubaker M. Industrial Internet of Things: A review of improvements over traditional SCADA systems for industrial automation. IEEE Syst J. 2023;18:120–133.
- Nakagawa EY, et al. Industry 4.0 reference architectures: State of the art and future trends. Comput Ind Eng. 2021;156:107241. https://doi.org/10.1016/j.cie.2021.107241
- Ladegourdie M, Kua J. Performance analysis of OPC UA for industrial interoperability towards Industry 4.0. Internet Things. 2022;3:507–525.
- Bader SR, Maleshkova M, Lohmann S. Structuring reference architectures for the industrial Internet of Things. Future Internet. 2019;11:151. https://doi.org/10.3390/fi11070151
- Fun TS, Samsudin A. Recent technologies, security countermeasure and ongoing challenges of industrial Internet of Things (IIoT): A survey. Sensors (Basel). 2021;21:6647. https://doi.org/10.3390/s21196647
- Mirani AA, et al. Key challenges and emerging technologies in industrial IoT architectures: A review. Sensors (Basel). 2022;22:5836. https://doi.org/10.3390/s22155836
- Fraile F, et al. Reference models for digital manufacturing platforms. Appl Sci. 2019;9:4433. https://doi.org/10.3390/app9204433
- Serôdio C, et al. Software and architecture orchestration for process control in Industry 4.0 enabled by cyber-physical systems technologies. Appl Sci. 2024;14:2160. https://doi.org/10.3390/app14052160
- Ungurean I, Gaitan NC. A software architecture for the industrial Internet of Things—A conceptual model. Sensors (Basel). 2020;20:5603. https://doi.org/10.3390/s20195603
- Hsiao CH, Lee WP. OPIIoT: Design and implementation of an open communication protocol platform for industrial Internet of Things. Internet Things. 2021;16:100441. https://doi.org/10.1016/j.iot.2021.100441
- Domínguez-Bolaño T, et al. An overview of IoT architectures, technologies, and existing open-source projects. Internet Things. 2022;20:100626. https://doi.org/10.1016/j.iot.2022.100626
- Sasiain J, et al. Towards flexible integration of 5G and IIoT technologies in Industry 4.0: A practical use case. Appl Sci. 2020;10:7670. https://doi.org/10.3390/app10217670
- Cañas H, et al. A conceptual framework for smart production planning and control in Industry 4.0. Comput Ind Eng. 2022;173:108659. https://doi.org/10.1016/j.cie.2022.108659
- Cabrini FH, et al. Enabling the industrial Internet of Things to cloud continuum in a real city environment. Sensors (Basel). 2021;21:7707. https://doi.org/10.3390/s21227707
- Gabriel MF, et al. Implementation of an IoT architecture for promoting healthy air quality in 84 homes of families with children. Build Environ. 2024;266:112040. https://doi.org/10.1016/j.buildenv.2024.112040
- Silva BN, Khan M, Han K. Internet of Things: A comprehensive review of enabling technologies, architecture, and challenges. IETE Tech Rev. 2018;35:205–220.
- Dhaou ISB, et al. Internet of Things technologies for smart grid. In: Research Anthology on Smart Grid and Microgrid Development. IGI Global; Hershey; 2022. p. 805–832.
- Kondoro A, et al. A low latency secure communication architecture for microgrid control. Energies. 2021;14:6262. https://doi.org/10.3390/en14196262
- Tightiz L, Yang H. A comprehensive review on IoT protocols' features in smart grid communication. Energies. 2020;13:2762. https://doi.org/10.3390/en13112762
- Kondoro A, et al. Real-time performance analysis of secure IoT protocols for microgrid communication. Future Gener Comput Syst. 2021;116:1–12.
- Rodrigues R, et al. A review of solid-state circuit breakers. IEEE Trans Power Electron. 2020;36:364–377.
- IEEE. IEEE Std 1159-2019: IEEE recommended practice for monitoring electric power quality. IEEE; Piscataway (NJ); 2019. https://doi.org/10.1109/IEEESTD.2019.8800097
- Otcenasova A, et al. The influence of power quality indices on active power losses in a local distribution grid. Energies. 2019;12:1389. https://doi.org/10.3390/en12071389
- Ma K, et al. Review of distribution network phase unbalance: Scale, causes, consequences, solutions, and future research direction. CSEE J Power Energy Syst. 2020;6:479–488.
- Peppanen J, et al. Modeling power electronic equipment to improve distribution feeder current and voltage balance [Presentation]. Presented at: IEEE PES Transmission and Distribution Conference and Exposition (T&D); Denver, CO; 2018. Available from: https://ieeexplore.ieee.org/ https://doi.org/10.1109/TDC.2018.8440261
- Sayed S, et al. Design and realization of an open-source and modular smart meter. Energy Sci Eng. 2019;7:1405–1422.
- Satapathy LM, et al. Arduino based home automation using Internet of Things (IoT). Int J Pure Appl Math. 2018;118:769–778.
- Shaban M, et al. Design of a partially grid-connected photovoltaic microgrid using IoT technology. Appl Sci. 2021;11:11651. https://doi.org/10.3390/app112411651
- Shaban M, Dhaou IB. Design of an IoT-enabled microgrid architecture for a partial grid-connected mode [Presentation]. Presented at: 18th International Multi-Conference on Systems, Signals and Devices (SSD); Virtual; 2021. Available from: https://ieeexplore.ieee.org/ https://doi.org/10.1109/SSD52085.2021.9429443
- Taye BZ, et al. Rural electrification planning using geographic information system (GIS). Cogent Eng. 2020;7:1836730. https://doi.org/10.1080/23311916.2020.1836730
- Huld T, et al. Geospatial analysis of photovoltaic mini-grid system performance. Energies. 2017;10:218. https://doi.org/10.3390/en10020218
- Domínguez J, et al. IntiGIS-Local: A geospatial approach to assessing rural electrification alternatives for sustainable socio-economic development in isolated communities—A case study of Guasasa, Cuba. Energies. 2024;17:3835. https://doi.org/10.3390/en17153835
- Tafula JE, et al. Multicriteria decision-making approach for optimum site selection for off-grid solar photovoltaic microgrids in Mozambique. Energies. 2023;16:2894. https://doi.org/10.3390/en16062894
- Isihak S, et al. Evolution of GIS-based rural electrification planning models and an application of OnSSET in Nigeria. Renew Sustain Energy Transit. 2022;2:100019. https://doi.org/10.1016/j.rset.2022.100019
- Korkovelos A, et al. The role of open access data in geospatial electrification planning and the achievement of SDG7: An OnSSET-based case study for Malawi. Energies. 2019;12:1395. https://doi.org/10.3390/en12071395
- Cicilio P, et al. uGrid: Reliable minigrid design and planning toolset for rural electrification. IEEE Access. 2019;7:163988–163999.
- Nasir M, et al. Optimal planning and design of low-voltage low-power solar DC microgrids. IEEE Trans Power Syst. 2018;33:2919–2928.
- Vai V, et al. Optimal low-voltage distribution topology with integration of PV and storage for rural electrification in developing countries: A case study of Cambodia. J Mod Power Syst Clean Energy. 2020;8:531–539.
- Banad Y, Sharif S, Rezaei Z. Artificial intelligence and machine learning for smart grids: from foundational paradigms to emerging technologies with digital twin and large language model-driven intelligence. Energy Convers Manag X. 2025;28:101329. https://doi.org/10.1016/j.ecmx.2025.101329
- Álvarez-López C, González-Briones A, Li T. Explainable AI and multi-agent systems for energy management in IoT-edge environments: a state-of-the-art review. Electronics. 2026;15(2):385. https://doi.org/10.3390/electronics15020385
- UK Power Networks. Open data portal [Online]. Available from: https://www.ukpowernetworks.co.uk/our-company/open-data-portal (Accessed June 2026).
- Jolliffe IT. Principal Component Analysis. 2nd ed. Springer; New York; 2002. https://doi.org/10.1007/b98835
- Cortes C, Vapnik V. Support-vector networks. Mach Learn. 1995;20:273–297.
- Breiman L. Random forests. Mach Learn. 2001;45:5–32.
- Hochreiter S, Schmidhuber J. Long short-term memory. Neural Comput. 1997;9:1735–1780.
- Fawcett T. An introduction to ROC analysis. Pattern Recognit Lett. 2006;27:861–874.
- Montgomery DC, Runger GC. Applied Statistics and Probability for Engineers. 8th ed. John Wiley & Sons; Hoboken (NJ); 2020.
- Montgomery DC. Design and Analysis of Experiments. 10th ed. John Wiley & Sons; Hoboken (NJ); 2020.
Acesso restrito. Inicie sessão ou comece um teste para visualizar este conteúdo.