Este estudo demonstra que o Granulado Qiming (QMG) melhora a retinopatia diabética (DR) por meio da modulação do eixo intestino-retina. O QMG reestruturou a microbiota intestinal, suprimiu a inflamação sistêmica e restaurou a rede reguladora centrada em CMKLR1, revertendo assim os danos histopatológicos retinianos. Esses achados posicionam o QMG como uma estratégia terapêutica promissora direcionada ao eixo intestino-retina para a DR.
Artigo de investigação
Análise Correlacional do Grânulo Qiming com a Rede Centrada em CMKLR1 e Inflamação Sistêmica via Eixo Intestino-Retina na Retinopatia Diabética
Neste artigo
Resumo
Resumo
A retinopatia diabética (RD) é uma complicação neurovascular provocada pela hiperglicemia crônica e inflamação sistêmica, com evidências emergentes destacando o eixo intestino-retina como um alvo terapêutico crítico, porém subutilizado. Este estudo investiga se o Granulado Qiming (QMG) exerce sua eficácia protetora contra a RD por meio da modulação do eixo intestino-retina. Camundongos C57BL/6 foram randomizados em grupos experimentais e submetidos a intervenções distintas. As alterações histopatológicas da retina foram avaliadas por coloração com hematoxilina-eosina (HE). Os níveis séricos de citocinas inflamatórias (IL-1β, IL-6, TNF-α) foram medidos por ensaio imunoenzimático (ELISA). A expressão de proteínas reguladoras-chave (CMKLR1, Wnt5a, PPAR-γ, AP-1, TP53) nos tecidos retiniano e colônico foi detectada por Western blot (WB). A composição e diversidade da microbiota intestinal foram caracterizadas por sequenciamento completo do gene 16S de rDNA. Análises de correlação foram realizadas para avaliar as relações entre a microbiota intestinal e fatores inflamatórios ou proteínas-chave. O tratamento com QMG melhorou as anormalidades histopatológicas da retina, evidenciado pela restauração da arquitetura laminar retiniana, recuperação parcial do número de células ganglionares da retina (P < 0,001) e reversão do afinamento retiniano (P < 0,01). Também reduziu significativamente os níveis séricos de IL-1β, IL-6 e TNF-α (P < 0,0001). Ao longo do eixo intestino-retina, o QMG reverteu a expressão anormal de proteínas reguladoras-chave, notadamente a rede centrada em CMKLR1 (Wnt5a, PPAR-γ, AP-1, TP53). Além disso, o QMG restaurou a composição, diversidade e função da microbiota intestinal, e as análises de correlação revelaram que o QMG acopla a inflamação sistêmica a essas proteínas reguladoras para modular o eixo intestino-retina. Este estudo fornece evidências farmacológicas preliminares de que o QMG atenua a RD acoplando a rede reguladora centrada em CMKLR1 (incluindo Wnt5a, PPAR-γ, AP-1 e TP53) à inflamação sistêmica por meio do eixo intestino-retina, posicionando o QMG como uma promissora estratégia terapêutica direcionada ao eixo intestino-retina para a RD.
Introdução
A retinopatia diabética (DR), uma das complicações microvasculares mais comuns do diabetes melito (DM), é uma das principais causas de cegueira entre adultos em idade ativa em todo o mundo1. Globalmente, a DR afeta aproximadamente 20–30% da população com DM2. A hiperglicemia crônica impulsiona a patogênese da DR ao desencadear uma cascata de eventos patológicos, incluindo acoplamento neurovascular prejudicado, respostas inflamatórias acentuadas e estresse oxidativo3. Recentemente, foram observadas alterações na diversidade e composição da microbiota intestinal em pacientes diabéticos com retinopatia, em comparação com aqueles sem a condição4,5. Consequentemente, o eixo intestino-retina — uma rede de comunicação bidirecional que liga a homeostase intestinal à saúde da retina — emergiu como um novo fator contribuinte para a progressão da DR. No entanto, os mediadores moleculares específicos que traduzem os sinais do eixo intestino-retina em patologia retiniana ainda são pouco caracterizados, limitando a identificação de biomarcadores confiáveis e alvos terapêuticos.
O eixo intestino-retina delineia uma rede complexa de comunicação bidirecional entre a microbiota intestinal e seus metabólitos com os tecidos retinianos por meio de vias imunológicas, metabólicas, neuroendócrinas e vasculares, modulando assim seu equilíbrio homeostático6. Molecularmente, o eixo intestino-retina caracteriza-se pela desregulação de proteínas-chave responsivas ao estresse e determinantes do destino celular, especificamente AP-1 e TP537,8,9. Além disso, CMKLR1, um receptor de quimiocina chave, surge como mediador essencial da disfunção endotelial e da desregulação metabólica, estabelecendo uma ligação crítica entre alterações na microbiota intestinal e a patogênese da retinopatia diabética10. Importante, a sinalização Wnt coordena papéis reguladores duplos na manutenção da homeostase vascular retiniana e na função da barreira epitelial intestinal11, enquanto a sinalização PPAR atua como reguladora mestra das respostas inflamatórias e processos metabólicos em tecidos oculares e intestinais12,13. Esses componentes moleculares constituem coletivamente uma rede de sinalização interconectada dentro do eixo intestino-retina, oferecendo novas perspectivas mecanicistas e oportunidades terapêuticas para complicações relacionadas ao diabetes. Assim, direcionar as alterações estruturais e funcionais ao longo desse eixo representa uma estratégia promissora para o manejo da RD.
A Medicina Tradicional Chinesa (MTC) desempenhou historicamente um papel significativo no tratamento da diabetes e da retinopatia relacionada, com decisões terapêuticas baseadas na diferenciação de síndromes14. O Granulado Qiming (QMG), composto por Astragalus membranaceus, Pueraria lobata, Rehmannia glutinosa, Lycium barbarum, Senna obtusifolia, Leonurus japonicus, Typha angustifolia e Whitmania pigra, é amplamente utilizado no tratamento da DR. Aprovado pela Administração Nacional de Produtos Médicos da China (Nº de Aprovação Z20090036), o QMG concluiu com sucesso ensaios clínicos e obteve autorização para comercialização. O QMG exibe efeitos protetores ao prevenir o espessamento da membrana basal nos capilares retinianos, reduzir os danos aos pericitos e à microvasculatura retiniana e manter a morfologia patológica local do olho15, tornando-se uma terapia promissora para o tratamento da DR. Ao atuar sobre proteínas-chave e fatores inflamatórios, os componentes ativos do QMG exercem efeitos anti-inflamatórios, antioxidantes e antiapoptóticos, fornecendo uma base mecanicista para sua modulação do eixo intestino-retina16. Essas propriedades fornecem uma base mecanicista para o potencial do QMG de modular o eixo intestino-retina, embora poucos estudos tenham explorado essa ligação. Portanto, este estudo tem como objetivo validar a eficácia do QMG na modulação do eixo intestino-retina, fornecendo evidências experimentais sobre seu potencial terapêutico na DR.
Este estudo integra previsões teóricas com dados experimentais in vivo para validar a eficácia do QMG na modulação do eixo intestino-retina. Esses achados demonstram que o QMG atenua a DR ao acoplar a rede reguladora centrada em CMKLR1 (incluindo Wnt5a, PPAR-γ, AP-1 e TP53) à inflamação sistêmica por meio do eixo intestino-retina, posicionando o QMG como uma promissora estratégia terapêutica direcionada ao eixo intestino-retina para a DR. O resumo gráfico está apresentado na Figura 1.
Protocolo
Todos os experimentos com animais foram realizados em conformidade com as diretrizes ARRIVE. O estudo foi aprovado pelo Comitê de Revisão Ética da Sichuan Scientist Biotechnology Co., Ltd. (IACUC ISSUE SYST-2024-011). Um cronograma experimental detalhado, resumindo o desenho do estudo, está fornecido na Figura Suplementar 1.
Preparação e tratamento dos animais
Os camundongos foram profundamente anestesiados por inalação de isoflurano a 2%. Sob anestesia profunda, o sangue foi coletado por enucleação retro-orbital. Imediatamente após a coleta de sangue, os bulbos oculares foram enucleados para a obtenção do tecido retiniano. Posteriormente, foi realizada a dislocação cervical sob anestesia profunda para garantir a eutanásia. Os tecidos do cólon foram então dissecados imediatamente. Os animais que apresentaram eventos adversos foram imediatamente retirados do estudo e receberam cuidados veterinários apropriados.
Randomização e mascaramento
Camundongos machos C57BL/6, com idade de 5 semanas e peso entre 20 e 30 gramas, foram acomodados em condições estritamente reguladas, incluindo temperatura e umidade. Após uma semana de aclimatação, os camundongos C57BL/6 foram aleatorizados em três grupos (grupo branco, grupo modelo e grupo de intervenção) utilizando uma sequência de números aleatórios gerada por computador. A sequência de aleatorização foi gerada por um pesquisador não envolvido no manejo dos animais ou na avaliação dos desfechos.
Para garantir a cegagem, todos os cuidados com os animais, administração de fármacos e coleta de dados foram realizados por pesquisadores que desconheciam a alocação dos grupos. Os códigos de alocação dos grupos foram revelados somente após a conclusão de todos os experimentos e análises estatísticas. A cegagem foi aplicada a: o técnico que realizou a gavagem oral; o patologista que avaliou a histologia da retina; e o analista que quantificou as bandas de Western blot (WB).
Cálculo do tamanho da amostra
O tamanho da amostra foi determinado com base em um experimento preliminar que avaliava a contagem de células ganglionares da retina (RGC) nas mesmas condições experimentais. Assumindo um nível de significância bilateral (α) de 0,05 e um poder estatístico (1-β) de 0,80, foi necessário um mínimo de 5 camundongos por grupo para detectar uma diferença clinicamente relevante na contagem de RGC entre os grupos modelo e de intervenção. Considerando uma taxa de perda potencial de aproximadamente 20%, cada grupo foi definido com 6 camundongos.
Estabelecimento de animais diabéticos
O grupo controle recebeu uma dieta padrão, enquanto os grupos de intervenção e modelo foram submetidos a uma dieta rica em gordura e açúcar (HFHSD) durante um período de quatro semanas. Após esse período alimentar, os grupos de intervenção e modelo receberam injeção intraperitoneal com uma solução de 1% de estreptozotocina (STZ) na dose de 35 mg/kg17,18,19,20. Após setenta e duas horas da injeção, os camundongos que apresentaram níveis de glicose sanguínea em jejum superior a 16,7 mmol/L foram considerados como tendo induzido com sucesso um modelo de DM e foram selecionados para experimentação adicional. Os animais com DM continuaram com a dieta rica em gordura e açúcar por mais quatro meses, enquanto o grupo controle manteve sua dieta padrão.
Validação taxonômica e avaliação da qualidade
Os oito ingredientes na QMG foram validados taxonomicamente utilizando a Pesquisa de Nomes de Plantas Modernizada (MPNS, http://mpns.kew.org/mpns-portal/). A qualidade da apresentação da composição da QMG foi avaliada utilizando a ferramenta ConPhYMP.
Métodos de administração
No grupo de intervenção, os animais receberam QMG por via oral. O QMG foi adquirido da Zhejiang Sansheng Mandi Pharmaceutical Co., Ltd. (número de aprovação nacional de medicamento chinês Z20090036). A suspensão de QMG foi preparada misturando-se uniformemente o QMG com água destilada. Os camundongos do grupo de intervenção receberam a suspensão por gavagem oral em volume equivalente aos grupos modelo e controle. A dose foi calculada com base na dose terapêutica clínica única de 4,5 g por adulto de 60 kg (dose unitária padrão da formulação comercializada), utilizando o método de normalização pela área da superfície corporal (ASC) recomendado pela FDA e Reagan-Shaw21. O fator de conversão entre humanos adultos (Km = 37) e camundongos (Km = 3) foi de 12,33, resultando em uma dose de 0,9 g/kg de peso corporal para camundongos. O grupo modelo e o grupo controle receberam volume equivalente de solução salina por gavagem oral. A administração foi realizada diariamente entre 9h e 11h durante um período consecutivo de 3 meses.
Observação e indicadores de teste
Monitoramento geral dos sinais vitais
Os sinais vitais gerais e indicadores fisiológicos, incluindo peso corporal, níveis de glicose no sangue, consumo de água e alimento, volume urinário, níveis de atividade e comportamento, temperatura corporal, bem como a condição da pelagem e da pele, foram sistematicamente observados e registrados para avaliar de forma abrangente as intervenções terapêuticas e detectar possíveis complicações.
Observação de alterações morfológicas na retina por meio da análise de coloração HE
Todos os espécimes foram processados em um desidratador automático utilizando uma série de soluções de etanol e xilol após a fixação, seguido de inclusão em parafina. Posteriormente, cortes de 4 µm em parafina foram realizados e corados com HE e então montados com goma neutra. As imagens da retina foram digitalizadas usando um escâner 3DHISTECH Pannoramic SCAN. A análise de imagens e a mensuração dos dados foram realizadas pelo Image-Pro Plus.
Detecção de IL-6, TNF-α e IL-1β séricos por análise de ELISA
As amostras de sangue foram coletadas por enucleação retro-orbital. O soro foi separado por centrifugação a 1.000 × g durante 15 min a 4 °C e armazenado a -80 °C até a análise. Os níveis séricos de IL-1β, IL-6 e TNF-α foram medidos conforme procedimentos padrão, incluindo equilibração de reagentes, adição de amostras, incubação, lavagem, adição de conjugado e substrato, interrupção da reação, medição da densidade óptica e cálculo da concentração com base em uma curva padrão. A densidade óptica foi lida a 450 nm utilizando um leitor de microplacas, e as concentrações de citocinas foram calculadas com base nas curvas padrão.
Detecção das principais proteínas reguladoras na retina e no cólon por meio de análise de WB
Três réplicas biológicas independentes foram realizadas em uma única membrana e sinalizadas sequencialmente para as proteínas-alvo. Todas as réplicas foram obtidas de uma única coorte de animais sacrificados simultaneamente. Quando o peso molecular de uma proteína-alvo era muito próximo ao da GAPDH (<5 kDa de diferença), elas foram analisadas em membranas independentes para evitar sobreposição de sinais. Cada membrana foi sinalizada exclusivamente para a proteína-alvo ou para a GAPDH, garantindo quantificação precisa. Os seguintes anticorpos primários foram utilizados: anticorpo policlonal contra GAPDH policlonal anticorpo (1:5000), anticorpo policlonal contra CMKLR1 (1:1000), anticorpo policlonal contra Wnt5a (1:1000), anticorpo policlonal contra TP53 (1:1000), anticorpo monoclonal contra AP-1 (1:5000) e anticorpo policlonal contra PPAR gama (PPAR-γ) (1:1000). As proteínas totais foram obtidas por lise celular seguida de centrifugação. As concentrações proteicas foram determinadas utilizando o ensaio BCA. As proteínas extraídas foram separadas por eletroforese em gel de poliacrilamida-SDS com gel separador a 12% e posteriormente transferidas para membranas. As membranas foram bloqueadas em TBST contendo 5% de leite desnatado e incubadas com os anticorpos primários apropriados durante a noite a 4 °C. Após lavagem, as membranas foram incubadas com anticorpos secundários conjugados à peroxidase do rabojo (HRP) anti-coelho ou anti-rato na diluição de 1:10.000. Por fim, as bandas proteicas foram visualizadas e analisadas por meio de imagem quimioluminescente. Durante a visualização e o processamento dos dados, as membranas foram recortadas horizontalmente para remover regiões irrelevantes de peso molecular, mantendo-se todas as amostras sem remoção de áreas entre as faixas. Pode ocorrer leve distorção nas bordas durante o recorte para remoção de regiões irrelevantes do gel.
Detecção da microbiota intestinal por meio de análise de sequenciamento de rDNA 16S
Amostras frescas de fezes foram coletadas de cada camundongo antes dos procedimentos terminais. Os camundongos foram colocados individualmente em gaiolas estéreis por 10–15 min para permitir a defecação espontânea. Os pellets fecais foram imediatamente coletados com pinças estéreis, transferidos para tubos estéreis de 1,5 mL, congelados rapidamente em nitrogênio líquido e armazenados a -80 °C até a extração de DNA. Todos os procedimentos foram realizados em condições estéreis para minimizar contaminação cruzada. O intervalo entre a defecação e o congelamento foi mantido dentro de 10 min para garantir a integridade microbiana. As amostras de DNA genômico fecal (gDNA) foram purificadas utilizando o kit de extração de gDNA fecal, seguido da amplificação completa do gene 16S rDNA por reação em cadeia da polimerase (PCR) com os primers universais 8F (5’-AGAGTTTGATCATGGCTCAG-3’) e 1492R (5’-CGGTTACCTTGTTACGACTT-3’). Os produtos de PCR foram subsequentemente analisados por eletroforese em gel de agarose, purificados e quantificados para aplicações posteriores. O sequenciamento de alto rendimento foi realizado no sequenciador Nanopore GridION. O processo de análise de dados incluiu chamada de bases, controle de qualidade dos dados, anotação de espécies, construção de árvore filogenética, análise da comunidade, análise de diversidade Alfa e Beta e análise de espécies diferencialmente abundantes e predição da função da comunidade. Diversas ferramentas e bancos de dados, como NanoFilt, Usearch, a linguagem de programação R, Python e o banco de dados SILVA, foram utilizados durante a análise.
Análise de correlação do eixo intestino-retina com inflamação sistêmica e microbiota intestinal em múltiplos níveis
Para explorar as possíveis associações entre microbiota intestinal em múltiplos níveis e citocinas inflamatórias séricas e proteínas reguladoras-chave, foi realizada uma análise de correlação utilizando a plataforma Luoning Bio-Cloud. Inicialmente, os dados de abundância de espécies nos níveis de Reino, Filo, Classe, Ordem, Família, Gênero e Espécie foram extraídos dos resultados de sequenciamento. Fatores físico-químicos, incluindo citocinas inflamatórias séricas e níveis de expressão proteica, foram compilados em um arquivo de fatores ambientais. Para garantir a confiabilidade e a visualização das correlações, os dados foram normalizados para eliminar as diferenças de escala entre a abundância microbiana e as unidades de medição clínicas. Os coeficientes de correlação (valores R) e os respectivos níveis de significância (P-valores) foram calculados. Os resultados foram visualizados por meio de um mapa de calor de correlação, em que gradientes de cor indicam a intensidade e a direção da correlação (vermelho representando correlação positiva, azul representando correlação negativa), e asteriscos (**) indicam significância estatística (P < 0,01).
Métodos estatísticos
Todas as análises estatísticas e visualizações foram realizadas utilizando o GraphPad Prism. O teste t para comparar médias foi empregado para dados que seguiram a distribuição normal. Nos casos em que os dados desviaram da normalidade, foi utilizado o teste de Kruskal-Wallis. A correlação de Spearman ou de Pearson foi realizada para avaliar as relações entre variáveis. Todos os testes estatísticos foram conduzidos como bicaudais, com significância estatística definida em 0,05.
Resultados
General situation of experimental animals
Blood glucose levels were significantly elevated in the model group (27.21 ± 6.03 mmol/L) compared with the blank group (P < 0.001), indicating the successful induction of the DM model. During the study period, the experimental animals showed stable body weight, continuous water and food intake, normal urine output, body temperature, healthy fur and skin condition, and normal behavior during the experiment.
Composition and validation of QMG
QMG, a proprietary Chinese medicine that passed Phase III clinical trials, encompasses Astragalus membranaceus (Fisch.) Bunge [Fabaceae, Astragali radix], Pueraria lobata (Willd.) Ohwi [Fabaceae, Puerariae lobatae radix], Rehmannia glutinosa (Gaertn.) Libosch. Ex Fisch. & C.A. Mey. [Orobanchaceae; Rehmanniae radix], Lycium barbarum L. [Solanaceae; Lycii fructus], Senna obtusifolia (L.) H.S. Irwin & Barneby [Fabaceae; Cassiae semen], Leonurus japonicus Houtt. [Lamiaceae, Leonuri herba], Typha angustifolia L. [Typhaceae; Typhae pollen], Whitmania pigra Whitman [Hirudinidae; Hirudo]15. The detailed information, including the Chinese name, scientific name by MPNS validation, species, family, part used, representative bioactive compounds, was summarized in Table 1, which defined the QMG and provided a transparent, scientifically grounded basis for the formulas under investigation.
| No. | Chinese name | Scientific name by MPNS validation | Species | Family | Part Used | Representative bioactive compounds | |||||||
| 1 | HuangQi | Astragalus membranaceus (Fisch.) Bunge [Fabaceae, Astragali radix] | Astragalus mongholicus (Fisch.) Bunge | Fabaceae | Radix | Astragaloside IV, Calycosin | |||||||
| 2 | GeGen | Pueraria lobata (Willd.) Ohwi [Fabaceae, Puerariae lobatae radix] | Pueraria lobata (Willd.) | Fabaceae | Radix | Puerarin, Daidzin | |||||||
| 3 | DiHuang | Rehmannia glutinosa (Gaertn.) Libosch. Ex Fisch. & C.A. Mey. [Orobanchaceae; Rehmanniae radix] | Rehmannia glutinosa (Gaertn.) Libosch. Ex Fisch. & C.A. Mey. | Orobanchaceae | Radix | Catalpol, Rehmannioside D | |||||||
| 4 | GouQiZi | Lycium barbarum L. [Solanaceae; Lycii fructus] | Lycium barbarum L. | Solanaceae | Fructus | Lycium barbarum polysaccharides, Betaine | |||||||
| 5 | JueMingZi | Senna obtusifolia (L.) H.S. Irwin & Barneby [Fabaceae; Cassiae semen] | Senna obtusifolia (L.) H.S. Irwin & Barneby | Fabaceae | Semen | Aurantio-obtusin, Emodin | |||||||
| 6 | Chong WeiZi | Leonurus japonicus Houtt. [Lamiaceae, Leonuri fructus] | Leonurus japonicus Houtt. | Lamiaceae | Fructus | Stachydrine, Leonurine | |||||||
| 7 | PuHuang | Typha angustifolia L. [Typhaceae; Typhae pollen] | Typha angustifolia L. | Typhaceae | Pollen | Isorhamnetin, Kaempferol | |||||||
| 8 | ShuiZhi | Whitmania pigra Whitman [Hirudinidae; Hirudo] | Whitmania pigra Whitman | Hirudinidae | Body | Hirudin, Calin | |||||||
Table 1: The composition and quality information of QMG ingredients. Detailed information on the composition and quality information of QMG ingredients, including the Chinese name, scientific name by MPNS validation, species, family, part used, and representative bioactive compounds.
QMG ameliorates the retinal morphology
As depicted in Figure 2A, the retina of the blank group exhibited a well-organized structure. The cellular arrangement was dense and orderly across all layers, with no evidence of structural disruption, exudation, or inflammatory infiltration. Compared with the blank group, retinal sections from the model group (Figure 2B) exhibited marked structural disorganization, characterized by disordered cellular arrangement, a significant reduction in RGC counts (P < 0.0001, Table 2, Figure 3A), and pronounced thinning of the total retinal thickness (P < 0.0001, Figure 3B). Notably, neovascular tufts penetrating the inner limiting membrane were observed (indicated by a red arrow), confirming successful establishment of the DR model. In contrast, the intervention group (Figure 2C) demonstrated significant attenuation of histopathological abnormalities relative to the model group, as evidenced by restoration of retinal laminar architecture, partial recovery of RGC numbers (P < 0.001, Table 2, Figure 3A), and reversal of retinal thinning (P < 0.01, Table 2, Figure 3B). These data provide strong evidence for QMG as an effective intervention for DR.
QMG attenuates systemic inflammatory response in DR
Compared with the blank group, the expression levels of IL-1β, IL-6, and TNF-α were significantly upregulated in the model group (P < 0.0001), confirming that the modeling procedure successfully induced a marked inflammatory response. Conversely, compared with the model group, the expression levels of IL-1β, IL-6, and TNF-α were significantly downregulated in the intervention group (p < 0.0001), indicating a potent inhibitory effect of QMG on systemic inflammation. The serum concentrations of IL-1β, IL-6, and TNF-α across the three groups are summarized in Table 3 and illustrated in Figure 4A–C.
QMG modulates the CMKLR1-centered regulatory network along the gut–retina axis
As shown in Figure 5, Figure 6, Figure 7, and Supplementary Figure 2, the results of this study showed that in DR model mice, the expression levels of five key regulatory proteins—AP-1, Wnt5a, CMKLR1, TP53, and PPAR-γ—exhibited a consistent downward trend in both colonic and retinal tissues. Following QMG intervention, the expression of these proteins showed varying degrees of recovery, with some proteins reaching statistical significance. Specifically, after QMG intervention, the expression of AP-1, Wnt5a, and CMKLR1 in colonic tissue was significantly higher than that in the model group (P < 0.05), while in retinal tissue, the expression of CMKLR1 and TP53 was significantly higher than that in the model group (P < 0.01). These findings may suggest that AP-1 and Wnt5a are more sensitive responders in the colon, whereas TP53, as an apoptosis regulator, plays a more critical role in retinal neuroprotection. Notably, CMKLR1 was the only protein that achieved significant recovery in both tissues, indicating that QMG may facilitate bidirectional communication along the gut–retina axis through systemic regulation of CMKLR1 expression.
The consistent directionality of expression changes for these five proteins in both colonic and retinal tissues holds important biological significance. As the primary habitat of the gut microbiota, changes in colonic protein expression reflect the state of the intestinal microenvironment, while the retina is the effector organ of DR. The consistency of expression patterns between these two tissues strongly supports the gut–retina axis as an important participant in the pathophysiological processes of DR.
QMG restores and improves the composition, diversity, and function of gut microbiota
The results of the community composition
Hierarchical clustering analysis revealed distinct shifts in gut microbial composition and clustering at multiple taxonomic levels following QMG intervention. At the phylum level (Figure 8A), the model group exhibited a marked reduction in Firmicutes abundance and a significant enrichment of Bacteroidetes compared with the blank group, indicating a diabetes-driven shift in the Firmicutes/Bacteroidetes ratio; notably, the intervention restored the proportions of both Firmicutes and Bacteroidetes to levels approaching those of the blank group, accompanied by an elevated relative abundance of Proteobacteria. At the class level (Figure 8B), the model group manifested an elevation in Bacteroidia and Clostridia and a lessening in Bacilli and Erysipelotrichia compared with the blank group; in contrast, the intervention group showed restoration in Bacteroidia and Erysipelotrichia to levels approaching those of the blank group, accompanied by elevated relative abundance of Clostridia and Alphaproteobacteria. At the order level (Figure 8C), the model group demonstrated an elevated proportion of Bacteroidales, and a decreased proportion of Erysipelotrichales and Lactobacillales compared with the blank group; conversely, the intervention group restored the proportions of Bacteroidales and Erysipelotrichales to levels approaching those of the blank group, accompanied by an elevated relative abundance of Clostridiales. At the family level (Figure 8D), the model group presented a growth in Odoribacteraceae, Peptostreptococcaceae, Rikenellaceae, and Tannerellaceae, and a decrease in Erysipelotrichaceae, Lactobacillaceae, Muribaculaceae, and Ruminococcaceae compared with the blank group; in contrast, the intervention group downregulated the proportions of Odoribacteraceae and Peptostreptococcaceae compared with the model group; restored the proportions of Erysipelotrichaceae and Ruminococcaceae to levels approaching those of the blank group, accompanied by an elevated relative abundance of Lachnospiraceae. At the genus level (Figure 8E), the model group exhibited an upward trend in Odoribacter, Paeniclostridium, Alistipes, Parabacteroides, and Clostridioides, and a decrease trend in Lactobacillus, Faecalibaculum, Ruminococcus, Bacteroides, and Muribaculum compared with the blank group; notably, the intervention group downregulated the proportions of Odoribacter, Clostridioides, and Paeniclostridium compared with the model group; restored the proportions of Faecalibaculum and Ruminococcus to levels approaching those of the blank group; and increased the relative abundance of Lachnoclostridium, Sphingomonas, Flavonifractor, and Blautia. At the species level (Figure 8F), the model group showed an increase in Odoribacter splanchnicus, Clostridioides difficile, and Paeniclostridium sordellii, and a decrease in Faecalibaculum rodentium, Bacteroides salanitronis, Muribaculum intestinale compared with the blank group; in contrast, the intervention group downregulated the proportion of Odoribacter splanchnicus and Clostridioides difficile compared with the model group; restored the proportions of Faecalibaculum rodentium, and Muribaculum intestinale, accompanied by elevated relative abundance of Lachnoclostridium phocaeense, and Flavonifractor plautii. Collectively, these findings indicate that QMG restored gut microbial composition across multiple taxonomic levels, shifting the community structure toward a homeostatic state.
The results of the Alpha diversity and Beta diversity
As indicated by the Alpha diversity results (Figure 9A), the intervention group exhibited the highest Chao1, PD, Simpson, and Shannon indices, while the model group displayed the lowest, with the blank group showing intermediate levels. These findings underscore the detrimental impact of DR on gut microbiota diversity and demonstrate that QMG intervention effectively restores and enhances microbial richness and evenness in DR mice.
As indicated by the Beta diversity representative results (Figure 9B,C), the principal coordinates analysis (PCoA) plots revealed a distinct separation of microbial communities across the three groups, which was statistically supported by the Permutational Multivariate Analysis of Variance (PERMANOVA). Specifically, the Bray-Curtis-based analysis indicated a significant structural divergence (PERMANOVA: R2 = 0.67, P < 0.001), suggesting that the DR model and QMG intervention accounted for a substantial proportion of the variation in microbial community composition. Consistent with this, the analysis based on Weighted unique fraction (UniFrac) distance, which incorporates phylogenetic relationships between taxa, further confirmed the significant community shift (PERMANOVA: R2 = 0.58, P < 0.01).
As displayed by the Beta diversity results (Figure 9D), the non-metric multidimensional scaling (NMDS) ordination plot demonstrated a clear spatial clustering of samples according to the respective groups, with a stress value of 0.04. Given that a stress value below 0.05 is generally considered to represent an excellent representation of the community structure in a reduced-dimensional space, these results collectively suggest that the QMG intervention significantly altered the global composition of the gut microbiota.
The results of the differential abundance analysis
According to the linear discriminant analysis effect size (LEfSe) analysis (Figure 9E), the results revealed that Clostridia, Clostridiales, Lachnospiraceae, and Lachnoclostridium were remarkably enriched in the intervention group, whereas Odoribacteraceae, Odoribacter, Peptostreptococcaceae, and Paeniclostridium were notably enriched in the model group. Therefore, the above gut microbiota might be the primary differential microbiota responsible for the intergroup differences between the model and intervention groups.
The results of community function prediction
The predicted functional profiles at Level 2 and Level 3 showed distinct clustering patterns across the three groups (Figure 9F,G). Specifically, compared with the blank group, the model group exhibited a significant deviation in the relative abundance of metabolic pathways. Notably, this functional perturbation in the model group was largely ameliorated in the intervention group. The functional composition of the intervention group showed a substantial shift back towards the profile observed in the blank group, indicating that the QMG intervention effectively modulated the gut microbial functional structure. These results suggest that the intervention not only reshaped the taxonomic composition and structure of the gut microbiota but also restored its functional metabolic capacity toward a homeostatic state.
QMG modulates the gut–retina axis by coupling systemic inflammation and key regulatory proteins
Associations at global levels
At the kingdom level (Figure 10A–C), QMG improved the CMKLR1-centered network mainly by modulating Bacteria along the gut-retina axis. Specifically, Bacteria positively correlated with retinal PPAR-γ in the blank group (P < 0.01), but this association was not observed in the model group. Following QMG intervention, bacterial abundance positively correlated with retinal CMKLR1 and Wnt5a yet negatively correlated with colonic TP53 and PPAR-γ (P < 0.01).
At the phylum level (Figure 10D–F), QMG improved the CMKLR1-centered network mainly by modulating Candidatus and Bacteroidetes along the gut-retina axis. Specifically, the positive correlation between Candidatus and colonic CMKLR1 observed in the blank group was lost following DR induction, but was restored by QMG intervention, which was accompanied by a negative correlation with serum IL-1β and TNF-α, while positively correlated with retinal PPAR-γ, AP-1, TP53, colonic AP-1, and serum IL-6 (P < 0.01). Proteobacteria in the model group negatively correlated with colonic CMKLR1 (P < 0.01), a trend that persisted following QMG intervention. Meanwhile, Firmicutes were positively correlated with retinal CMKLR1 in the model group, whereas Bacteroidetes and Tenericutes were negatively correlated with retinal CMKLR1 (P < 0.01). Following QMG intervention, Bacteroidetes shifted to positive correlations with retinal PPAR-γ, AP-1, TP53, and colonic CMKLR1 (P < 0.01). Additionally, Actinobacteria positively correlated with retinal CMKLR1 and Wnt5a (P < 0.01).
At the class level (Figure 10G–I), QMG improved the CMKLR1-centered network mainly by regulating Cytophagia and Bacteroidia along the gut-retina axis. Specifically, Cytophagia and Chitinophagia negatively correlated with retinal CMKLR1 in the blank group (P < 0.01). In the model group, Cytophagia, Bacteroidia, and Mollicutes negatively correlated with retinal CMKLR1, while colonic CMKLR1 positively correlated with Flavobacteriia and Epsilonproteobacteria, yet negatively with Tissierellia, Alphaproteobacteria, Clostridia, and Bacilli (P < 0.01). Following QMG intervention, Bacteroidia and Cytophagia positively correlated with colonic CMKLR1, retinal PPAR-γ, AP-1, TP53, colonic AP-1 and serum IL-6, whereas Mollicutes, Deltaproteobacteria, Alphaproteobacteria, and Gammaproteobacteria showed the opposite pattern (P < 0.01). Moreover, Chlamydiia, Actinobacteria, Tissierellia, Bacilli, and Negativicute negatively correlated with retinal CMKLR1 and Wnt5a, while Coriobacteriia exhibited the reverse correlation (P < 0.01).
At the order level (Figure 10J–L), QMG improved the CMKLR1-centered network mainly by modulating Bacteroidales, Bacillales, and Clostridiales along the gut–retina axis. Specifically, Cytophagales and Chitinophagales negatively correlated with retinal CMKLR1, whereas Marinilabiliales positively correlated with colonic CMKLR1 in the blank group (P < 0.01). In the model group, Mycoplasmatales, Cytophagales, Bacteroidales, and Marinilabiliales negatively correlated with retinal CMKLR1, while colonic CMKLR1 positively correlated with Flavobacteriales and Campylobacterales, yet negatively with Tissierellales, Bacillales, Sphingomonadales, Clostridiales, and Lactobacillales (P < 0.01). Following QMG intervention, Bacteroidales and Clostridiales positively correlated with colonic CMKLR1, AP-1, retinal PPAR-γ, AP-1, TP53, and serum IL-6, whereas Desulfovibrionales, Rhizobiales, Sphingomonadales, and Enterobacterales showed the opposite pattern (P < 0.01). Moreover, Eggerthellales and Coriobacteriales positively correlated with retinal CMKLR1 and Wnt5a, yet negatively with colonic TP53 and PPAR-γ, whereas Chlamydiales, Thermoanaerobacterales, Corynebacteriales, Tissierellales, and Bacillales exhibited the reverse correlation (P < 0.01).
Associations at Fine levels
At the family level (Figure 11A–C), QMG improved the CMKLR1-centered network primarily by modulating Lachnospiraceae, Bacteroidaceae, and Lactobacillaceae along the gut–retina axis. Specifically, Ruminococcaceae negatively correlated with retinal CMKLR1, whereas Lachnospiraceae positively correlated with retinal CMKLR1 in the blank group (P < 0.01). In the model group, Peptostreptococcaceae positively correlated with retinal CMKLR1, while Tannerellaceae, Bacteroidaceae, Odoribacteraceae, and Lachnospiraceae showed the opposite pattern (P < 0.01). Meanwhile, colonic CMKLR1 positively correlated with Marinilabiliaceae, Rikenellaceae, and Flavobacteriaceae, yet negatively with Lachnospiraceae and Lactobacillaceae (P < 0.01). Following QMG intervention, Enterobacteriaceae, Sphingomonadaceae, and Oscillospiraceae negatively correlated with colonic CMKLR1, AP-1, and serum IL-6, as well as retinal PPAR-γ, AP-1, and TP53, while positively correlating with serum IL-1β and TNF-α, whereas Peptococcaceae, Bacteroidaceae, Muribaculaceae, and Rikenellaceae showed the opposite pattern (P < 0.01). Moreover, Veillonellaceae, Peptostreptococcaceae, Lactobacillaceae, and Ruminococcaceae negatively correlated with retinal CMKLR1 and Wnt5a, yet positively with colonic TP53 and PPAR-γ, whereas Eggerthellaceae, Lachnospiraceae, and Hungateiclostridiaceae exhibited the reverse correlation (P < 0.01).
At the genus level (Figure 11D–F), QMG improved the CMKLR1-centered network primarily by modulating Lachnoclostridium, Clostridioides, and Bacteroides along the gut–retina axis. Specifically, Ruminococcus negatively correlated with retinal CMKLR1, whereas Lachnoclostridium showed the opposite pattern in the blank group (P < 0.01). In the model group, Lactobacillus and Sphingomonas negatively correlated with colonic CMKLR1, while Alistipes and Croceibacter positively correlated with colonic CMKLR1 (P < 0.01). Meanwhile, retinal CMKLR1 positively correlated with Paeniclostridium and Clostridioides, yet negatively with Mucinivorans, Intestinimonas, Flavonifractor, Parabacteroides, Bacteroides, Odoribacter, and Lachnoclostridium (P < 0.01). Following QMG intervention, Sphingomonas and Oscillibacter negatively correlated with colonic CMKLR1, AP-1, and serum IL-6, as well as retinal PPAR-γ, AP-1, and TP53, while positively correlating with serum IL-1β and TNF-α, whereas Bacteroides, Muribaculum, and Alistipes showed the opposite pattern (P < 0.01). Moreover, Dialister, Flavonifractor, Clostridioides, Ruminococcus, and Paeniclostridium negatively correlated with retinal CMKLR1 and Wnt5a, yet positively with colonic TP53 and PPAR-γ, whereas Pseudoclostridium, Lachnoclostridium, and Blautia exhibited the reverse correlation (P < 0.01).
At the species level (Figure 11G–I), QMG improved the CMKLR1-centered network primarily by modulating Clostridioides difficile, Alistipes shahii, and Paeniclostridium sordellii along the gut–retina axis. Specifically, Ruminococcus bicirculans and endosymbiont 'TC1' of Trimyema compressum negatively correlated with retinal CMKLR1, whereas Lactobacillus fermentum and Lactobacillus helveticus displayed the opposite pattern in the blank group (P < 0.01). In the model group, Croceibacter atlanticus, Alkalitalea saponilacus, Alistipes finegoldii, and Alistipes shahii positively correlated with colonic CMKLR1, while Sphingomonas panacis, Paeniclostridium sordellii, Clostridioides difficile, and Lactobacillus murinus positively correlated with retinal CMKLR1, yet Odoribacter splanchnicus, Mucinivorans hirudinis, Lachnoclostridium phocaense, Flavonifractor plautii, and Intestinimonas butyriciproducens showed the opposite pattern (P < 0.01). Following QMG intervention, Alistipes shahii and Muribaculum intestinale positively correlated with colonic CMKLR1, AP-1, and serum IL-6, as well as retinal PPAR-γ, AP-1, and TP53, while negatively correlating with serum IL-1β and TNF-α, whereas Sphingomonas panacis, Oscillibacter sp. PEA192, and Oscillibacter valericigenes exhibited the reverse pattern (P < 0.01). Moreover, Pseudoclostridium thermosuccinogenes, Lachnoclostridium phocaense, Bacteroides salanitronis, and Blautia sp. N6H1-15 positively correlated with retinal CMKLR1 and Wnt5a, yet negatively with colonic TP53 and PPAR-γ, whereas Paeniclostridium sordellii, Flavonifractor plautii, endosymbiont 'TC1' of Trimyema compressum, Clostridioides difficile, and Dialister pneumosintes showed the reverse correlation (P < 0.01). The detailed correlation results at kingdom, phylum, class, order, family, genus, and species levels are presented in Supplementary File 1.
DATA AVAILABILITY:
The 16S rDNA sequencing datasets generated and analyzed during the current study are available in the National Center for Biotechnology Information (NCBI) Sequence Read Archive (SRA) repository under the BioProject accession number: PRJNA1281561. All other data generated or analyzed during this study are included in this article.
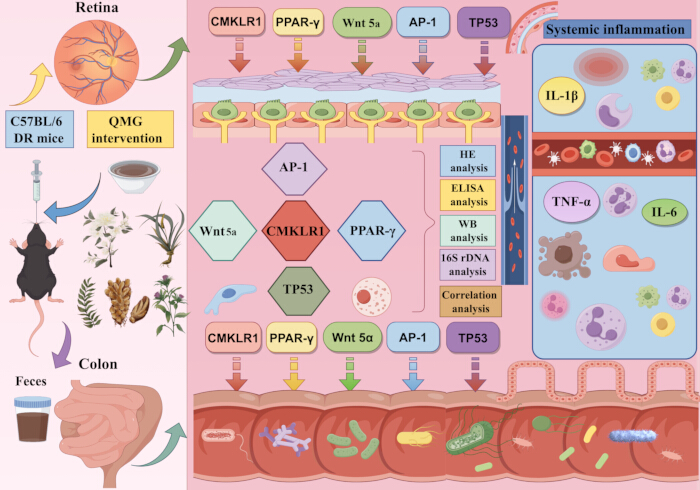
Figure 1: Graphical abstract. The graphical abstract shows the process of this study. Please click here to view a larger version of this figure.
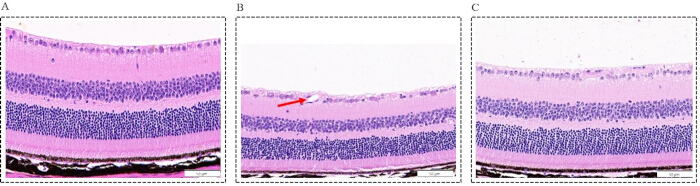
Figure 2: Morphological changes in the retina across the three groups (Scale bar = 50 µm, Magnification: ×400). (A) Blank group: representative photomicrographs of hematoxylin-eosin (HE)-stained retinal sections, showing an intact, well-organized retinal architecture with neatly arranged cellular layers; (B) Model group: representative photomicrographs of HE-stained retinal sections, showing marked structural disorganization, characterized by disordered cellular arrangement, a significant reduction in retinal ganglion cell (RGC) counts (P < 0.0001), pronounced thinning of the retinal thickness (P < 0.0001), and neovascular tufts penetrating the inner limiting membrane (indicated by a red arrow); (C) Intervention group: representative photomicrographs of HE-stained retinal sections, showing significant attenuation of histopathological abnormalities relative to the model group, as evidenced by restoration of retinal laminar architecture, partial recovery of RGC numbers (P < 0.001), and restoration of retinal thinning (P < 0.01). Please click here to view a larger version of this figure.
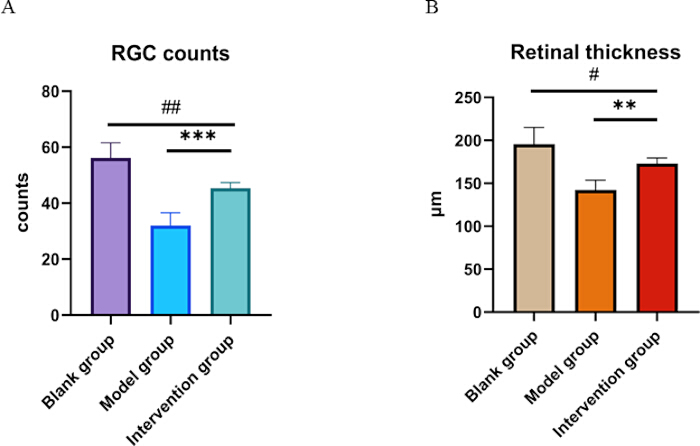
Figure 3: Histological quantification of RGC counts and retinal thickness. (A) Quantification of RGC counts in the ganglion cell layer. (B) Measurement of total retinal thickness (µm). Data are shown as mean ± SD (n = 6 per group). Compared with the blank group: #P <0.05, ##P <0.01; compared with the model group: **P <0.01, ***P <0.001. Please click here to view a larger version of this figure.
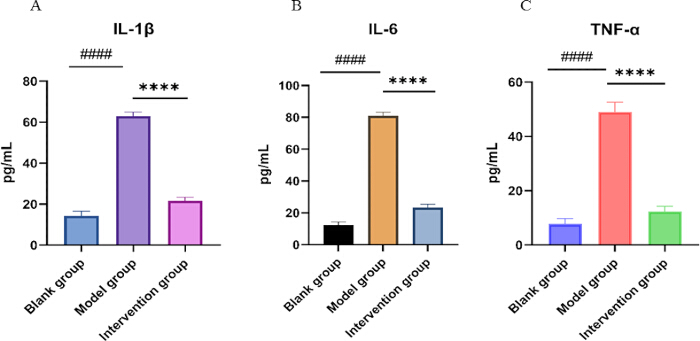
Figure 4: Serum concentrations of inflammatory cytokines in the three groups. Bar charts showing ELISA‑based quantification of serum IL‑1β (A), IL‑6 (B), and TNF‑α (C) levels in the blank control, model group, and intervention groups. Data are expressed as mean ± SD (n = 6 per group). Compared with the blank group: ####P < 0.0001; compared with the model group: ****P < 0.0001. Please click here to view a larger version of this figure.
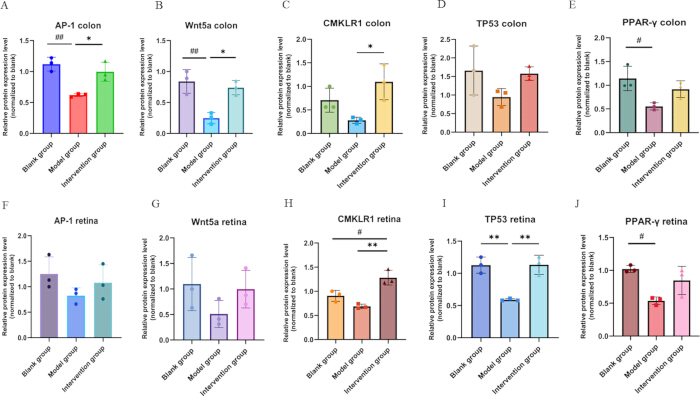
Figure 5: Bar chart of the expression levels of key regulatory proteins in the retina and colon. (A) Relative protein expression level (normalized to blank) of AP-1 in the colon (n = 3); (B) Relative protein expression level (normalized to blank) of Wnt5a in the colon (n = 3); (C) Relative protein expression level (normalized to blank) of CMKLR1 in the colon (n = 3); (D) Relative protein expression level (normalized to blank) of TP53 in the colon (n = 3); (E) Relative protein expression level (normalized to blank) of PPAR-γ in the colon (n = 3); (F) Relative protein expression level (normalized to blank) of AP-1 in the retina (n = 3); (G) Relative protein expression level (normalized to blank) of Wnt5a in the retina (n = 3); (H) Relative protein expression level (normalized to blank) of CMKLR1 in the retina (n = 3); (I) Relative protein expression level (normalized to blank) of TP53 in the retina (n = 3); (J) Relative protein expression level (normalized to blank) of PPAR-γ in the retina (n = 3). Compared with the blank group: #P < 0.05, ##P < 0.01; compared with the model group: *P < 0.05, **P < 0.01. Please click here to view a larger version of this figure.
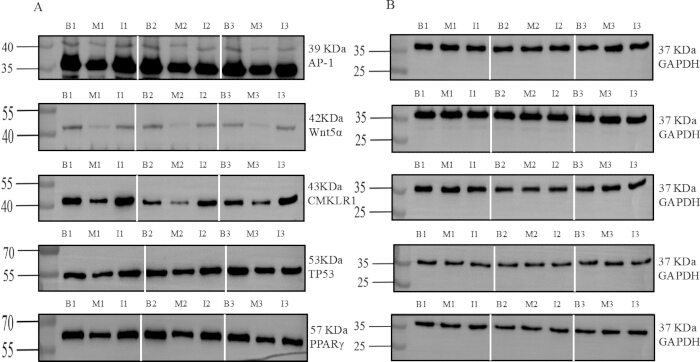
Figure 6: Representative WB grayscale blots of key regulatory proteins in the colon. (A) Target protein expression: AP-1, Wnt5a, CMKLR1, TP53, and PPAR-γ; (B) Loading control: GAPDH. Vertical white lines separate replicate sets (Rep1, Rep2, Rep3); Molecular weight markers (kDa) are indicated on the left, and protein names with corresponding kDa are shown on the right. Lanes are labeled as: B1 (Blank group 1), M1 (Model group 1), I1 (Intervention group 1); B2 (Blank group 2), M2 (Model group 2), I2 (Intervention group 2); B3 (Blank group 3), M3 (Model group 3), I3 (Intervention group 3). Full-length, uncropped Western blot (WB) images with visible molecular weight markers have been provided as Supplementary Figure 2. Please click here to view a larger version of this figure.
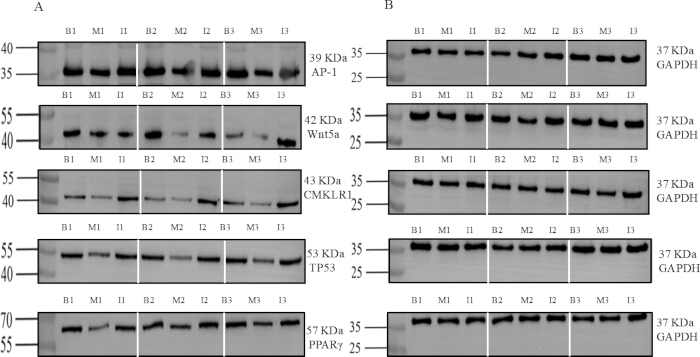
Figure 7: Representative WB grayscale blots of key regulatory proteins in the retina. (A) Target protein expression: AP-1, Wnt5a, CMKLR1, TP53, and PPAR-γ; (B) Loading control: GAPDH. Vertical white lines separate replicate sets (Rep1, Rep2, Rep3); Molecular weight markers (kDa) are indicated on the left, and protein names with corresponding kDa are shown on the right. Lanes are labeled as: B1 (Blank group 1), M1 (Model group 1), I1 (Intervention group 1); B2 (Blank group 2), M2 (Model group 2), I2 (Intervention group 2); B3 (Blank group 3), M3 (Model group 3), I3 (Intervention group 3). Full-length, uncropped WB images with visible molecular weight markers have been provided as Supplementary Figure 2. Please click here to view a larger version of this figure.
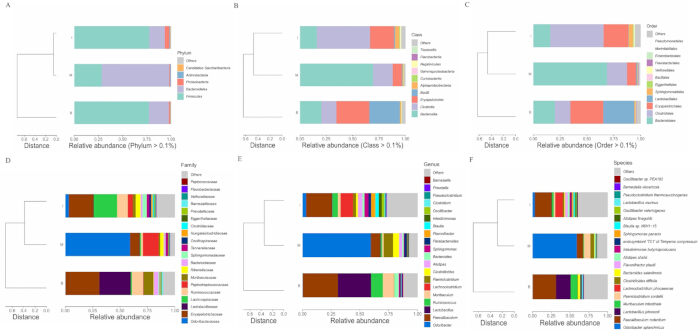
Figure 8: Hierarchical clustering of gut microbiota composition at different levels. Hierarchical clustering dendrogram based on Bray-Curtis dissimilarity among the blank control (B), model group(M), and intervention group (I). The branch length represents the degree of structural divergence. Stacked bar chart depicting the relative abundances of dominant phyla across the three groups. Phyla falling below the threshold are aggregated as “Others”. (A) Qiming granule (QMG) rebalances the gut microbiota composition at the phylum level; (B) QMG rebalances the gut microbiota composition at the class level; (C) QMG rebalances the gut microbiota composition at the order level; (D) QMG rebalances the gut microbiota composition at the family level; (E) QMG rebalances the gut microbiota composition at the genus level; (F) QMG rebalances the gut microbiota composition at the species level. Abbreviation: B, blank group; M, model group; I, intervention group. Please click here to view a larger version of this figure.
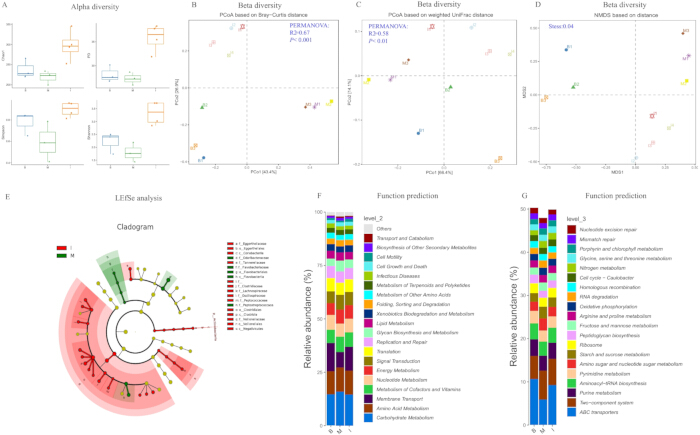
Figure 9: Analysis of gut microbiota diversity, differential abundance, and predicted functional pathways. (A) Alpha diversity analysis assessed by Chao1, PD, Simpson, and Shannon indices revealed that the intervention group exhibited higher microbial diversity than the model group, indicating that QMG treatment effectively restores gut microbial richness and evenness. (B) Beta diversity analysis assessed by principal coordinates analysis (PCoA) based on Bray-Curtis distance revealed significant differences among groups (PERMANOVA: R2=0.67, P < 0.001), indicating that the DR model and QMG intervention accounted for a substantial proportion of the variation in microbial community composition. (C) Beta diversity analysis assessed by PCoA based on weighted unique fraction (UniFrac) distance further confirmed the significant community shift (PERMANOVA: R2= 0.58, P < 0.01). (D) Beta diversity analysis assessed by non-metric multidimensional scaling (NMDS) ordination demonstrated a stress value of 0.04, suggesting that the QMG intervention significantly altered the global composition of the gut microbiota. (E) Cladogram of differential abundance analysis assessed by linear discriminant analysis effect size (LEfSe) revealed the primary differential microbiota between the model and intervention groups. Functional prediction of the gut microbiota at KEGG Level 2 (F) and KEGG Level 3 (G) suggested that the intervention not only reshaped the taxonomic composition and structure of the gut microbiota but also restored its functional metabolic capacity toward a homeostatic state. Please click here to view a larger version of this figure.
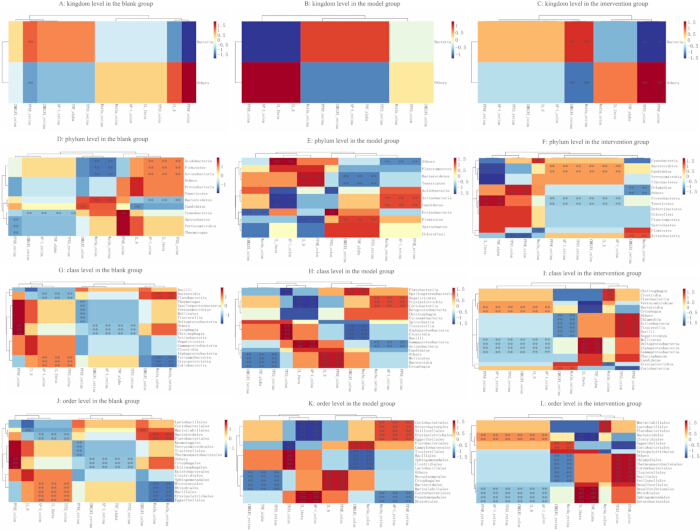
Figure 10: Global association of gut microbiota with inflammatory and regulatory factors. (A) Association of gut microbiota at kingdom level in the blank group; (B) Association of gut microbiota at kingdom level in the model group; (C) Association of gut microbiota at kingdom level in the intervention group; (D) Association of gut microbiota at phylum level in the blank group; (E) Association of gut microbiota at phylum level in the model group; (F) Association of gut microbiota at phylum level in the intervention group; (G) Association of gut microbiota at class level in the blank group; (H) Association of gut microbiota at class level in the model group; (I) Association of gut microbiota at class level in the intervention group; (J) Association of gut microbiota at order level in the blank group; (K) Association of gut microbiota at order level in the model group; (L) Association of gut microbiota at order level in the intervention group. Please click here to view a larger version of this figure.
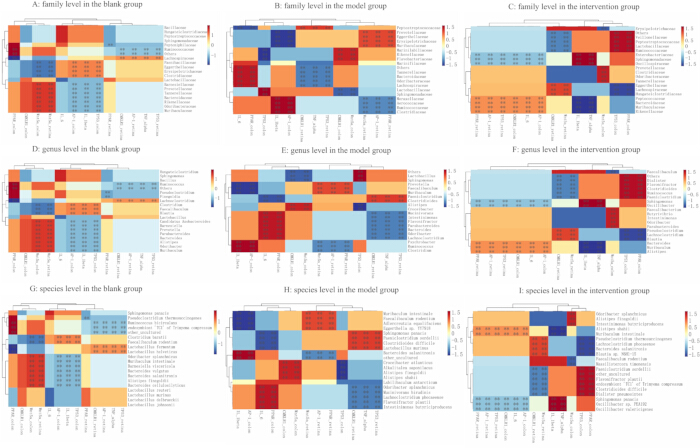
Figure 11: Fine association of gut microbiota with inflammatory and regulatory factors. (A) Association of gut microbiota at the family level in the blank group; (B) Association of gut microbiota at the family level in the model group. (C) Association of gut microbiota at family level in the intervention group; (D) Association of gut microbiota at genus level in the blank group; (E) Association of gut microbiota at genus level in the model group; (F) Association of gut microbiota at genus level in the intervention group; (G) Association of gut microbiota at species level in the blank group; (H) Association of gut microbiota at species level in the model group;(I) Association of gut microbiota at species level in the intervention group. Please click here to view a larger version of this figure.
| Groups (n = 6) | RGCs counts | Retinal thickness |
| Blank group | 56.17 ± 5.382 | 195.50 ± 19.54 μm |
| Model group | 32.00 ± 4.561#### | 142.30 ± 11.34 μm#### |
| Intervention group | 45.33 ± 2.066 ##*** | 173.00 ± 6.575 μm#** |
| p | <0.0001 | <0.0001 |
Table 2: Quantitative analysis of RGC counts and retinal thickness in the three experimental groups. Data are presented as Mean ± SD (n = 6 per group). Compared with the blank group: #P <0.05, ##P <0.01, ####P <0.0001; compared with the model group: **P <0.01, ***P <0.001.
| Groups (n = 6) | IL-1β | IL-6 | TNF-α |
| Blank group | 14.31 ± 2.28 | 12.48 ± 1.774 | 7.728 ± 2.048 |
| Model group | 62.88 ± 2.01#### | 80.95 ± 2.247#### | 49.00 ± 3.647#### |
| Intervention group | 21.7 ± 1.654**** | 23.27 ± 2.074**** | 12.35 ± 1.891**** |
| P | <0.0001 | <0.0001 | <0.0001 |
Table 3: Serum expression levels of IL-1β, IL-6, and TNF-α in the three experimental groups. Data are presented as Mean ± SD (n = 6 per group). Cytokine concentrations were determined by enzyme‑linked immunosorbent assay (ELISA) and are reported in pg/mL. Compared with the blank group: ####P < 0.0001; compared with the model group: ****P < 0.0001.
Supplementary Figure 1: Experimental Design and Study Timeline. Schematic overview of the experimental design.Please click here to download this file.
Supplementary Figure 2: Original, full-length, uncropped WB images corresponding to Figure 6 and Figure 7. Raw images without modification contain all molecular weight markers in colon and retina blots for AP-1, Wnt5a, TP53, CMKLR1, PPAR-γ, and loading control GAPDH. Molecular weight markers (kDa) are indicated. Lanes are labeled: B1 (Blank group 1), M1 (Model group 1), I1 (Intervention group 1); B2 (Blank group 2), M2(Model group 2), I2 (Intervention group 2); B3 (Blank group 3), M3 (Model group 3), I3 (Intervention group 3). The original blots were not subjected to high-contrast adjustments.Please click here to download this file.
Supplementary File 1: Detailed correlation analyses of gut microbiota with inflammatory and regulatory factors.Please click here to download this file.
Discussão
A retinopatia diabética (RD) é uma complicação neurovascular complexa causada pela hiperglicemia crônica, inflamação e desregulação metabólica22. A Academia Americana de Oftalmologia classifica a RD em RD não proliferativa e RD proliferativa, caracterizada pelo início da neovascularização23. Diante das limitações das estratégias terapêuticas atuais, a exploração de novos mecanismos surgiu como uma abordagem promissora para o tratamento da RD. Notavelmente, avanços recentes identificaram o eixo intestino-retina como um alvo terapêutico crítico, porém subutilizado, para a RD. O eixo intestino-retina, inicialmente introduzido e descrito por Sheldon Rowan em 20176, ganhou destaque nos processos fisiopatológicos das doenças oculares. No entanto, os mecanismos moleculares específicos que sustentam o papel do eixo intestino-retina na patogênese e progressão da RD ainda permanecem obscuros, o que dificulta o desenvolvimento e a aplicação clínica de estratégias terapêuticas direcionadas a esse eixo.
Neste estudo, avaliamos sistematicamente a eficácia e os mecanismos subjacentes do QMG contra a DR. Esses achados fornecem evidências preliminares de que o QMG atenua os danos histopatológicos retinianos, suprime a inflamação sistêmica, restaura a homeostase da microbiota intestinal e modula bidirecionalmente proteínas reguladoras-chave (a rede reguladora centrada no CMKLR1) tanto no cólon quanto na retina, estabelecendo assim o QMG como um possível modulador do eixo intestino-retina. A inflamação sistêmica crônica e de baixo grau é uma característica marcante do DM e um dos principais fatores impulsionadores dos danos microvasculares retinianos e da progressão da DR24. Os resultados do ELISA demonstraram que os níveis séricos de IL-1β, IL-6 e TNF-α estavam significativamente elevados em camundongos modelo de DR (P < 0,0001), confirmando a presença de uma resposta inflamatória sistêmica acentuada no estado de DR. A liberação descontrolada dessas citocinas pode romper a barreira hematorretiniana, promover a apoptose das células ganglionares da retina (RGC) e induzir neovascularização patológica. Após a intervenção com QMG, os níveis dessas citocinas foram significativamente reduzidos (P < 0,0001), enquanto a integridade estrutural da retina foi restaurada, a sobrevivência das RGC aumentou e a espessura retiniana foi preservada. Esses resultados indicam que os efeitos protetores retinianos do QMG estão estreitamente associados à sua potente atividade anti-inflamatória sistêmica. Notavelmente, esse efeito anti-inflamatório sistêmico não ocorre isoladamente, mas está associado à modulação da microbiota intestinal mediada pelo QMG e à restauração de proteínas reguladoras-chave no cólon, sugerindo que o QMG pode exercer seus efeitos terapêuticos por meio de um eixo “intestino-inflamação sistêmica-retina”.
Para elucidar mais detalhadamente o mecanismo molecular pelo qual QMG exerce seus efeitos anti-DR ao longo do eixo intestino-retina, a expressão proteica da rede reguladora centrada em CMKLR1 (incluindo CMKLR1, Wnt5a, TP53, AP-1 e PPAR-γ) foi analisada em tecidos tanto do cólon quanto da retina. Os resultados mostraram que, após a indução do modelo de DR, as cinco proteínas exibiram uma tendência decrescente consistente tanto no cólon quanto na retina, sugerindo que a comunicação sinalética entre o intestino e a retina pode estar sistemicamente bloqueada em condições de DR. Após a intervenção com QMG, CMKLR1 foi significativamente superexpresso tanto no cólon quanto na retina (P < 0,05 e P < 0,01), indicando que QMG pode restaurar a comunicação bidirecional ao longo do eixo intestino-retina por meio da ativação sistêmica de CMKLR1. Além disso, QMG restaurou significativamente a expressão de AP-1 e Wnt5a no cólon, bem como a expressão de TP53 na retina, sugerindo que diferentes proteínas podem desempenhar papéis funcionais específicos de tecido ao longo desse eixo: AP-1 e Wnt5a são respostas mais sensíveis ao QMG no cólon, enquanto TP53, como regulador da apoptose, desempenha um papel mais crítico na neuroproteção retiniana. Uma análise de correlação adicional revelou que a expressão colônica de AP-1, CMKLR1, PPAR-γ e Wnt5a apresentou correlação negativa significativa com os níveis sistêmicos de citocinas inflamatórias (IL-1β, IL-6, TNF-α) (P < 0,05 a P < 0,001), enquanto nenhuma correlação direta foi observada entre citocinas séricas e a expressão proteica retiniana. Essa discrepância possui implicações mecanicistas importantes: QMG pode atuar principalmente no microambiente intestinal, restaurando a expressão de proteínas reguladoras-chave no cólon, suprimindo assim a inflamação sistêmica; por outro lado, a recuperação das proteínas retinianas pode ocorrer por meio de vias indiretas, como a translocação de metabólitos derivados da microbiota intestinal para a circulação, que então regulam remotamente as cascatas de sinalização retiniana, ao invés de serem mediadas diretamente por fatores inflamatórios sistêmicos. Esse achado apoia um modelo regulador axial “intestino-inflamação sistêmica-retina” e fornece evidências mecanicistas fundamentais para o efeito terapêutico de QMG sobre DR por meio do eixo intestino-retina. Dentre os alvos investigados, CMKLR1 apresentou alterações significativas em ambos os tecidos retiniano e colônico, surgindo como um possível biomarcador primário que conecta o eixo intestino-retina. CMKLR1 já foi implicado em estudos anteriores no metabolismo de glicolipídios, na gravidade de DR e na modulação da microbiota intestinal25,26,27,28,29,30, sugerindo que sua expressão diferencial ao longo do eixo intestino-retina pode refletir seu envolvimento em múltiplos processos patológicos. Esses achados posicionam CMKLR1 como um promissor candidato a biomarcador para o diagnóstico e intervenção terapêutica de DR, exigindo validação mecanicista adicional.
Embora o CMKLR1 atue como um nó central no eixo intestino-retina, o efeito terapêutico do QMG é alcançado por meio de uma rede reguladora multidimensional na qual Wnt5a, TP53, AP-1 e PPAR-γ fornecem suporte sinérgico essencial. A sinalização Wnt é fundamental para a homeostase do epitélio intestinal e para a saúde do cólon, incluindo seus papéis na integridade epitelial, modulação da inflamação e proteção da mucosa mediada pela microbiota31,32,33,34. O PPAR-γ regula as respostas inflamatórias e demonstrou inibir fagócitos ativados por lipídios na DR e promover a sobrevivência de fotorreceptores por meio da modulação microglial35,36,37. O AP-1 atua como um fator de transcrição por meio do qual metabólitos microbianos intestinais, como o ácido desoxicólico, influenciam a homeostase inflamatória e imunológica38,39,40,41. O TP53 está envolvido na autofagia, apoptose e lesão neuronal retiniana sob condições de hiperglicemia42,43,44,45. Em conjunto, esses nós de sinalização formam uma rede interconectada que liga a dinâmica microbiana intestinal à patologia retiniana, levando-nos a investigar se o QMG modula essa rede ao longo do eixo intestino-retina.
Um mecanismo fundamental pelo qual a inflamação sistêmica é regulada origina-se no ecossistema intestinal. A análise de sequenciamento do gene 16S rDNA revelou uma disbiose estrutural induzida pelo diabetes no grupo modelo, caracterizada por um desequilíbrio significativo na razão Firmicutes/Bacteroidetes, um enriquecimento de táxons potencialmente patogênicos (por exemplo, Odoribacter e Clostridioides) e uma redução de táxons benéficos (por exemplo, Lactobacillus e Faecalibaculum). De forma notável, o tratamento com QMG atuou como um agente restaurador da microbiota, revertendo essas alterações patológicas por meio de: (i) Restauração da homeostase microbiana: normalização das proporções de famílias e gêneros-chave (Faecalibaculum, Ruminococcus, Erysipelotrichaceae) em direção à linha de base do grupo controle; (ii) Modulação direcionada de patobiontes: supressão do crescimento excessivo associado ao diabetes de Odoribacter splanchnicus e Clostridioides difficile; (iii) Promoção da assembleia de comunidades benéficas: indução da proliferação de táxons com atividade anti-inflamatória ou produtores de metabólitos, tais como Lachnoclostridium, Blautia e Flavonifractor plautii. Além disso, as análises de diversidade e a análise de correlação de Spearman em múltiplos níveis indicaram que a intervenção com QMG reequilibra efetivamente a composição central em múltiplos níveis, favorecendo interações protetoras entre o hospedeiro e os microrganismos ao longo do eixo intestino-retina. Esse resultado não apenas confirma o efeito regulador do QMG sobre a microbiota intestinal, mas também revela uma estratégia terapêutica potencial pela qual o QMG coordena a remodelação da microbiota com a atividade de proteínas reguladoras-chave (por exemplo, IL-6, TP53) para conjuntamente suprimir a inflamação sistêmica e, assim, aliviar a retinopatia diabética.
Estudos recentes confirmaram que a MTC exerce uma regulação multialvo sobre o eixo microbiota-metabolismo-imunidade, o que a distingue dos agentes farmacêuticos de alvo único46. Evidências crescentes demonstraram o potencial terapêutico do QMG na DR e em condições oculares relacionadas. Um ensaio clínico randomizado e controlado multicêntrico mostrou que o QMG reduziu significativamente o tempo de circulação arteriovenosa retiniana em pacientes com DR, sugerindo melhora no fluxo sanguíneo retiniano e na hipóxia47. Meta-análises confirmaram ainda que o QMG combinado ao tratamento convencional melhorou significativamente a espessura macular central, a acuidade visual e a taxa global de eficácia no edema macular diabético48, além de prolongar o tempo de ruptura da película lacrimal e aumentar a secreção lacrimal em pacientes com doença do olho seco49. Em pacientes com lesão nervosa associada à DRNP, o QMG demonstrou não inferioridade em relação ao cálcio dobesilato na preservação da espessura da camada de fibras nervosas retinianas e da área da zona avascular foveal50. Estudos mecanicistas revelaram que o QMG protege contra danos retinianos por meio de múltiplas vias, incluindo a inibição da piroptose de células de Müller e da inflamação imune pela via P2X7R/NLRP351, a ativação da via de sinalização PI3K/Akt para reduzir a apoptose e a modulação de proteínas de junções firmes para preservar a integridade da barreira hematorretiniana52. Análises de farmacologia em rede identificaram múltiplos compostos bioativos no QMG que atuam de forma sinérgica sobre alvos relacionados à DR16, e estudos clínicos não relataram eventos adversos graves, indicando um perfil de segurança favorável50. A eficácia terapêutica do QMG é atribuída às ações sinérgicas de seus componentes ativos, incluindo quercetina, quercetrol, isorramnetina, formononetina e β‑sitosterol, que conjuntamente exercem efeitos anti-inflamatórios, antioxidantes e antiapoptóticos ao atuar sobre IL‑6, TNF‑α, TP53 e AP‑153,54,55,56,57,58,59. O presente estudo amplia esse conhecimento demonstrando que os efeitos protetores do QMG também são mediados pela modulação do eixo intestino-retina, especificamente pela restauração da homeostase da microbiota intestinal e pela regulação da rede molecular centrada em CMKLR1 para suprimir a inflamação sistêmica e aliviar os danos retinianos.
Várias limitações deste estudo devem ser observadas e exigem investigação adicional em pesquisas futuras. Primeiro, a relação causal entre alterações microbianas intestinais e melhorias funcionais na retina requer validação adicional. Embora fortes correlações tenham sido observadas entre a reestruturação da microbiota induzida por QMG e fenótipos protetores retinianos, experimentos diretos de inferência causal, como transplante de microbiota fecal, modelos animais livres de germes ou esgotamento da microbiota induzido por antibióticos, seriam valiosos para confirmar essa relação em estudos futuros. Segundo, a sequenciação do 16S rDNA foi empregada para caracterizar a composição microbiana, o que fornece resolução taxonômica adequada ao nível de gênero e superiores, mas possui capacidade limitada de fornecer informações funcionais ao nível de cepa ou potencial metabólico preciso. A sequenciação metagenômica ou análises metabolômicas serão realizadas em estudos subsequentes para identificar as principais vias funcionais microbianas reguladas pelo QMG. Terceiro, as alterações microbianas foram avaliadas apenas no ponto final do experimento, impedindo o acompanhamento dinâmico da evolução temporal da reconstrução da microbiota durante a intervenção com QMG. A amostragem longitudinal em estudos futuros ajudará a delinear a cinética da reestruturação da microbiota induzida por QMG e sua relação temporal com a proteção retiniana. Quarto, embora a análise histopatológica tenha observado afinamento retiniano, perda de células ganglionares da retina (RGC) e brotos neovasculares, estudos futuros devem explorar protocolos de injeção múltipla de STZ e modelos diabéticos genéticos, além de fornecer uma caracterização mais abrangente do fenótipo de DR.
Em resumo, este estudo demonstra que o QMG melhora a DR ao acoplar a rede molecular centrada no CMKLR1 à inflamação sistêmica por meio do eixo intestino-retina. O mecanismo de ação do QMG manifesta-se em três níveis: no nível microbiano, o QMG reverte a disbiose intestinal induzida pelo diabetes (por exemplo, restaurando a razão Firmicutes/Bacteroidetes, suprimindo Odoribacter e Clostridioides e promovendo bactérias benéficas como Faecalibaculum); no nível molecular, o QMG regula a via CMKLR1/Wnt5a/PPAR-γ/AP-1/TP53 e atenua a inflamação sistêmica; no nível tecidual, o QMG protege a morfologia retiniana. Esses achados sustentam o QMG como uma promissora estratégia terapêutica via eixo intestino-retina para a DR e fornecem uma base mecanicista para a aplicação da MTC no tratamento de complicações diabéticas.
Divulgações
Os autores declaram que não possuem interesses financeiros concorrentes conhecidos ou relações pessoais que poderiam parecer ter influenciado o trabalho descrito neste artigo.
Agradecimentos
O autor gostaria de agradecer a todos os membros de sua equipe que forneceram grande apoio e assistência para concluir esta pesquisa.
Esta pesquisa foi apoiada pela Fundação Nacional de Ciências Naturais da China (Número do Convênio: 82474580) e pelo Projeto de Exploração Livre da Fundação Hospitalar do Hospital da Universidade de Medicina Chinesa de Chengdu (Nº 23ZYTS1601).
Materiais
| Nome | Empresa | Número de catálogo | Comentários |
|---|---|---|---|
| Anticorpo monoclonal AP-1 | Proteintech | 66313-1-IG | 1:5000 |
| Anticorpo policlonal CMKLR1 | Affinity | AF5291 | 1:1000 |
| Anticorpo policlonal GAPDH | Affinity | AF7021 | 1:5000 |
| GoatAnti-Mouse IgG(H+L) HRP | MULTI SCIENCES | GAM0072 | 1:10000 |
| GoatAnti-Rabbit IgG(H+L) HRP | MULTI SCIENCES | GAR0072 | 1:10000 |
| GraphPad Prism | / | versão 9.5 | |
| Image-Pro Plus | Media Cybernetics, Inc., Rockville, MD, EUA | versão 6.0 | |
| Plataforma Luoning Bio-Cloud | http://www.biomediv.cn/login.html | ||
| Kit ELISA para IL-1β de camundongo (Interleucina 1 Beta) | Elabscience | E-EL-M0037 | Detecção de citocinas séricas |
| Kit ELISA para IL-6 (Interleucina-6) de camundongo | Elabscience | E-EL-M0044 | Detecção de citocinas séricas |
| Kit ELISA para TNF-α de camundongo (Fator de Necrose Tumoral Alfa) | Elabscience | E-EL-M3063 | Detecção de citocinas séricas |
| NanoFilt | / | versão 2.7.1 | |
| Sequenciador Nanopore GridION | Oxford Nanopore Technologies | https://store.nanoporetech.com/gridion.html | |
| Pannoramic SCAN II | Scanner 3DHISTECH Pannoramic SCAN | https://www.3dhistech.com/scanners/pannoramic-scan-ii-digital-scanner/ | |
| Anticorpo policlonal PPAR gama (PPAR-γ) | ImmunoWay | bs-0530R | 1:1000 |
| Python | / | versão 3.7.4 | |
| Granulado Qiming | Zhejiang Sansheng Mandi Pharmaceutical Co., Ltd. | Nº de Registro Nacional de Medicamentos da China Z20090036 | 0,9 g/kg, por gavagem oral |
| Linguagem de programação R | / | versão 4.0.3 | |
| Banco de dados SILVA | / | versão 138 | |
| Estreptozotocina (STZ) | Sigma-Aldrich | S0130 | 35 mg/kg, i.p. |
| Anticorpo policlonal TP53 | Abcam | ab131442 | 1:1000 |
| Usearch | / | versão 10.0.240 | |
| Anticorpo policlonal Wnt5a | Proteintech | 55184-1-AP | 1:1000 |
| Kit Zymo Research BIOMICS DNA Microprep | Zymo Research | D4301 | Extração de DNA genômico fecal |
Referências
- Lei C, et al. Homocysteine and diabetic retinopathy. Exp Eye Res. 2026;262:110729.
- Owens DR, et al. IDF diabetes Atlas: A worldwide review of studies utilizing retinal photography to screen for diabetic retinopathy from 2017 to 2024 inclusive. Diabetes Res Clin Pract. 2025;226:112346.
- Zhu J, Huang J, Sun Y, Xu W, Qian H. Emerging role of extracellular vesicles in diabetic retinopathy. Theranostics. 2024;14(4):1631–1646.
- Xie L, Lin W. The role of gut microbiota dysbiosis in the inflammatory pathogenesis of diabetic retinopathy. Front Immunol. 2025;16:1604315.
- Niu J, Liu Y, Peng H, Chen J, Chen L. Early-stage diabetic retinopathy: gut-metabolic triggers, immune-neurodegeneration, and interventions. Graefes Arch Clin Exp Ophthalmol. 2025;263(10):2723–2736.
- Rowan S, et al. Involvement of a gut-retina axis in protection against dietary glycemia-induced age-related macular degeneration. Proc Natl Acad Sci U S A. 2017;114(22):E4472–E4481.
- Rzeczycki P, Pęciak O, Plust M, Droździk M. Gut Microbiota in the Regulation of Intestinal Drug Transporters: Molecular Mechanisms and Pharmacokinetic Implications. Int J Mol Sci. 2025;26(24):11897.
- Yang H, et al. Mediating role of aging and obesity in the relationship between dietary index for gut microbiota and metabolic syndrome and its potential regulatory mechanisms. Eur J Med Res. 2025;31(1):137.
- Zahavi EE, et al. Repeat-element RNAs integrate a neuronal growth circuit. Cell. 2025;188(16):4350–4365.e22.
- Dander E, et al. The chemerin/CMKLR1 axis regulates intestinal graft-versus-host disease. JCI Insight. 2023;8(5):e154440.
- Zhang J, et al. Therapeutic targets in the Wnt signaling pathway: Treating cancer with specificity. Biochem Pharmacol. 2025;236:116848.
- Liu M, Lim ST, Song W, Coffman TM, Wang X. Beyond lipids: fenofibrate in diabetic retinopathy and nephropathy. Trends Pharmacol Sci. 2026;47(3):325–341.
- Wu Y, et al. The active ingredient β-sitosterol in the anti-inflammatory agents alleviates perianal inflammation in rats by inhibiting the expression of Srebf2, activating the PPAR signaling pathway, and altering the composition of gut microbiota. Int Immunopharmacol. 2025;152:114470.
- Lin T, Chen C, Zhao LC, Zhu HY, Li W. The beneficial effects of Traditional Chinese Medicine on diabetic retinopathy: mechanisms, therapeutics, and prospects. Acupunct Herb Med 2026;6(2):188–204.
- Huo J, et al. Evaluation of individualized treatment of nonproliferative diabetic retinopathy: a multicenter, randomized, parallel-controlled study. J Tradit Chin Med. 2022;42(1):90–95.
- Huang Y, et al. Pharmacological mechanism and clinical study of Qiming granules in treating diabetic retinopathy based on network pharmacology and literature review. J Ethnopharmacol. 2023;302(Pt A):115861.
- Salma B, et al. Ameliorative Efficacy of the Cassia auriculata Root Against High-Fat-Diet + STZ-Induced Type-2 Diabetes in C57BL/6 Mice. ACS Omega. 2020;6(1):492–504.
- Srinivasan K, Viswanad B, Asrat L, Kaul CL, Ramarao P. Combination of high-fat diet-fed and low-dose streptozotocin-treated rat: a model for type 2 diabetes and pharmacological screening. Pharmacol Res. 2005;52(4):313–320.
- Liu Y, Deng J, Fan D. Ginsenoside Rk3 ameliorates high-fat-diet/streptozocin-induced type 2 diabetes mellitus in mice via the AMPK/Akt signaling pathway. Food Funct. 2019;10(5):2538–2551.
- Hu RY, et al. AFG Ameliorates Diabetic Retinopathy through AMPK-Dependent Autolysosomal Pathway: From Network Pharmacology to In Vivo and In Vitro Validation. J Agric Food Chem. 2026;74(2):2124–2139.
- Reagan-Shaw S, Nihal M, Ahmad N. Dose translation from animal to human studies revisited. FASEB J. 2008;22(3):659–661.
- Zou Q, et al. Oxidative stress in diabetic retinopathy. Clin Chim Acta. 2026;584:120871.
- Clements JN, Mesawich J, Twisdale C. Current and Emerging Pharmacologic Therapies for Diabetic Retinopathy. Pharmacotherapy. 2026;46(3):e70119.
- Rezvani Z, Khani F, Afarid M, Asadian F, Takhshid MA. Clinical values of systemic inflammatory indices in diabetic retinopathy. Clin Exp Optom. 2026;109(3):371–385.
- Zhu Z, et al. Targeting the CMKLR1-Mediated Signaling Rebalances Immunometabolism State in Middle-Age Testicular Macrophages. Adv Sci (Weinh). 2026;13(14):e15166.
- Lin Y, et al. Epithelial chemerin-CMKLR1 signaling restricts microbiota-driven colonic neutrophilia and tumorigenesis by up-regulating lactoperoxidase. Proc Natl Acad Sci U S A. 2022;119(29):e2205574119.
- Puthanmadhom Narayanan S, et al. Epigenetic Alterations Are Associated With Gastric Emptying Disturbances in Diabetes Mellitus. Clin Transl Gastroenterol. 2020;11(3):e00136.
- Wang L, et al. Chemerin/CMKLR1 Axis Promotes the Progression of Proliferative Diabetic Retinopathy. Int J Endocrinol. 2021;2021:4468625.
- Zheng C, et al. α-NETA down-regulates CMKLR1 mRNA expression in ileum and prevents body weight gains collaborating with ERK inhibitor PD98059 in turn to alleviate hepatic steatosis in HFD-induced obese mice but no impact on ileal mucosal integrity and steatohepatitis progression. BMC Endocr Disord. 2023;23(1):9.
- Dranse HJ, et al. The impact of chemerin or chemokine-like receptor 1 loss on the mouse gut microbiome. PeerJ. 2018;6:e5494.
- Flores-Hernández E, et al. Canonical and non-canonical Wnt signaling are simultaneously activated by Wnts in colon cancer cells. Cell Signal. 2020;72:109636.
- Qi Y, et al. Heat-inactivated Bifidobacterium adolescentis ameliorates colon senescence through Paneth-like-cell-mediated stem cell activation. Nat Commun. 2023;14(1):6121.
- Ou W, et al. Cooperation of Wnt/β-catenin and Dll1-mediated Notch pathway in Lgr5-positive intestinal stem cells regulates the mucosal injury and repair in DSS-induced colitis mice model. Gastroenterol Rep (Oxf). 2024;12:goae090.
- Dong Y, et al. Berberine ameliorates DSS-induced intestinal mucosal barrier dysfunction through microbiota-dependence and Wnt/β-catenin pathway. Int J Biol Sci. 2022;18(4):1381–1397.
- Escandon P, et al. The role of peroxisome proliferator-activated receptors in healthy and diseased eyes. Exp Eye Res. 2021;208:108617.
- Blot G, et al. Perilipin 2-positive mononuclear phagocytes accumulate in the diabetic retina and promote PPARγ-dependent vasodegeneration. J Clin Invest. 2023;133(19):e161348.
- Zhou W, et al. TREM2-dependent activation of microglial cell protects photoreceptor cell during retinal degeneration via PPARγ and CD36. Cell Death Dis. 2024;15(8):623.
- Bala Kumar S, et al. Gut microbial metabolites targeting JUN in renal cell carcinoma via IL-17 signaling pathway: network pharmacology approach. Mol Divers. 2026;30(1):613–632.
- Wang L, et al. Gut microbial bile acid metabolite skews macrophage polarization and contributes to high-fat diet-induced colonic inflammation. Gut Microbes. 2020;12(1):1–20.
- Hagan T, et al. Antibiotics-Driven Gut Microbiome Perturbation Alters Immunity to Vaccines in Humans. Cell. 2019;178(6):1313–1328.e13.
- Meng Y, et al. Jinlida ameliorates diabetic kidney disease via gut microbiota-dependent production of pyridoxamine targeting renal AGEs/RAGE and TGF-β pathways. Phytomedicine. 2026;150:157744.
- Zhou H, Zhang L, Ding C, Zhou Y, Li Y. Upregulation of HMOX1 associated with M2 macrophage infiltration and ferroptosis in proliferative diabetic retinopathy. Int Immunopharmacol. 2024;134:112231.
- Mohammad HMF, et al. Neuroprotective effect of levetiracetam in mouse diabetic retinopathy: Effect on glucose transporter-1 and GAP43 expression. Life Sci. 2019;232:116588.
- Peng H, et al. Autophagy and senescence of rat retinal precursor cells under high glucose. Front Endocrinol (Lausanne). 2023;13:1047642.
- Ding Y, Chen L, Xu J, Feng Y, Liu Q. APAF1 Silencing Ameliorates Diabetic Retinopathy by Suppressing Inflammation, Oxidative Stress, and Caspase-3/GSDME-Dependent Pyroptosis. Diabetes Metab Syndr Obes. 2024;17:1635–1649.
- Yang T, et al. Clinical study on the modulating effects of Jiaotaiwan on the modulating effects of microbiota–SCFAs–neurotransmitter/immune axis in patients with depression. Acupunct Herb Med 2025;5(4):456–468.
- Luo XX, et al. Effect of qiming granule on retinal blood circulation of diabetic retinopathy: a multicenter clinical trial. Chin J Integr Med. 2009;15(5):384–388.
- Hu Z, et al. Add-on effect of Qiming granule, a Chinese patent medicine, in treating diabetic macular edema: A systematic review and meta-analysis. Phytother Res. 2021;35(2):587–602.
- Yang M, et al. The Efficacy and Safety of Qiming Granule for Dry Eye Disease: A Systematic Review and Meta-Analysis. Front Pharmacol. 2020;11:580.
- Ma XF, et al. Efficacy and Safety of Qiming Granule for Nerve Injury Associated with Non-proliferative Diabetic Retinopathy: A Multicenter, Randomized, Non-inferiority, Active-Controlled Clinical Trial. Chin J Integr Med. 2026;32(3):195–203.
- Zhou Q, et al. Qiming granules regulate Müller cell pyroptosis and the P2X7R/NLRP3 immune inflammatory pathway in diabetic retinopathy. Chin Med. 2026;21(1):89.
- Zhou L, Qin T, Lv Y, Wu Z. Qiming Granules Ameliorate Diabetic Retinopathy by Regulating the PI3K/Akt Signaling Pathway. J Ocul Pharmacol Ther. 2026;42(3):202–212.
- Li HD, Li MX, Zhang WH, Zhang SW, Gong YB. Effectiveness and safety of traditional Chinese medicine for diabetic retinopathy: A systematic review and network meta-analysis of randomized clinical trials. World J Diabetes. 2023;14(9):1422–1449.
- Chen F, et al. Isorhamnetin promotes functional recovery in rats with spinal cord injury by abating oxidative stress and modulating M2 macrophages/microglia polarization. Eur J Pharmacol. 2021;895:173878.
- Naudhani M, Thakur K, Ni ZJ, Zhang JG, Wei ZJ. Formononetin reshapes the gut microbiota, prevents progression of obesity and improves host metabolism. Food Funct. 2021;12(24):12303–12324.
- Qu Y, et al. Kaempferol Alleviates Murine Experimental Colitis by Restoring Gut Microbiota and Inhibiting the LPS-TLR4-NF-κB Axis. Front Immunol. 2021;12:679897.
- Saikia L, et al. Therapeutic Potential of Quercetin in Diabetic Neuropathy and Retinopathy: Exploring Molecular Mechanisms. Curr Top Med Chem. 2024;24(27):2351–2361.
- Yao H, et al. Kaempferol Protects Blood Vessels From Damage Induced by Oxidative Stress and Inflammation in Association With the Nrf2/HO-1 Signaling Pathway. Front Pharmacol. 2020;11:1118.
- Zhang HX, Li YY, Liu ZJ, Wang JF. Quercetin effectively improves LPS-induced intestinal inflammation, pyroptosis, and disruption of the barrier function through the TLR4/NF-κB/NLRP3 signaling pathway in vivo and in vitro. Food Nutr Res. 2022;66:10.