Este estudo apresenta um fluxo de trabalho reprodutível para a otimização de layouts de exposições imersivas, combinando recozimento simulado adaptativo, seleção de propostas dependente de etapas e controle de reaquecimento. O layout selecionado foi implementado em um ambiente de exposição em realidade virtual e avaliado utilizando métricas de custo espacial, registros comportamentais dos participantes e avaliações pós-experiência.
É necessária uma assinatura do JoVE para visualizar este conteúdo. Faça login ou inicie seu teste gratuito.
Artigo de investigação
Otimização do Design de Espaços de Exposição Imersiva Utilizando Simulated Annealing Adaptativo com Reaquecimento e Avaliação por Realidade Virtual
Neste artigo
Resumo
Resumo
Espaços expositivos imersivos exigem layouts que apoiem uma circulação eficiente, orientação clara, interação equilibrada e conforto ambiental. No entanto, os layouts expositivos são frequentemente desenvolvidos por meio de decisões manuais de design, o que dificulta a avaliação simultânea do comprimento das rotas, acessibilidade visual, risco de aglomeração, conforto ambiental e distribuição dos nós de interação. Este estudo desenvolveu e avaliou um fluxo de trabalho de otimização de design espacial baseado em recozimento simulado adaptativo com seleção de propostas dependente de etapas e controle de reaquecimento. Uma sala de exposição imersiva de 36 m x 24 m foi construída com seis zonas temáticas, corredores de transição, uma área de descanso e múltiplos nós de interação. Três condições de layout foram comparadas: layout manual, layout de recozimento simulado padrão e layout de recozimento simulado adaptativo com reaquecimento. O modelo de otimização minimizou uma função de custo espacial ponderada que incorporava distância percorrida a pé, acessibilidade visual, aglomeração, conforto ambiental e equilíbrio de interação. Os layouts selecionados foram implementados em cenas expositivas de realidade virtual e avaliados por meio de registros comportamentais dos participantes e avaliações pós-experiência. O algoritmo adaptativo produziu um custo espacial final menor, uma porcentagem de melhoria mais alta e menos iterações até a melhor solução do que o recozimento simulado padrão, com um aumento moderado no tempo de computação. Os participantes designados ao layout adaptativo relataram maior satisfação, sensação mais forte de presença, orientação mais clara, menor percepção de aglomeração e menor carga cognitiva, além de completarem a rota com menor distância percorrida, menos hesitações, tempo de permanência mais longo e cobertura mais ampla do mapa de calor. Esses resultados apoiam o fluxo de trabalho como uma abordagem de auxílio à decisão para o cenário expositivo testado; eles não estabelecem um layout expositivo universalmente ótimo nem superioridade sobre todas as metaheurísticas alternativas.
Introdução
Espaços expositivos imersivos combinam cada vez mais design espacial, mídia digital, telas interativas e tecnologias de realidade virtual para criar ambientes nos quais os visitantes não apenas observam conteúdos, mas se movem por eles, reagem a eles e interpretam a exposição como uma experiência espacial. Nessas configurações, a qualidade da experiência depende não apenas da riqueza do conteúdo visual ou interativo, mas também da continuidade do percurso, visibilidade, aglomeração, conforto ambiental e distribuição de oportunidades de interação. Assim, o design de espaços expositivos envolve um problema com múltiplas variáveis: um layout deve orientar os visitantes de forma eficiente, ao mesmo tempo que preserva a sequência narrativa, a abertura perceptiva e as oportunidades de engajamento. Estudos sobre o comportamento em museus e exposições há muito demonstram que a experiência do visitante é moldada pela organização espacial, pela estrutura de circulação e pelo acesso interpretativo, e não apenas pelo conteúdo das exposições1.
A teoria da configuração espacial fornece uma base útil para tratar o layout de exposições como um problema de design passível de análise. Sob essa perspectiva, o espaço não é um recipiente passivo para objetos; ele organiza o movimento, o encontro, a visibilidade e a escolha. A configuração arquitetônica pode influenciar a forma como as pessoas se deslocam por um ambiente e com que facilidade compreendem as relações entre os espaços2. A análise espacial baseada na visibilidade reforça ainda mais essa visão, mostrando que campos visuais e relações de linha de visão podem ser modelados como características mensuráveis da cognição espacial e da navegação3. Essas ideias são particularmente relevantes para exposições imersivas, pois os visitantes precisam integrar continuamente informações visuais, decisões de trajeto, pistas de interação e estímulos ambientais enquanto se movem pela exposição.
Ao mesmo tempo, as tecnologias imersivas ampliaram as formas pelas quais ambientes de exposição podem ser projetados e testados antes da implementação física. Interfaces virtuais e imersivas permitem que pesquisadores e designers examinem como os usuários percebem e se comportam sob condições espaciais controladas, possibilitando comparações entre diferentes layouts enquanto mantêm constantes o conteúdo e as configurações ambientais4. Revisões sobre aplicações de realidade virtual imersiva mostram que a estrutura espacial, o design da interação e a clareza da tarefa são determinantes importantes do engajamento do usuário e da qualidade da aprendizagem5. Evidências de meta-análises também sugerem que o nível e o tipo de imersão podem influenciar o senso de presença, mas a imersão por si só não garante melhores resultados se o ambiente for mal organizado ou difícil de navegar6.
A experiência do usuário em uma exposição imersiva está estreitamente relacionada à presença, à carga cognitiva e ao conforto físico. A presença reflete o grau em que os usuários se sentem localizados dentro de um ambiente mediado, tornando-se um resultado fundamental em ambientes virtuais e imersivos7. No entanto, ambientes imersivos também podem gerar sobrecarga cognitiva quando a navegação, a interação ou as informações sensoriais não são bem coordenadas8. Por esse motivo, a otimização do espaço expositivo não deve apenas aumentar a densidade de interação ou a estimulação visual. Deve favorecer uma experiência espacial coerente, reduzir decisões desnecessárias de trajeto e minimizar a fadiga evitável. A cinetose induzida por simulador também deve ser monitorada, pois o desconforto pode afetar tanto a segurança da exposição em realidade virtual quanto a interpretação dos resultados da experiência do usuário9.
Apesar desses requisitos, muitos projetos de exposições ainda são desenvolvidos com base na experiência dos projetistas, ajustes manuais iterativos ou observação pós-hoc dos visitantes. Essas abordagens continuam sendo valiosas, mas dificultam a avaliação simultânea de múltiplas restrições de layout. O projeto espacial para exposições imersivas pode ser formulado como um problema de otimização com restrições que considera conjuntamente o comprimento do percurso, visibilidade, aglomeração, conforto e distribuição de interações. A têmpera simulada é adequada para esse tipo de problema, pois pode explorar espaços de solução grandes e irregulares, permitindo a aceitação controlada de soluções intermediárias que não representam melhorias, ajudando assim a escapar de ótimos locais10. Sua lógica de aceitação segue a regra de Metropolis11, enquanto o quadro mais geral de Metropolis-Hastings introduz uma razão entre densidades de proposta direta e reversa quando o núcleo de proposta é assimétrico12. Na implementação atual, os quatro núcleos de proposta condicionais são simétricos; portanto, a derivação formal mostra que a razão de Hastings é igual a um para movimentos viáveis reversíveis. O método é, consequentemente, descrito como têmpera simulada adaptativa com aceitação de Metropolis e reaquecimento, e não como um amostrador distinto de Metropolis-Hastings.
Variantes de recozimento simulado adaptativo há muito utilizam seleção não uniforme de vizinhança, modificação do cronograma de resfriamento, reaquecimento, estratégias de reinício e componentes híbridos de busca13,14. A implementação atual deve, portanto, ser entendida como uma configuração específica para uma aplicação, e não como um novo primitivo meta-heurístico. Sua contribuição é o acoplamento explícito de um cronograma de propostas com quatro movimentos dependente de estágio e o reaquecimento com restrições de viabilidade específicas para cada exposição, uma função de custo espacial transparente com múltiplos componentes e validação em realidade virtual em nível de participante15. Essa delimitação mais restrita distingue diretamente o fluxo de trabalho atual de afirmações sobre um princípio de otimização fundamentalmente novo. Esperava-se que a seleção de propostas dependente do estágio deslocasse a busca de uma exploração mais ampla de sequências/rotas para um refinamento espacial local, enquanto o reaquecimento restaurava a mobilidade da busca após estagnação. Esperava-se que esse equilíbrio entre exploração e exploração reduzisse o aprisionamento prematuro em mínimos locais e aumentasse a probabilidade de alcançar uma disposição viável de menor custo dentro do mesmo orçamento nominal de iterações.
Este estudo propõe um fluxo de trabalho reprodutível que integra recozimento simulado adaptativo, seleção de propostas dependente de etapa, controle de reaquecimento, um modelo espacial de custo multifatorial e avaliação em realidade virtual em nível participante. A contribuição metodológica é orientada à aplicação e focada na reprodutibilidade, em vez de constituir uma alegação de um princípio de otimização fundamentalmente novo16. O método compara um layout manual, um layout de recozimento simulado padrão e um layout de recozimento simulado adaptativo com reaquecimento em um ambiente controlado de exposição em realidade virtual. O estudo analisa tanto os resultados algorítmicos quanto os resultados em nível participante, incluindo custo espacial final, porcentagem de melhoria, presença, clareza na orientação espacial, satisfação, carga cognitiva, distância percorrida, contagem de hesitações, tempo de permanência e cobertura do mapa de calor. A hipótese principal era que o método adaptativo alcançaria um custo espacial final menor do que o recozimento simulado padrão; em nível participante, esperava-se que o layout correspondente melhorasse os resultados de satisfação geral e eficiência de rota em comparação com os layouts manual e de recozimento simulado padrão. Essa abordagem segue a lógica mais ampla dos métodos de projeto meta-heurísticos, nos quais a busca computacional apoia, em vez de substituir, o julgamento humano no projeto17.
Acesso restrito. Inicie sessão ou comece um teste para visualizar este conteúdo.
Protocolo
The study protocol was reviewed by Henan Agricultural University and was determined to be exempt from formal ethics review on December 20, 2025. No separate ethics approval or exemption reference number was issued by the reviewing body. Written informed consent was obtained from all participants before enrollment.
Participant preparation
Adult participants aged 18–60 years with normal or corrected-to-normal vision were recruited. Participants who reported severe vestibular disorders, uncontrolled epilepsy, severe visual impairment, recent major surgery, or previous serious discomfort during virtual-reality exposure were excluded. Each participant completed a screening form before the experiment. Age group, gender, education level, prior virtual-reality experience, and prior museum or exhibition-visiting frequency were recorded as control variables.
Participants were assigned to one of three layout conditions using a computer-generated randomization list: manual layout, standard simulated annealing layout, or adaptive simulated annealing with reheating layout. A between-subject design was used to avoid learning effects across layouts. The allocation ratio was set to 1:1:1, with 60 participants assigned to each condition and 180 participants in total. Age group, gender, education level, previous virtual-reality experience, and museum/exhibition-visiting frequency were recorded before allocation for descriptive assessment of participant characteristics; these variables were not used as post-randomization exclusion criteria.
Exhibition-space model preparation
A rectangular immersive exhibition hall measuring 36 m x 24 m with a ceiling height of 4.5 m was constructed. The total usable floor area was set to 864 m2. One entrance and one exit were placed on opposite short sides of the hall. Both the entrance and exit widths were set to 3.0 m and were kept fixed across all layout conditions.
The exhibition hall was divided into six thematic exhibition zones, two transition corridors, one rest area, and one main visitor route. The allowable area for each thematic zone was set to 80–130 m2, and the rest-area allocation was set to 40 m2. The allowable main-pathway width was set to 1.8–3.5 m. Eight to twelve interaction nodes were placed in each layout. Each interaction node was defined as a point where participants could stop, activate digital content, view an exhibit, or change direction.
The floor plan was discretized into 0.5 m x 0.5 m grid cells. The grid was used for visibility analysis, route-continuity checking, heatmap coverage calculation, and local density estimation. Each thematic zone was represented by its center coordinate, boundary polygon, area, and route-sequence position. Each interaction node was represented by its coordinate, associated zone, trigger radius, and clearance area.
Spatial configuration was treated as the core design variable because exhibition layout, visibility, and route structure affect visitor movement, wayfinding, and spatial cognition18. The complete workflow, from spatial model construction to layout optimization, virtual-scene implementation, participant testing, and statistical analysis, is shown in Figure 1.
Layout parameters and feasibility constraints
The same feasibility constraints were applied to all layout conditions. First, all thematic zones were required to remain inside the 36 m x 24 m boundary. Second, thematic zones were not allowed to overlap. Third, the main visitor route was required to connect the entrance, six thematic zones, a rest area, and the exit without interruption. Fourth, interaction nodes were not allowed to block the main path. Fifth, each interaction node was required to retain a clearance radius of at least 1.2 m. Sixth, the predicted local density on the main route was required to be no more than 1.50 persons/m2. Seventh, the final route was required to contain no dead ends or disconnected subpaths.
The same scene scale, route rules, environmental targets, and interaction settings were used across the three layout conditions. Before the optimization algorithms were run, the hall dimensions, functional-zone parameters, pathway-width range, interaction-node settings, feasibility thresholds, virtual-reality settings, objective-function weights, algorithm parameters, and outcome definitions were recorded. These parameters defined the reproducible boundary of the protocol and are summarized in Table 1.
Spatial-cost function
Each candidate layout was evaluated using the weighted spatial-cost function:

where F(x) is the total spatial cost of layout x. Cdistance(x) is the walking-distance cost, Cvisibility(x) is the visual-accessibility cost, Ccrowding(x) is the crowding cost, Ccomfort(x) is the environmental-comfort penalty, and Cinteraction(x) is the interaction-balance penalty. A lower F(x) indicates a more favorable layout.
The walking-distance cost was calculated as:

where Lx is the total route length of layout x in meters. A reference maximum route length of 120 m was used.
The visual-accessibility cost was calculated as:
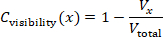
where Vx is the thematic-zone frontage visible from the main route, and Vtotal is the total frontage length of all thematic zones. Line-of-sight rays were emitted every 0.5 m along the visitor route. Exhibition partitions, walls, and zone boundaries were treated as occluding objects.
The crowding cost was calculated as:
Ccrowding(x) = min(Dmax / 1.50, 1)
where Dmax is the maximum predicted local density in persons/m2. An upper density threshold of 1.50 persons/m2 was used for the main route.
The environmental-comfort penalty was calculated as:

The illuminance penalty was set as:
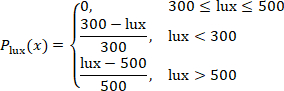
The sound-pressure penalty was set as:
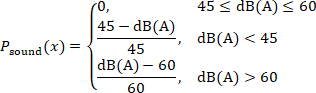
The carbon dioxide penalty was set as:

The temperature penalty was set as:
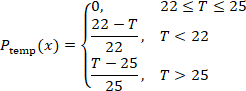
The interaction-balance penalty was calculated as:

where sk is the route distance between two adjacent interaction nodes. A lower value indicates a more even distribution of interaction opportunities along the visitor route.
Environmental comfort is included because lighting, sound, air quality, and temperature influence fatigue, comfort, and willingness to remain in exhibition environments19. The environmental ranges are protocol control targets rather than universal regulatory limits. The 300–500 lx illuminance band is consistent with current Chinese building and museum-lighting guidance; the carbon-dioxide target of <900 ppm is deliberately more conservative than the 1,000 ppm daily-average limit in GB/T 18883-202220,21; the 22–25 °C temperature band is within commonly accepted thermal-comfort conditions for lightly active occupants22; and 45–60 dB(A) is used as a controlled ambient-sound band rather than as a statutory indoor-noise limit23,24.
The objective-function weights were selected as explicit, scenario-specific design priorities rather than as universal coefficients or preference estimates fitted from participant outcomes. Walking distance and crowding each received a weight of 0.25 because route efficiency and congestion control were treated as the two primary operational constraints; visual accessibility received 0.20 because visibility affects orientation and exhibits exposure; environmental comfort and interaction each received 0.15 so that these factors influence the search without dominating circulation-related terms. Because exhibition priorities can differ by context, the protocol tests local weight robustness by perturbing each weight by ±10% individually and proportionally renormalizing the remaining weights so that the total remains 1.00. The resulting coefficients should therefore be interpreted as protocol-specific design settings that can be recalibrated for artistic, historical, scientific, or commercial exhibitions.
Manual layout generation
The manual layout was created as the baseline condition. The six thematic zones were arranged in a conventional narrative sequence from entrance to exit. The rest area was placed near the middle section of the route. The initial main-pathway width was set to 2.2 m. Interaction nodes were placed near the entrance of each thematic zone and at major route-turning points. The manual layout was checked against all feasibility constraints. Zone boundaries were adjusted only when a constraint was violated. After the layout became feasible, total route length, visible frontage ratio, maximum local density, environmental-comfort penalty, interaction-spacing coefficient, and total spatial cost were recorded.
Standard simulated annealing
The feasible manual layout was used as the initial state. The initial temperature was set to 100, the cooling coefficient to 0.95, the maximum number of iterations to 1,500, and the stagnation threshold to 200 iterations. The algorithm was run with 30 independent random seeds. These values were operational protocol settings used to define a matched computational budget; they were not presented as literature-derived universal constants or outcome-tuned optima. T₀ = 100 permitted broad early exploration, α = 0.95 provided gradual cooling, 1,500 iterations provided each run with the same upper search budget, and the 200-iteration stagnation threshold prevented prolonged continuation after no improvement. The same temperature and maximum-iteration settings were used for the adaptive method so that differences were attributable to proposal scheduling and reheating rather than to a larger nominal search budget.
At each iteration, one neighboring layout was generated by applying one move: moving one thematic zone by 0.5–2.0 m, swapping the sequence positions of two thematic zones, adjusting one pathway segment by 0.1–0.3 m, or moving one interaction node by 0.5–1.5 m. A proposed layout was rejected immediately if it violated any feasibility constraint.
If the proposed layout was feasible and had a lower spatial cost, it was accepted. If it had a higher spatial cost, it was accepted according to the probability equation:
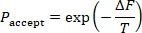
where ΔF is the increase in spatial cost, and T is the current temperature. The temperature after each iteration was updated using:
Tnew = 0.95Told
Each run was stopped when the maximum iteration count was reached or when the best spatial cost did not improve for 200 consecutive iterations. Simulated annealing was considered suitable for this task because exhibition layout optimization is a combinatorial spatial problem that cannot be solved efficiently by exhaustive search.
Standard simulated annealing was used as the primary numerical algorithmic benchmark because it shared the same layout encoding, feasibility rules, objective function, initialization, temperature schedule, and computational budget as the adaptive condition. Standard simulated annealing was the sole numerical metaheuristic comparator in this study and therefore functioned as a matched ablation-like baseline for the added proposal scheduling and reheating at the workflow level. Genetic algorithms, particle swarm optimization, ant colony optimization, and learning-based optimizers were not part of the experiment; accordingly, performance claims were restricted to the matched standard-SA baseline. For each run, the random seed, initial spatial cost, final spatial cost, improvement percentage, number of iterations to the best solution, runtime, acceptance rate, and feasibility status were stored. Improvement percentage was calculated using the equation:

Adaptive simulated annealing with reheating
The same initial layout, feasibility constraints, initial temperature, cooling coefficient, maximum iteration count, and 30 random seeds as the standard simulated annealing condition were used. The adaptive algorithm differed only in its stage-dependent move-class probabilities and reheating rule, while retaining the standard Metropolis acceptance rule for feasible candidate layouts. Four proposal move classes were defined: local displacement (L), zone-sequence swap (S), pathway-width adjustment (W), and interaction-node relocation (N). During the first 40% of iterations, the move-class probabilities were set to pL = 0.20, pS = 0.35, pW = 0.30, and pN = 0.15. During the final 60%, they were set to pL = 0.35, pS = 0.15, pW = 0.20, and pN = 0.30. This change in move-class frequency shifted the search from broader sequence/pathway exploration toward local spatial refinement and adjustment of interaction nodes.
At iteration t, the full proposal density was expressed as q(x′|x,t) = pm(t)qm(x′|x), where m ∈ {L,S,W,N} represented the selected move class and pm(t) represented its phase-specific probability. For local displacement, one of six thematic zones was selected uniformly, a displacement direction was drawn uniformly on [0,2π), and a displacement magnitude was drawn uniformly on [0.5,2.0] m; therefore, qL was proportional to (1/6)(1/2π)(1/1.5). For a zone-sequence swap, one of the 15 unordered zone pairs was selected uniformly, giving qS = 1/15. For pathway-width adjustment, one of J adjustable pathway segments was selected uniformly, and a signed change was drawn uniformly from [−0.3,−0.1] ∪ [0.1,0.3] m, giving qW = (1/J)(1/0.4). For interaction-node relocation, one of K current interaction nodes was selected uniformly, a direction was drawn uniformly on [0,2π), and a displacement magnitude was drawn uniformly on [0.5,1.5] m, giving qN proportional to (1/K)(1/2π)(1/1.0). Constraint-violating proposals were rejected and contributed a self-transition.

For every reversible feasible move in this implementation, the conditional proposal kernel was symmetric: qm(x′|x) = qm(x|x′). Because the same phase-specific move-class probability pm(t) was applied to the forward and reverse transition at a given iteration, q(x|x′,t)/q(x′|x,t) = 1. The acceptance probability, therefore, is reduced to the standard simulated-annealing Metropolis rule, A(x→x′) = min{1, exp[−(C(x′)−C(x))/T]}. No non-trivial Hastings correction was applied; the method is therefore termed adaptive simulated annealing with reheating rather than a Metropolis-Hastings sampler25.
Reheating was applied when the best spatial cost did not improve for 150 consecutive iterations, thereby intentionally intervening before the 200-iteration stagnation stop used in standard simulated annealing. The current temperature was increased by 10%, and up to 3 reheating events were allowed per run. The same algorithm-performance variables as in the standard simulated annealing condition were stored. The experiment evaluated the combined stage-dependent proposal schedule plus reheating configuration and therefore did not estimate the independent causal contribution of each component. Stepwise pseudocode for the exact proposal, feasibility, Metropolis acceptance, temperature update, reheating, and output storage sequence was provided in Supplementary File 3.
Treheated = 1.10Tcurrent
Final layouts
One final layout was selected for each condition. The feasible manual layout was used for the manual condition. Under the standard simulated annealing conditions, the run with the lowest final spatial cost among the 30 runs was selected. For the adaptive simulated annealing with reheating condition, the feasible run with the lowest final spatial cost among the 30 runs was selected. Before the selected layouts were exported, a final feasibility check confirmed that all zones were inside the boundary, no zones overlapped, the route was continuous, the entrance and exit were unchanged, interaction-node clearance was at least 1.2 m, maximum density remained below 1.50 persons/m2, and all thematic zones were reachable from the main route.
Virtual exhibition scenes
Three virtual exhibition scenes were built in Unity 2022.3.22f1 LTS (Unity Technologies) using XR Interaction Toolkit 2.5.4. The scenes were presented through a Meta Quest 2 head-mounted display (Meta Platforms) using six-degree-of-freedom head and controller tracking. Exhibition content, visual style, object models, signage style, lighting assets, ambient sound, interaction mechanism, and navigation instructions were kept identical across the three scenes. Only spatial arrangement, route sequence, pathway width, and interaction-node placement varied.
The virtual camera height was set to 1.65 m, and the walking speed was set to 1.2 m/s. Teleportation was disabled. The same starting trigger at the entrance and the same completion trigger at the exit were used. The interaction-node trigger radius was set to 1.0 m. Whether each interaction node was visited was recorded.
The same six thematic contents were used in all scenes. Each theme was assigned to its corresponding zone, regardless of layout conditions. Wall height, partition style, media display size, text density, and exhibit object scale were kept constant. Virtual-reality environments were considered appropriate for this protocol because they enabled the examination of spatial presence, route clarity, and visitor experience under controlled layout conditions26.
The hardware, software, environmental-monitoring tools, questionnaire/codebook files, and analysis resources required to reproduce the protocol were listed in the Table of Materials and organized as Supplementary Files 1–3. Research resources with registered Research Resource Identifiers (RRIDs) were listed by RRID in the Table of Materials.
Participant session
One participant was tested at a time. The participant sat for 2 min before the session. The head-mounted display was fitted, and the interpupillary distance was adjusted according to the participant's comfort. A 2 min practice scene that was not part of the exhibition was provided. The practice scene was used only to familiarize the participant with movement and interaction.
Because one participant was tested at a time, crowding in the protocol was represented by model-based density estimates rather than emergent simultaneous group movement. Multi-user co-presence, interpersonal avoidance, and dynamic crowd interactions were therefore not directly simulated and were considered when interpreting crowd-related outcomes.
After practice, the assigned exhibition scene was started. The participant was instructed to enter the exhibition, follow the route naturally, interact with marked nodes, and exit after completing all six thematic zones. Additional route guidance was provided only if the participant could not proceed for more than 30 s. Completion time, dwell time, walking distance, hesitation count, interaction-node visits, and trajectory coordinates were recorded automatically.
The session ended when the participant reached the exit trigger. The head-mounted display was removed, and the participant was allowed to rest for 3 min. The participant completed the post-experience questionnaire immediately after the rest period.
Behavioral, environmental, and questionnaire outcomes
Completion time was defined as the time from entrance-trigger activation to exit-trigger activation. Dwell time was defined as the total time spent inside thematic zones and interaction-node areas. Walking distance was defined as cumulative path length from trajectory coordinates. Hesitation count was defined as the number of pauses longer than 3 s outside interaction-node areas. Heatmap coverage was calculated using:

Average illuminance was recorded using a Testo 540 illuminance meter (Testo SE & Co. KGaA), sound pressure level using a Testo 816-1 Class 2 sound level meter (Testo SE & Co. KGaA), carbon-dioxide concentration using a Testo 535 CO₂ measuring instrument (Testo SE & Co. KGaA), and ambient temperature using a Testo 605i thermohygrometer (Testo SE & Co. KGaA). The same monitoring positions were used across the three scene conditions. Illuminance was recorded in lx, sound pressure level in dB(A), carbon dioxide in ppm, and temperature in °C.
Presence and spatial-presence domains were measured using the 7-point scoring structure specified in the study protocol. These constructs were interpreted with reference to the validated Presence Questionnaire (PQ) framework of Witmer and Singer and the Igroup Presence Questionnaire (IPQ) framework of Schubert et al.27. The study variables were reported as domain-level 7-point scores rather than as standard PQ or IPQ total scores. For simulator sickness, the Simulator Sickness Questionnaire symptom framework was used together with the prespecified 0–30 study summary variable; higher values indicated greater discomfort. This 0–30 study summary was reported separately from the standard weighted SSQ Total Severity score, consistent with the distinction between simulator-sickness measurement conventions and cybersickness reporting28. Interaction quality, wayfinding clarity, visual comfort, acoustic comfort, thermal comfort, perceived crowding, cognitive load, and overall satisfaction were measured using the study-specific, multi-item, 7-point rating scales. Supplementary File 2 documented the construct source, score range, and reporting convention for each domain.
Study outcomes
The primary algorithmic outcome was defined as the final spatial cost. The primary visitor-experience outcome was defined as overall satisfaction. Secondary algorithmic outcomes were defined as the improvement percentage, the number of iterations to the best solution, the runtime, and the acceptance rate. Secondary visitor-experience outcomes were defined as presence, spatial presence, interaction quality, wayfinding clarity, visual comfort, acoustic comfort, thermal comfort, perceived crowding, cognitive load, simulator sickness, completion time, dwell time, walking distance, hesitation count, and heatmap coverage. Completion time and walking distance were used to evaluate route efficiency. Hesitation count and wayfinding clarity were used to evaluate navigation quality. Presence, spatial presence, interaction quality, and dwell time were used to evaluate immersive engagement. Perceived crowding, cognitive load, comfort ratings, and simulator sickness were used to evaluate experiential burden.
Data cleaning and quality control
All participant records were checked before analysis. It was confirmed that each record had a single participant identifier, a single condition label, complete behavioral logs and questionnaire scores, and no duplicate identifiers. Presence, spatial-presence, and study-specific experience ratings were restricted to their defined 1–7 ranges. The simulator-sickness study summary variable was restricted to its prespecified 0–30 range. The questionnaire/codebook file was checked to confirm that it documented the construct source, response range, domain construction, and derived-score definitions used in the analysis.
A participant record was excluded if the session was not completed, completion time was less than 3 min or greater than 25 min, heatmap coverage was less than 10%, the trajectory log was incomplete or technically invalid, walking distance was less than 20 m in conjunction with an incomplete/invalid trajectory record, or the participant requested early termination. No upper walking-distance cutoff was applied; walking distance was retained as a continuous study outcome across its valid observed range. An algorithm run was excluded from layout selection if it violated any feasibility constraint. Random seeds, layout files, algorithm outputs, questionnaire/codebook files, and analysis scripts were preserved for reproducibility. Random-seed preservation was necessary because stochastic optimization outputs could vary with initialization and proposal behavior29.
Algorithm performance
The 30 standard simulated annealing runs and 30 adaptive simulated annealing with reheating runs were analyzed. Initial spatial cost, final spatial cost, improvement percentage, iterations to best solution, runtime, and acceptance rate were summarized as mean ± standard deviation (SD), and 95% confidence intervals were reported for the group means and between-algorithm differences.
Normality was assessed using quantile-quantile (Q-Q) plots and the Shapiro-Wilk test. Homogeneity of variance was assessed using Levene's test. The two algorithmic conditions were compared using independent-samples t tests when assumptions were met. Mann-Whitney U tests were used when assumptions were not met. Two-sided p values, 95% confidence intervals, and effect sizes were reported. Cohen's d was calculated using the equation

where:

Rank-biserial correlation was used for nonparametric comparisons. Sensitivity analysis was conducted by changing each objective-function weight by ±10% individually and proportionally renormalizing the remaining four weights so that the total remained 1.00. The final spatial cost and improvement percentage were recalculated for each alternative weight vector. The algorithmic comparison was considered stable when the adaptive simulated annealing with reheating condition retained a lower final spatial cost across the alternative weight settings.
Participant outcome analysis
Participant outcomes across the three layout conditions were analyzed using IBM SPSS Statistics 27.0 (IBM Corp.). Continuous variables were reported as mean ± SD, and categorical variables were reported as counts and percentages. Normality was assessed using Q-Q plots and the Shapiro-Wilk test. Homogeneity of variance was assessed using Levene's test. One-way analysis of variance (ANOVA) was used for normally distributed outcomes with acceptable homogeneity of variance. Welch's ANOVA was used when the assumption of homogeneity of variance was violated. Kruskal-Wallis tests were used for non-normal outcomes.
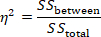
Pairwise comparisons were conducted among the manual layout, standard simulated annealing layout, and adaptive simulated annealing with reheating layout. The three pairwise comparisons within each outcome were adjusted using the Holm method. The 95% confidence intervals were reported together with adjusted p-values. Eta-squared was reported for standard ANOVA, omega-squared for Welch's ANOVA, epsilon-squared for Kruskal-Wallis tests, and standardized mean differences for pairwise comparisons. As a supplementary robustness analysis, pairwise Welch contrasts were calculated from the group mean, SD, and n = 60 per group. Welch degrees of freedom, two-sided p values, Holm-adjusted p values, 95% CIs for mean differences, and Hedges g were calculated. This supplementary analysis used the group-level statistics and was presented in Supplementary Table 1.
The randomized 1:1:1 three-group comparison was treated as the primary analysis. Age group, gender, education level, previous virtual-reality experience, and museum/exhibition-visiting frequency were recorded before allocation to characterize the sample and identify obvious imbalance. The trial was not designed or powered for subgroup interaction tests, and no prespecified moderator model was included; these characteristics were therefore treated as contextual variables rather than demonstrated moderators. Random allocation provided design-based control over baseline characteristics, while the residual influence of prior VR familiarity was explicitly retained as a limitation. Eta-squared was calculated using
Epsilon-squared for Kruskal-Wallis tests was calculated as:
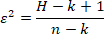
where H is the Kruskal-Wallis test statistic, k is the number of groups, and n is the total sample size.
Overall satisfaction, presence, wayfinding clarity, perceived crowding, cognitive load, completion time, walking distance, hesitation count, and heatmap coverage were prioritized in the interpretation because these variables directly reflected spatial efficiency and immersive visitor experience.
Acesso restrito. Inicie sessão ou comece um teste para visualizar este conteúdo.
Resultados
Fluxo de participantes e integridade dos dados
Um total de 180 participantes concluiu o experimento com a exposição imersiva e foi incluído na análise final. As três condições de layout foram balanceadas, com 60 participantes alocados ao layout manual, 60 ao layout de simulated annealing padrão e 60 ao layout de simulated annealing adaptativo com reaquecimento. Nenhum registro de participante foi excluído após o controle de qualidade dos dados. Todos os registros comportamentais e os escores dos qu...
Acesso restrito. Inicie sessão ou comece um teste para visualizar este conteúdo.
Discussão
O presente estudo avaliou um fluxo de trabalho reprodutível para layout de exposições que combina um modelo de custo espacial ponderado, recozimento simulado adaptativo com reaquecimento e testes com participantes em realidade virtual. No cenário predeterminado de 36 m x 24 m, o layout adaptativo obteve um custo espacial menor do que o recozimento simulado padrão e foi associado a maior satisfação, presença mais intensa, orientação mais clara, rotas mais curtas, menos hesitações e cobertura espacial mais ampla. O termo “...
Acesso restrito. Inicie sessão ou comece um teste para visualizar este conteúdo.
Divulgações
Os autores declaram não haver interesses financeiros concorrentes.
Agradecimentos
Os autores agradecem aos participantes que colaboraram na avaliação da exposição em realidade virtual. Os autores também agradecem à Escola de Arte e Design e ao Colégio de Ciências da Informação e Gestão da Universidade Agrícola de Henan pelo apoio no desenvolvimento e na avaliação do fluxo de trabalho de design de espaços expositivos imersivos. O estudo não recebeu financiamento externo. O trabalho foi realizado com recursos próprios dos autores e com as instalações institucionais de rotina da Universidade Agrícola de Henan.
Acesso restrito. Inicie sessão ou comece um teste para visualizar este conteúdo.
Materiais
| Nome | Empresa | Número de catálogo | Comentários |
|---|---|---|---|
| Software de modelagem 3D | Blender Foundation | N/A | Blender 4.0.2; utilizado para construir a geometria do espaço expositivo, zonas temáticas, divisórias e ativos espaciais. RRID:SCR_008606 |
| Scripts de análise | Scripts de pesquisa personalizados | N/A | Versão 1.0; utilizados para análise estatística, análise de sensibilidade, cálculos de intervalo de confiança e preparação de dados para figuras. |
| Monitor de dióxido de carbono | Testo SE & Co. KGaA | testo 535; 0563 0535 | Medidor digital de CO2; faixa de medição 0–10.000 ppm; utilizado como verificação de controle do protocolo da concentração de dióxido de carbono sob o alvo ambiental predefinido. |
| Estação de trabalho desktop | Dell Technologies | Precision 3660 Tower | 32 GB de RAM; utilizada para renderização de cenas virtuais, simulação de layout, execução de algoritmos e registro de sessões dos participantes. |
| Scripts de geração de figuras | Scripts de pesquisa personalizados | N/A | Versão 1.0; utilizados para gerar gráficos de desempenho do algoritmo, gráficos de resultados dos visitantes e mapas de calor de trajetórias. |
| Motor de jogo / plataforma de realidade virtual | Unity Technologies | N/A | Unity 2022.3.22f1 LTS; utilizado para construir e executar as cenas virtuais da exposição. |
| Display montado na cabeça | Meta Platforms, Inc. | Meta Quest 2 (128 GB) | HMD autônomo de 6 DoF; 1832 × 1920 pixels por olho; taxa de atualização da sessão de 90 Hz; utilizado para exibir a cena imersiva de realidade virtual e rastrear o movimento do participante. |
| Medidor de iluminância | Testo SE & Co. KGaA | testo 540; 0560 0540 | Medidor digital de lux; faixa de medição 0–99.999 lx; utilizado como verificação de controle do protocolo da iluminância sob o alvo ambiental predefinido. |
| NumPy | Desenvolvedores do NumPy | N/A | Versão 1.26.4; utilizado para operações numéricas com arrays e preparação de dados. RRID:SCR_008633 |
| Script de otimização | Script de pesquisa personalizado | N/A | Python 3.11, versão 1.0; implementa o Simulated Annealing Padrão e o Simulated Annealing Adaptativo com Reaquecimento (Adaptive SA-R), incluindo seleção de propostas dependente de estágio, aceitação de Metropolis e reaquecimento. |
| pandas | Equipe de desenvolvimento do pandas | N/A | Versão 2.1.4; utilizado para limpeza de conjuntos de dados, tabulação e preparação de dados prontos para figuras. RRID:SCR_018214 |
| Formulário de triagem de participantes | Formulário de pesquisa personalizado | N/A | Versão 1.0; utilizado para registrar elegibilidade, variáveis demográficas, experiência prévia com realidade virtual e frequência de visitas a museus ou exposições. |
| Questionário de avaliação pós-experiência | Formulário de pesquisa personalizado | N/A | Versão 1.0; escalas de resposta de 7 pontos; utilizado para avaliar a qualidade da interação, clareza da orientação espacial, conforto visual/acústico/térmico, percepção de aglomeração, carga cognitiva e satisfação geral. |
| Formulário de avaliação de presença e presença espacial | Formulário de pesquisa personalizado | N/A | Versão 1.0; pontuações específicas do estudo em domínios de 7 pontos interpretadas com base nos referenciais PQ/IPQ; pontuações totais padrão do PQ ou IPQ não foram relatadas. |
| Linguagem de programação Python | Python Software Foundation | N/A | Versão 3.11; utilizada para execução de algoritmos, cálculo de função de custo, processamento de dados e análise de sensibilidade. RRID:SCR_008394 |
| SciPy | Comunidade SciPy | N/A | Versão 1.11.4; utilizado para testes estatísticos e análises numéricas complementares. RRID:SCR_008058 |
| Formulário de avaliação de enjoo simulador | Formulário de pesquisa personalizado | N/A | Versão 1.0; resumo pré-especificado de 0–30 baseado no quadro de sintomas do SSQ; distinto da pontuação padrão ponderada de gravidade total do SSQ. |
| Medidor de nível de som | Testo SE & Co. KGaA | testo 816-1; 0563 8170 | IEC 61672-1 Classe 2; 30–130 dB; ponderação de frequência A/C; utilizado como verificação de controle do protocolo do nível de pressão sonora sob o alvo ambiental predefinido. |
| Software de planilha | Microsoft | N/A | Microsoft Excel 2021; utilizado para organização de conjuntos de dados, preparação de código-fonte e arquivos complementares em planilhas. RRID:SCR_016137 |
| Software estatístico | IBM | N/A | IBM SPSS Statistics 27.0; utilizado para ANOVA, testes de Welch, verificações de pressupostos e verificação estatística complementar. RRID:SCR_002865 |
| Monitor de temperatura | Testo SE & Co. KGaA | testo 605i; 0560 2605 03 | Termohigrômetro; faixa de temperatura −20 a +60 °C; resolução de 0,1 °C; utilizado como verificação de controle do protocolo da temperatura ambiente sob o alvo ambiental predefinido. |
| Pacote de integração em RV | Unity Technologies | N/A | XR Interaction Toolkit 2.5.4; utilizado para interação em RV, controle de movimento, eventos de gatilho e registro de trajetórias. |
| NOTA: Recursos biológicos não foram utilizados neste estudo. RRIDs são fornecidos para recursos de pesquisa aplicáveis. |
Referências
- Falk JH, Dierking LD. The museum experience revisited. Left Coast Press; Walnut Creek, CA; 2013.
- Hillier B, Hanson J. The social logic of space. Cambridge University Press; Cambridge; 1984.
- Turner A, Doxa M, O'Sullivan D, Penn A. From isovists to visibility graphs: a methodology for the analysis of architectural space. Environ Plan B Plan Des. 2001;28:103-21.
- Kuliga SF, Thrash T, Dalton RC, Hölscher C. Virtual reality as an empirical research tool: exploring user experience in a real building and a corresponding virtual model. Comput Environ Urban Syst. 2015;54:363-75.
- Radianti J, et al. A systematic review of immersive virtual reality applications for higher education: design elements, lessons learned, and research agenda. Comput Educ. 2020;147:103778.
- Cummings JJ, Bailenson JN. How immersive is enough? A meta-analysis of the effect of immersive technology on user presence. Media Psychol. 2016;19:272-309.
- Witmer BG, Singer MJ. Measuring presence in virtual environments: a presence questionnaire. Presence-Teleop Virt. 1998;7:225-40.
- Makransky G, Petersen GB. The Cognitive Affective Model of Immersive Learning: a theoretical research-based model of learning in immersive virtual reality. Educ Psychol Rev. 2021;33:937-58.
- Kennedy RS, Lane NE, Berbaum KS, Lilienthal MG. Simulator Sickness Questionnaire: an enhanced method for quantifying simulator sickness. Int J Aviat Psychol. 1993;3:203-20.
- Kirkpatrick S, Gelatt CD Jr, Vecchi MP. Optimization by simulated annealing. Science. 1983;220:671-80.
- Metropolis N, et al. Equation of state calculations by fast computing machines. J Chem Phys. 1953;21:1087-92.
- Hastings WK. Monte Carlo sampling methods using Markov chains and their applications. Biometrika. 1970;57:97-109.
- Aarts EHL, Korst JHM. Simulated annealing and Boltzmann machines: a stochastic approach to combinatorial optimization and neural computing. John Wiley & Sons; Chichester; 1989.
- Van Laarhoven PJM, Aarts EHL. Simulated annealing: theory and applications. D. Reidel Publishing Company; Dordrecht; 1987.
- Bertsimas D, Tsitsiklis J. Simulated annealing. Stat Sci. 1993;8:10-5.
- Talbi EG. Metaheuristics: from design to implementation. John Wiley & Sons; Hoboken, NJ; 2009.
- Sörensen K. Metaheuristics: the metaphor exposed. Int Trans Oper Res. 2015;22:3-18.
- Hillier B. Space is the machine: a configurational theory of architecture. Cambridge University Press; Cambridge; 1996.
- Lolli F, et al. Post-Occupancy Evaluation's (POE) applications for improving indoor environment quality (IEQ). Toxics. 2022;10:626.
- Ministry of Housing and Urban-Rural Development of the People's Republic of China, State Administration for Market Regulation. GB/T 50034-2024 Standard for lighting design of buildings. Beijing; 2024.
- State Administration for Market Regulation, Standardization Administration of China. GB/T 23863-2024 Specification for lighting design of museum. Beijing; 2024.
- State Administration for Market Regulation, Standardization Administration of China. GB/T 18883-2022 Standards for indoor air quality. Beijing; 2022.
- Ministry of Housing and Urban-Rural Development of the People's Republic of China, General Administration of Quality Supervision, Inspection and Quarantine. GB/T 50785-2012 Evaluation standard for indoor thermal environment in civil buildings. Beijing; 2012.
- Ministry of Environmental Protection of the People's Republic of China, General Administration of Quality Supervision, Inspection and Quarantine. GB 3096-2008 Environmental quality standard for noise. Beijing; 2008.
- Chib S, Greenberg E. Understanding the Metropolis-Hastings algorithm. Am Stat. 1995;49:327-35.
- Slater M, Sanchez-Vives MV. Enhancing our lives with immersive virtual reality. Front Robot AI. 2016;3:74.
- Schubert T, Friedmann F, Regenbrecht H. The experience of presence: factor analytic insights. Presence-Teleop Virt. 2001;10:266-81.
- Stanney KM, Kennedy RS, Drexler JM. Cybersickness is not simulator sickness. Proc Hum Factors Ergon Soc Annu Meet. 1997;41:1138-42.
- Blum C, Roli A. Metaheuristics in combinatorial optimization: overview and conceptual comparison. ACM Comput Surv. 2003;35:268-308.
- Benedikt ML. To take hold of space: isovists and isovist fields. Environ Plan B Plan Des. 1979;6:47-65.
- Penn A. Space syntax and spatial cognition: or why the axial line? Environ Behav. 2003;35:30-65.
- Sherman WR, Craig AB. Understanding virtual reality: interface, application, and design. Morgan Kaufmann; San Francisco, CA; 2003.
- Slater M. Place illusion and plausibility can lead to realistic behaviour in immersive virtual environments. Philos Trans R Soc Lond B Biol Sci. 2009;364:3549-57.
- Sweller J. Cognitive load during problem solving: effects on learning. Cogn Sci. 1988;12:257-85.
- Heydarian A, Carneiro JP, Gerber D, Becerik-Gerber B. Immersive virtual environments versus physical built environments: a benchmarking study for building design and user-built environment explorations. Autom Constr. 2015;54:116-26.
- Rebenitsch L, Owen C. Review on cybersickness in applications and visual displays. Virtual Real. 2016;20:101-25.
- Clay V, König P, König SU. Eye tracking in virtual reality. J Eye Mov Res. 2019;12:3.
- Deb K, Pratap A, Agarwal S, Meyarivan T. A fast and elitist multiobjective genetic algorithm: NSGA-II. IEEE Trans Evol Comput. 2002;6:182-97.
- Kennedy J, Eberhart RC. Particle Swarm Optimization. Proc IEEE Int Conf Neural Netw. 4, 1942-1948.
- Dorigo M, Maniezzo V, Colorni A. Ant system: optimization by a colony of cooperating agents. IEEE Trans Syst Man Cybern B Cybern. 1996;26:29-41.
Acesso restrito. Inicie sessão ou comece um teste para visualizar este conteúdo.