Method Article

Phototaxis Assay of Filamentous Cyanobacteria Using Focused Light Illumination

588 views

September 26th, 2025

In This Article

Abstract

Source: Weber, N. et. al., Natural Transformation, Protein Expression, and Cryoconservation of the Filamentous Cyanobacterium Phormidium lacuna. J. Vis. Exp. (2022)

This video demonstrates a focused LED-based assay for studying phototaxis in filamentous cyanobacteria. The bacteria migrate toward the light source, forming a dense accumulation at the illuminated center, which is visualized and quantified through pixel intensity analysis of the captured image.

Protocol

  1. Assay for phototaxis
    1. For phototaxis experiments, prepare light-emitting diode (LED) holders (here, with a 3D printer) in which the selected 5 mm LEDs are mounted to irradiate an area of 20 mm2 from below to above (Figure 1). If required, use many LED holders in parallel, connecting each LED electrically through a resistor and potentiometer to an adjustable power supply. Measure and adjust the LED intensities, depending on the experiment. Ensure that the whole setting is in a dark room or a closed, dark container.
    2. Place 8 mL of the medium containing Phormidium lacuna into a 6 cm Petri dish. Adjust the LED's light intensity. Close the Petri dish with the lid and place it on an LED holder so that the LED is in the center of the Petri dish.
    3. After the desired duration (typically 2 days), capture an image of the Petri dish with a smartphone camera aimed directly at the position of the light treatment. Use a white LED panel for irradiation of the specimen. Use the manual settings of the camera; avoid reflections of light; always adjust to get the same distance between the camera lens and the specimen. Ensure that the exposure settings give an image suitable for later analyses using ImageJ.
    4. Quantify the diameter of the central circle of filaments using ImageJ software.
      1. Open ImageJ, click on File | Open, select the desired file, and click Enter.
      2. Select the Straight button (with a straight line). Press the left mouse button to draw a line from one end of the Petri dish to the opposite end. Ensure that the line passes through the center of the circle of filaments.
      3. Press Ctrl-K on the keyboard or click Analyze | Plot Profile in the ImageJ menu. Look for an x-y window with pixel intensities plotted versus distance-a 1D profile of the Petri dish. Ensure that the lowest pixel intensity is slightly above 0 and the highest value is below 255.
      4. Estimate an average value for the pixel intensity outside the circle and another average value for the pixel intensity in the circle. At the y-position between these values, estimate the x-values of both sides of the circle by pointing with the mouse at these positions. Note both values and calculate the difference.
      5. Obtain the highest x-value by pointing the mouse at the y-axis on the right. Note that this value e represents the diameter of the Petri dish. If this diameter is 5 cm, calculate the diameter of the central filament circle as d/e × 5 cm.

Access restricted. Please log in or start a trial to view this content.

Results
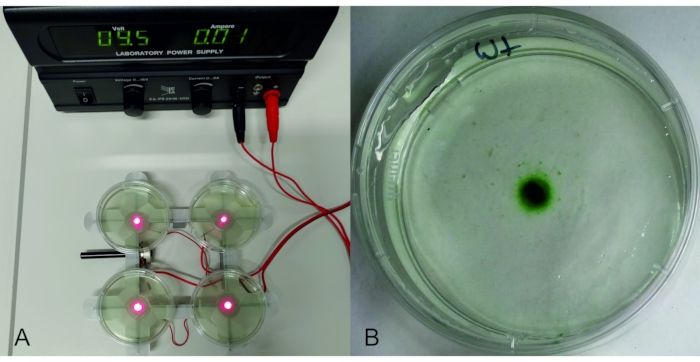
Electrophoresis setup with power supply and petri dish showing diffusion result in microbiology study.

Figure 1: Phototaxis experiment. Left: LED holder with 4 red LEDs, connected to an adjustable power suppl...

Access restricted. Please log in or start a trial to view this content.

Materials

List of materials used in this article
NameCompanyCatalog NumberComments
Petri dishes polystyrole, 60 mm x 15 mmMerckP5481-500EA
Photometer Nanodrop ND-1000Peqlab Biotechnologie
Photometer Uvikon XSGoebel Instrumentelle Analytik GmbH
Pipetman 10-100 µLGilsonSKU: FA10004M
software, URL
ImageJ Software for immage processing (pixel intensities, circle diameter)
Culture media
f/2 -liquid mediumartificial seawater, 0.1 % (v/v) trace element solution, 0.05 % (v/v) vitamin solution, 0.88 mM sodium nitrate, 36 µM monosodium phosphate

Reprints and Permissions

Request permission to reuse the text or figures of this JoVE article

Request Permission

Tags

LED based AssayPixel Intensity AnalysisImageJ SoftwareBacterial Zone AccumulationDark Room ConditionsPetri Dish SetupLight Zone Measurement

Related Articles