This video demonstrates the use of intravital confocal microscopy to visualize macrophage lytic cell death in zebrafish embryos following Mycobacterium marinum infection.
A subscription to JoVE is required to view this content. Sign in or start your free trial.
Method Article
Live Imaging of Macrophage Cell Death During Mycobacterial Infection in Zebrafish Embryos
356 views
⸱
February 2nd, 2026
In This Article
Abstract
Protocol
1. Live Imaging of the Infection
- 1. Fish mounting for live imaging
- Transfer up to 10 tricaine-anesthetized embryos to the middle of a glass bottom 35 mm dish. Discard extra E3 medium.
- Cover the dish with 1% low melting point agarose and orient the zebrafish embryos carefully using a 10 G needle. Incubate the glass bottom dish on ice for 10 s to solidify the agarose.
NOTE: For midbrain injection, embryos should be mounted in the agarose with the head directed upwards (Figure 1A). - Once it has completely solidified, cover the agarose with a layer of egg water (plus 1 x tricaine and PTU (N-phenylthiourea)).
- Three-color high-resolution time-lapse confocal microscopy
NOTE: The following steps are operated on a confocal microscopy equipped with a 63.0x 1.40 oil UV objective lens.- Set the temperature of the environmental chamber to 28.5 °C. Place some wet tissue paper inside the chamber to provide humidity and prevent evaporation of the egg water.
- Place the 35 mm glass bottom dish with the zebrafish in the environmental chamber.
- Open the confocal software and initialize the stage. Switch to the 63.0 x 1.40 oil UV objective and locate the zebrafish using the bright field channel with a differential interference contrast (DIC) filter.
- Open the 405 Diode, Argon (20% power), and DPSS 561 nm laser. Set up the appropriate laser power and spectrum settings.
NOTE: The following are the spectrum settings for Cerulean (excitation = 405 nm; emission = ~456–499 nm), eGFP (excitation = 488 nm; emission = ~500–550 nm), DsRed2 (excitation = 561 nm; emission = ~575–645 nm) - Choose the "XYZ" "Sequential Scan" acquisition mode and set image format to "512 x 512 pixels”.
- Switch to "Live Data Mode". Target the position of the first zebrafish and mark the "Begin" and "End" Z position. Repeat this process for each of the remaining embryos. A "Pause" can be added at the end of the program.
- Define the loop and cycle of the program.
- Save the file.
Access restricted. Please log in or start a trial to view this content.
Results
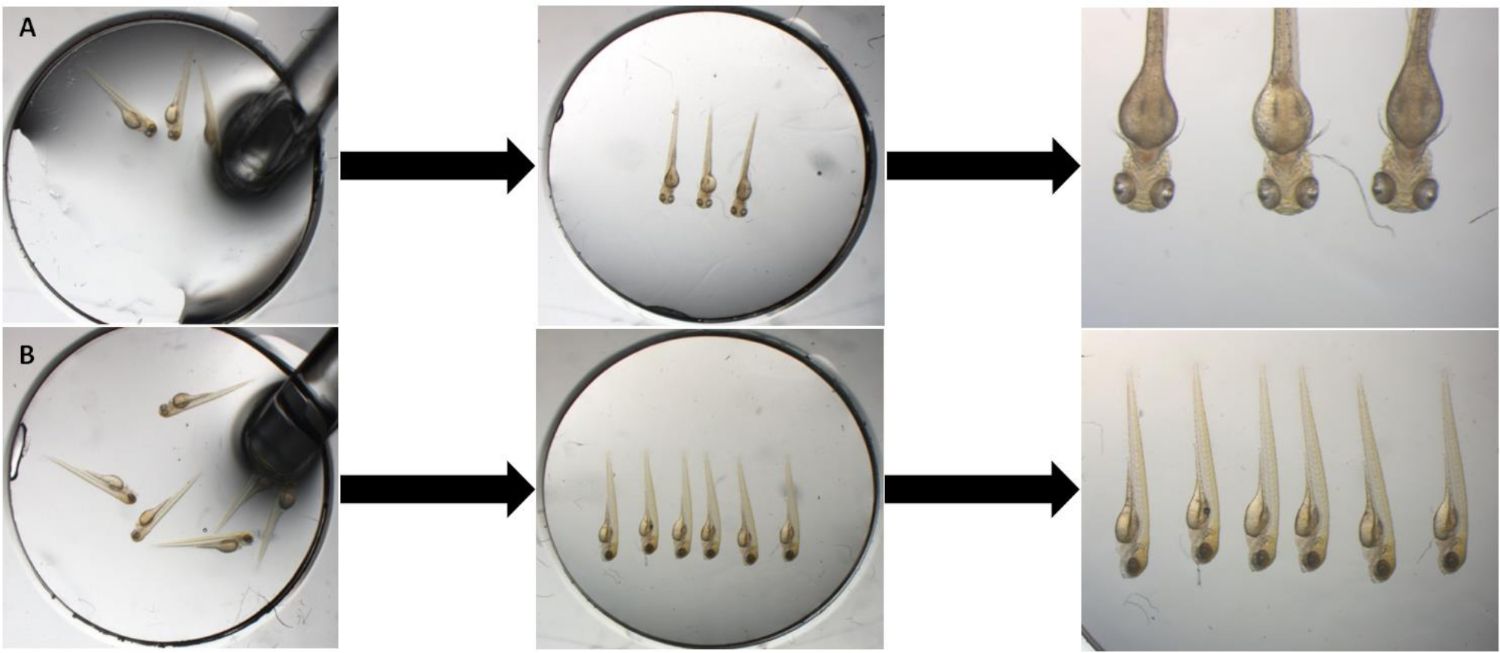
Figure 1: Mounting zebrafish embryos for live imaging. (A) For midbrain infection, zebrafish embryos were mounted with their heads directed downwards. (B) For the trunk region infection, zebrafish emb...
Access restricted. Please log in or start a trial to view this content.
Materials
| Name | Company | Catalog Number | Comments |
|---|---|---|---|
| A glass bottom 35 mm dish | In Vitro Scientific | D35-10-0-N | |
| Agarose | Sangon Biotech | A60015 | |
| Confocal microscope | Leica | TCS SP5 II | |
| Enviromental Chamber | Pecon | Temp control 37-2 digital | |
| Mycobacterium marinum | ATCC BAA-535 | ||
| N-phenylthiourea (PTU) | Sigma | P7629 |
