This video demonstrates a method for analyzing gene expression in plant-extracted pathogenic bacteria at the single-cell level using a fluorescently tagged transcription factor. Confocal imaging reveals heterogeneity in virulence gene expression, highlighting functional diversity within a clonal bacterial population.
A subscription to JoVE is required to view this content. Sign in or start your free trial.
Method Article
Single-Cell Analysis of Gene Expression from Plant-Extracted Pathogens
235 views
⸱
March 31st, 2026
In This Article
Abstract
Protocol
1. Single-cell analysis of the apoplast-extracted bacteria
- Prepare a 1.5% agarose solution in distilled water. Once melted, add enough volume to fill the space between two microscopy slides set side by side and place another slide on top on it (Figure 1). Let them dry for 15 min and carefully remove the slide placed on the top. Using a blade, cut the agarose pad into 5 mm x 5 mm pieces right before use.
- Parallelly, centrifuge 1 mL of the apoplast-extracted bacteria at 12,000 x g for 1 min at room temperature, carefully remove the supernatant using a pipette, and resuspend the pellet into 20 µL of water to concentrate the cells. Place a 2 µL drop of the concentrated cells onto a 0.17 mm coverslip and cover the drop with a 5 mm x 5 mm piece of the agarose pad previously obtained in step 1, as is represented in Figure 1.
- Visualize the bacterial preparation under the confocal microscope (see Table of Materials). To identify green-fluorescent bacteria, use the excitation laser at 488 nm and an emission filter ranging from 500 nm to 550 nm. To identify all the bacteria, use the bright field and merge both fields.
- Process the confocal images using Fiji (see Table of Materials). To do this, use the MicrobeJ plugin to identify the contour of the bacterial cell and measure the fluorescence intensity within.
NOTE: Image acquisition from isolated bacteria (not clustered) is recommended for this analysis.
Access restricted. Please log in or start a trial to view this content.
Results
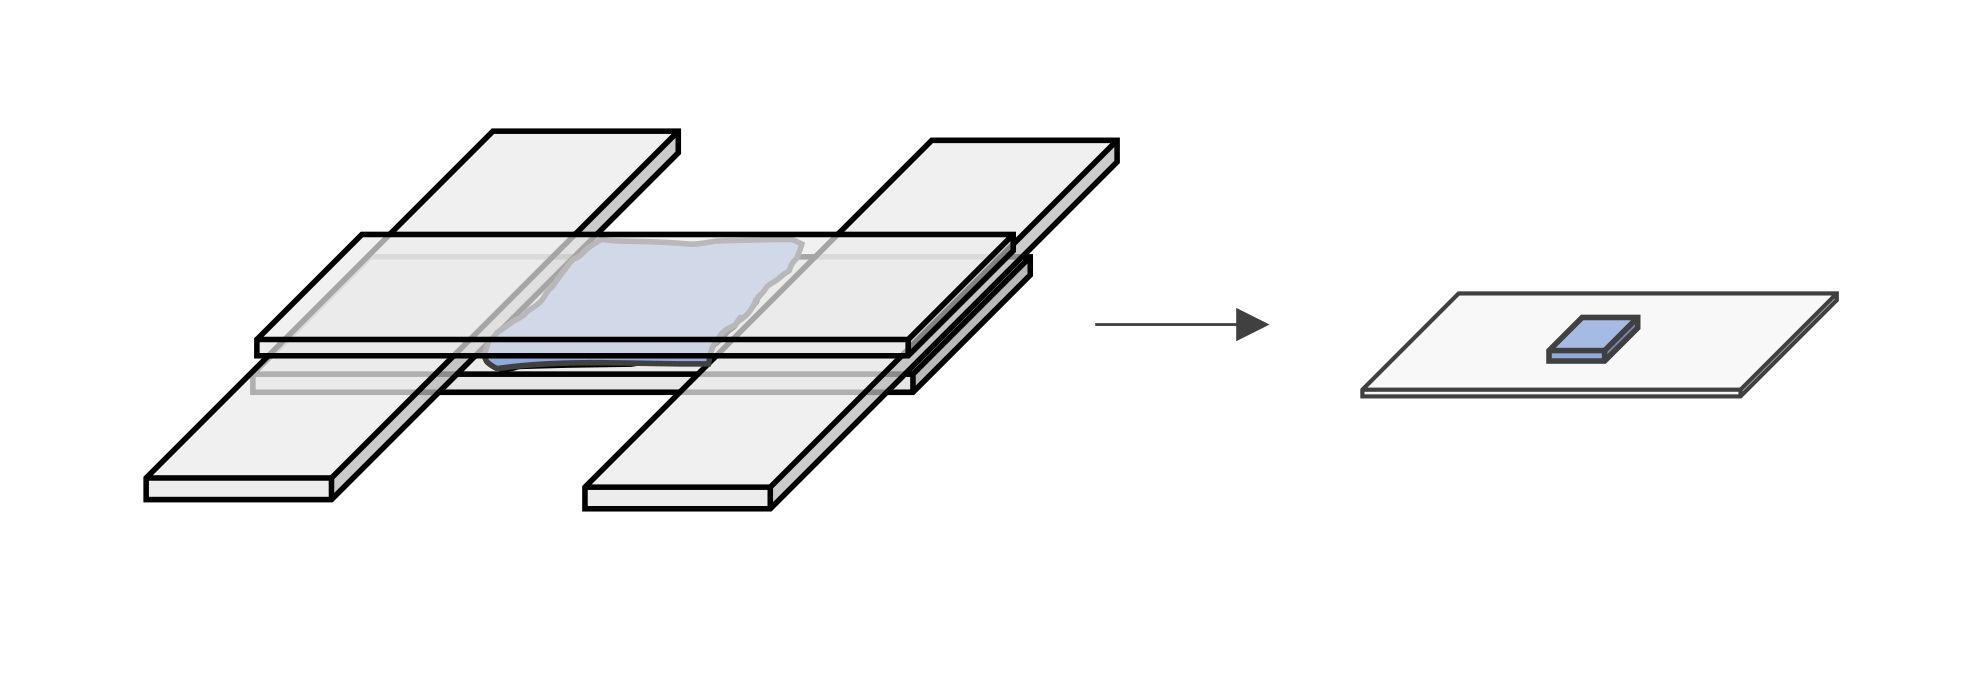
Figure 1: Schematic representation of the setting and preparation of the agar pad.
Access restricted. Please log in or start a trial to view this content.
Materials
| Name | Company | Catalog Number | Comments |
|---|---|---|---|
| 0.17 mm coverslip | No special requirements | ||
| 1.6 x 1.6 mm metal mesh | Buzifu | Fiberglass screen mesh | |
| 50 mL conical tubes | Sarstedt | ||
| Agarose | Merk | ||
| Confocal Microscope Stellaris | Leica Microsystems | ||
| Fiji software |
