Competitive homing experiments allow to directly assessing the migratory properties of two different cell populations in a single mouse. Here we illustrate this procedure by comparing the migration of ex vivo-generated gut-tropic versus non-gut tropic T cells.
A subscription to JoVE is required to view this content. Sign in or start your free trial.
Method Article
Competitive Homing Assays to Study Gut-tropic T Cell Migration
In This Article
Summary
Abstract
In order to exert their function lymphocytes need to leave the blood and migrate into different tissues in the body. Lymphocyte adhesion to endothelial cells and tissue extravasation is a multistep process controlled by different adhesion molecules (homing receptors) expressed on lymphocytes and their respective ligands (addressins) displayed on endothelial cells 1 2. Even though the function of these adhesion receptors can be partially studied ex vivo, the ultimate test for their physiological relevance is to assess their role during in vivo lymphocyte adhesion and migration. Two complementary strategies have been used for this purpose: intravital microscopy (IVM) and homing experiments. Although IVM has been essential to define the precise contribution of specific adhesion receptors during the adhesion cascade in real time and in different tissues, IVM is time consuming and labor intensive, it often requires the development of sophisticated surgical techniques, it needs prior isolation of homogeneous cell populations and it permits the analysis of only one tissue/organ at any given time. By contrast, competitive homing experiments allow the direct and simultaneous comparison in the migration of two (or even more) cell subsets in the same mouse and they also permit the analysis of many tissues and of a high number of cells in the same experiment.
Here we describe the classical competitive homing protocol used to determine the advantage/disadvantage of a given cell type to home to specific tissues as compared to a control cell population. We chose to illustrate the migratory properties of gut-tropic versus non gut-tropic T cells, because the intestinal mucosa is the largest body surface in contact with the external environment and it is also the extra-lymphoid tissue with the best-defined migratory requirements. Moreover, recent work has determined that the vitamin A metabolite all-trans retinoic acid (RA) is the main molecular mechanism responsible for inducing gut-specific adhesion receptors (integrin a4b7and chemokine receptor CCR9) on lymphocytes. Thus, we can readily generate large numbers of gut-tropic and non gut-tropic lymphocytes ex vivoby activating T cells in the presence or absence of RA, respectively, which can be finally used in the competitive homing experiments described here.
Protocol
1. Ex vivo generation of gut-homing and control T cells (see Figure 1)
- Isolate splenocytes by mashing one spleen from wild type mice. Resuspend the cells suspension in PBS and centrifuge for 5' at 400 x g. Remove the supernatant and lyse the red blood cells by resuspending the cell pellet in 4 ml of ACK lysis buffer for 2-3 minutes. After that, add 5 ml of PBS. Centrifuge for 5' at 400 x g and remove the supernatant.
- Resuspend total splenocytes at 1 x 10⁶/mL in IMDM + 10% FBS + 50 mM 2-mercaptoethanol + penicillin/streptomycin (complete IMDM). Separate the cells in two groups, one of which is supplemented with RA (or synthetic RAR-agonists, such as Am80 or Am580) to a final concentration of 100-200 nM 3. T cells activated in the presence of RA or RAR-agonists will upregulate a4b7and CCR9 and will become gut-tropic T cells, whereas T cells activated without RA will become control T cells.
- Add 1.5-2.0 mL of the cell suspension to each well of a 24-well plate previously coated with anti-CD3 (10 mg/ml) and anti-CD28 (10 mg/ml) and incubate at 37°C in 5% CO2 (for coating the plate add 500 ml/well of anti-CD3 plus anti-CD28 in PBS and incubate for 2 hours at 37˚C and then wash twice with 2 ml PBS).
- In order to avoid T cell overstimulation, after 2-3 days transfer the cell suspensions into a new uncoated 24-well plate. Incubate for additional 2-3 days. Depending on cell density and proliferation the media might become acid (yellow), in which case it might be necessary to replace half of the media with fresh complete IMDM. Harvest the cells after 4-5 days (counting from day 0).
- Typical final yields are 1-2 x 10⁶ effector T cells/well. Therefore, a minimum of 9-12 wells of each gut-tropic T cells and control T cells should be plated in order to end up with 10-20 x 106 T cells per condition.
2. Analysis of gut-homing receptors on activated T cells
After 4-5 days of culture we should observe a high expression of gut-homing receptors a4b7and CCR9 on T cells activated in the presence of RA or RAR agonists, whereas control T cells should express very low levels of these receptors 4.
Flow cytometry (FACS) analysis.
- Collect between 0.2-0.5 x10⁶ cells and centrifuge for 5 min at 300 g at 4°C.
- Incubate with anti-CD4-FITC, anti-a4b7-PE (BD Biosciences), anti-CCR9-APC (eBiosciences) and anti-CD8-PercP for 15 min at 4°C in dark.
- After the incubation, centrifuge for 5 min at 300 g 4°C. Wash and resuspend the cells in staining buffer and analyze by FACS.
3. T cell labeling with CFSE and CMTMR cell trackers
- Keep all solutions at 37°C before starting. Wash gut-tropic T cells (a4b7HighCCR9High) and control T cells (a4b7Low/Neg CCR9Low/Neg) twice with PBS to remove the serum. Adjust T cell concentration to 10-15 x 106/mL in PBS.
- Add CFSE (Carboxyfluorescein succinimidyl ester) or CMTMR (chloromethyl-benzoyl-amino-tetramethylrhodamine) fluorophores to either gut-tropic T and control T cells to a final concentration of 5 mM and 10 mM, respectively, gently vortex and incubate for 20 min at 37°C. It is recommended to swap the labelings in the same or in a separate experiment in order to exclude potential intrinsic effects of fluorophores on T cell migration.
- After the incubation, quench with 1 volume of FBS and incubate for 1-5 min at room temperature. Dilute 10 times with warm PBS and centrifuge for 5 min at 300 g. Wash twice with PBS and resuspend in complete IMDM.
- Ideally, 10-20 x 106 cells of each T population should be mixed in a 1:1 ratio and then centrifuged at 300 x g for 5 min. Finally, resuspend the cells in 200-250 mL of warm PBS and inject via the tail vein.
- To calculate the exact input ratio (ideally close to 1) save 5-10 mL of the injected cell suspension and dilute with 300 mL of PBS and analyze by FACS.
4. Analysis of T cell homing
Although mice can be analyzed at various time points (between 1 h and several days post T cell injection), homing of gut-tropic T cells is best documented between 12-24 h post-injection. Longer time points increase the potential effects of other variables affecting the final cell numbers/ratios, such as T cell apoptosis and T cell exit from the tissue. After the mice are euthanized, cell suspensions from several tissues should be isolated without delay in order to decrease cell death, which might affect the final yields and results. Tissues of interest are the small intestine, colon, spleen, lymph nodes, Peyer's patches, liver, lungs and blood. If the injected T cells are bona fide gut-tropic T cells, they should home on average 5-10 times better (or higher) to the small intestine mucosa as compared to control T cells. However, other tissues, such as blood and the spleen, should not exhibit a preferential T cell migration. Isolation of lymphocytes from the intestinal lamina propria and the intraepithelial compartment has been previously described 5.
- FACS staining: Samples are resuspended depending on the numbers of cells collected, at a density no higher than 3.0 x 10⁶ cells/ml. If congenic CD45.1+ or Thy1.1+ mice were used as recipients, the cells are stained with the corresponding congenic marker (e.g., CD45.2 or Thy1.2) combined with some lineage marker (e.g., TCRbchain, CD4, CD8, CD45.1+/CD45.2+).
- During FACS analysis, cells are gated on the congenic marker (e.g. CD45.1) and then on the specific lineage markers (e.g. CD4/CD8) and analyzed for the ratios between CMTMR and CFSE positive cells.
- The data is usually expressed as the Homing Index(HI), which is calculated as the ratio CFSE/CMTMR (or CMTMR/CFSE) in each tissue divided by the corresponding input ratio (see below). If the input ratio is very close to 1, then the tissue ratios will be equivalent to the HI.
HI = CFSEtissue / CMTMRtissue : CFSEinput / CMTMRinput
Blood should also be analyzed in order to determine whether both T cell populations are equally represented in the circulation or if one T cell population is decreased respect to the other (e.g., by preferential trapping in lungs/liver or by decreased viability). This might happen when comparing naïve or resting memory T cells versus recently activated effector T cells, since the latter might be trapped to a greater extent in the lungs. If the HI in blood is significantly different than 1, one can normalize HI in tissues by the HI in blood. Blood can be obtained via cardiac puncture from mice anesthetized (with avertin or isofluorane prior euthanasia) and should be lysed twice with ACK buffer before using it for FACS staining.
Blood normalization = HItissue / HIBlood
5. Representative Results
Recipient mice (Thy1.1+) were euthanized18h post cell injection. Cell suspensions were generated from the spleen, peripheral lymph nodes (PLN), mesenteric lymph nodes (MLN) and small intestine lamina propia (LP). After that the cells were stained for Thy1.2 and CD8 and then analyzed by FACS by gating on viable Thy1.2+CD8+ cells, which were finally analyzed for the ratio between CMTMR+ cells (gut-tropic T cells) and CFSE+ cells (control T cells) divided by the input ratio. The results can be displayed as shown in Figure 2, in which it can be appreciated that gut-tropic and control T cells homed equally to the spleen (HI close to1, indicated with a red line). By contrast, gut-tropic T cells migrated around 10 times more efficiently to the LP as compared to control T cells.

Figure1: Diagram showing the generation and labeling of gut-tropic and non-gut tropic T cells. T cells are isolated from wild type mice and activated with anti-CD3/anti-CD28 and in the presence or absence of 100-200 nM all-trans retinoic acid (RA). After 4-5 days RA-treated T cell acquire the expression of gut homing receptors CCR9 and a4b7. Then, gut-tropic and control T cells are differentially labeled with CFSE or CMTMR, washed, mixed in a 1:1 ratio and injected into a recipient mouse via the tail vein. Some labeled cells are used to determine the CFSE/CMTMR input ratio (should be close to 1).
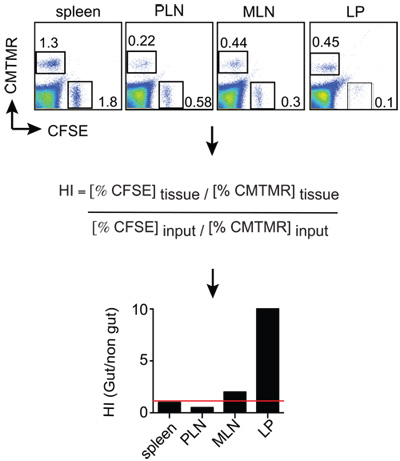
Figure2: Example of homing analysis. Mice analyzed 12-18 h post T cell injection and single cell suspensions are obtained from the organs of interest. The cells are stained with anti-Thy1.2 (congenic marker) plus anti-CD8 and then Thy1.2+CD8+ T cells are analyzed for the ratio of CMTMR+ and CFSE+ cells in each tissue by FACS. The tissue CMTMR/CFSE ratios are then normalized by the Input CMTMR/CFSE ratio to obtain the homing indices (HI). In this example CMTMR+ and CFSE+ cells are gut-tropic and control effector T cells, respectively.
Access restricted. Please log in or start a trial to view this content.
Discussion
Even though homing experiments provide very valuable information about the migration of total cell populations in any given tissue, it should be kept in mind that these assays do not directly analyze endothelial adhesion and therefore do not discriminate in which step(s) of the multistep adhesion cascade (tethering/rolling, activation or sticking) a given homing receptor is acting. The gold standard to define the specific role of homing receptors in the adhesion cascade is intravital microscopy (IVM) in which individual ...
Access restricted. Please log in or start a trial to view this content.
Disclosures
No conflicts of interest declared.
Acknowledgements
EJV is supported by a fellowship from The Crohn s & Colitis Foundation of America (CCFA). JRM is supported by grants from CCFA, Cancer Research Institute (CRI), Howard H. Goodman (MGH), Massachusetts Life Science Center (MLSC) and NIH Director s New Innovator Award.
Access restricted. Please log in or start a trial to view this content.
Materials
| Name | Company | Catalog Number | Comments |
|---|---|---|---|
| Animals: C57BL/6mice are commonly used for T cell isolation. In addition, CD45.1 and Thy1.1 congenic strains are available through Jackson Laboratories (Bar Harbor, ME). | |||
| Culture media: IMDM (Iscove’s Modified Dulbecco’s Medium + L-Glutamine + Hepes) plus 10% heat-inactivated FBS (Fetal Bovine Serum, low endotoxin, Gibco®, Invitrogen, Carlsbad, CA) supplemented with 100 U/ml penicillin, 100 mg/ml streptomycin (HyClone Antibiotics, Waltham, MA), 0.5 mg/ml fungizone/amphotericin B (Gibco), and 50 mM b-mercapt–thanol. | |||
| ACK Red Blood Cell Lysis buffer(RBC, 10 mM KHCO3, 150 mM NH4Cl, 0.1 mM EDTA, pH 8.0), adjust to pH 7.2-7.4 and store at room temperature). | |||
| PBS (Phosphate Buffered Saline, Hyclone, Waltham, MA). | |||
| Flow cytometry (FACS) media(PBS or IMDM + 2% FBS + 5 mM EDTA). When staining using Selectin-Fc chimeras, media with 2 mM Ca++ should be used in all steps (including FACS acquisition). IMDM is recommended in this case. | |||
| T cell labeling and adoptive transfer: CFSE(carboxyfluorescein diacetate, succinimidyl ester), CMTMR ((5-(and-6)-(((4-chloromethyl)benzoyl)amino) tetramethylrhodamine) from Molecular Probes®, Invitrogen, Carlsbad, CA). 1000 x stocks should be made in DMSO (5 mM CFSE, 20 mM CMTMR) and stored at -20°C. | |||
| Polyclonal T cell activation: 24-well or 96-well plates (tissue-culture treated, polystyrene, flat-bottom with lid, BD Falcon, Franklin Lakes, NJ) are incubated for 2 hours at 37°C with 50 ml PBS, respectively, containing anti-CD3 plus anti-CD28 antibodies (10 mg/mL each). Then, culture plates are washed twice with PBS and used immediately for T cell culture. Alternatively, Dynabeads coated with anti-CD3/anti-CD28 (Dynal, Invitrogen, Carlsbad, CA) can be used for T cell activation instead of plate-bound antibodies. | |||
| Flow cytometry (FACS) staining: Polyclonal activation: CD3 (1452C11), CD28 (37.51). Lineage mAb: CD4 (L3T4), CD8a (Ly-2), Thy1.2 (CD90.2/53-1.2), CD45.2 (104). Gut-homing receptors: purified CCR9 (CD199/eBioCW-1.2, eBioscience, San Diego, CA), a4b7(LPAM-1/DATK3), isotype control (IgG2a, k). Skin-homing receptors: P-selectin-Fc (Purified Mouse P-Selectin - IgG Fusion Protein, BD Pharmingen, San Jose, CA), E-selectin-Fc (Recombinant Mouse E-Selectin/Fc Chimera, R&D Systems, Minneapolis, MN) plus corresponding secondary reagent goat F(ab’)2 anti-human IgG R-PE (Invitrogen, Carlsbad, CA). | |||
| All-trans retinoic acid(Sigma, St. Louis, MO)is resuspended in absolute ethanol or DMSO using a yellow bulb or an indirect source of light during the preparation. Store aliquots in glass vials at -80°C and protected from light at all times. Synthetic RAR-agonists: Am80(Wako Chemicals, Richmond, VA). |
References
- Butcher, E. C. Leukocyte-endothelial cell recognition: Three (or more) steps to specificity and diversity. Cell. 67, 1033-1036 (1991).
- Springer, T. A. Traffic signals for lymphocyte recirculation and leukocyte emigration: the multistep paradigm. Cell. 76, 301-314 (1994).
- Iwata, M. Retinoic acid imprints gut-homing specificity on T cells. Immunity. 21, 527-538 (2004).
- Mora, J. R. Reciprocal and dynamic control of CD8 T cell homing by dendritic cells from skin- and gut-associated lymphoid tissues. J Exp Med. 201, 303-316 (2005).
- Mora, J. R. Selective imprinting of gut-homing T cells by Peyer's patch dendritic cells. Nature. 424, 88-93 (2003).
- Mempel, T. R., Scimone, M. L., Mora, J. R., von Andrian, U. H. In vivo imaging of leukocyte trafficking in blood vessels and tissues. Curr Opin Immunol. 16, 406-417 (2004).
Access restricted. Please log in or start a trial to view this content.
Reprints and Permissions
