All procedures involving animal models have been reviewed by the local institutional animal care committee and the JoVE veterinary review board.
1. Preparation
- Lavage fluid
- Prepare a balanced salt solution with 100 µM ethylenediaminetetraacetic acid (EDTA).
NOTE: To measure protein levels in the bronchoalveolar Lavage (BAL) fluid, it is recommended to add protease inhibitors to prevent protease activity in the BAL fluid.
- Catheter
- Make a catheter by inserting a 23 G needle into transparent plastic polyethylene 21 G tubing (inner diameter: 0.58 mm, outer diameter: 0.965 mm, and length: 0.5 cm). Premade catheters can also be used.
- Anesthetics
- Prepare a terminal anesthetic, preferably one that causes respiratory arrest (e.g., a barbiturate like sodium pentobarbital (>100 mg/kg) solution in phosphate-buffered saline (PBS)).
NOTE: It is recommended to use injected anesthesia instead of inhaled anesthesia, as inhaled anesthesia may influence the BAL fluid content. CO2, for example, has an influence on the pH of the blood and consequently on the redistribution of different compounds.
- Ammonium-chloride-potassium (ACK) red blood cell lysis buffer
- Prepare an ACK lysis buffer by dissolving 8.29 g of ammonium-chloride (NH4Cl) and 1 g of Potassium bicarbonate (KHCO3) in 1 L of H2O with 100 µM EDTA; red blood cell lysis buffer can also be purchased from an external source.
2. Performing the Bronchoalveolar Lavage (BAL)
- Introducing the catheter into the trachea
- Euthanize the mouse by intraperitoneal injection of a lethal dose of a short-acting barbiturate anesthetic using a 26 G needle. To confirm proper lethal anesthetization, pinch the rear paw of the mouse with forceps to check the foot reflex.
- Place the animal on its back on a surgical plate and fix the mouse by pinning down the limbs.
- Spray 70% ethanol on the neck to disinfect. Make an incision in the neck skin near the trachea using a scalpel.
- Open the skin to expose the salivary glands. Separate the salivary glands by using pincers to expose the sternohyoid muscle. Incise the muscle around the trachea using pincers to expose the trachea.
- Place a cotton thread under the trachea using pincers.
- Carefully puncture the middle of the exposed trachea between two cartilage rings with a 26 G needle. Take care not to damage the trachea any further.
- Insert the catheter about 0.5 cm into the trachea. Ensure that the catheter is not inserted too far down into the trachea, as this can lead to damage to the lung structure.
- Stabilize the catheter by tying the trachea around the catheter using the cotton thread placed in step 2.1.5. If the catheter is not tied sufficiently, the injected balanced salt solution may flow toward the upper part of the respiratory tract instead of down into the lungs.
- Collect the lavage fluid
- Load a 1 mL syringe with 1 mL of sterile balanced salt solution with 100 µM EDTA.
- Connect the 1 mL syringe to the catheter and gently inject the salt/EDTA solution into the lung.
- Aspirate the solution gently while massaging the thorax of the mouse. If the aspirate fluid is not visible in the syringe, carefully insert the catheter a little further down or up the trachea.
- Remove the syringe from the needle and transfer the recovered lavage fluid into a 15 mL tube placed on ice. Normally, 700 - 900 µL of BAL is recovered from 1 mL of injected solution.
- Repeat steps 2.2.1 - 2.2.4 twice more.
NOTE: If the purpose is to analyze the non-cellular content, it is recommended to concentrate the pooled samples when there are sensitivity issues.
3. Collecting the Cellular and Noncellular Components of the BAL Fluid
- Centrifuge the lavage fluid for 7 min at 400 x g and 4 °C.
- Collect the supernatant and immediately use it for further analysis (e.g., enzyme-linked immunosorbent assay, ELISA) or freeze at -80 °C. Keep the cell pellet to analyze the cellular influx in the lungs.
- Resuspend the cell pellet in 200 µL of ACK lysing buffer.
NOTE: This step ensures the lysis of the erythrocytes while keeping the white blood cells intact.
- Incubate for 2 min at RT.
NOTE: To reduce the variation caused by red cell lysis, this step should not be performed for longer than 2 min.
- Add 1 mL of cold PBS to dilute the ACK lysing buffer.
- Centrifuge for 7 min at 400 x g and 4 °C. Discard the supernatant and re-suspend the cells in an adequate volume of PBS for downstream analysis (see below).
NOTE: The volume of the PBS depends on the downstream study that will be performed.
4. Analysis of the Different Cell Types in the BAL Fluid by Flow Cytometry
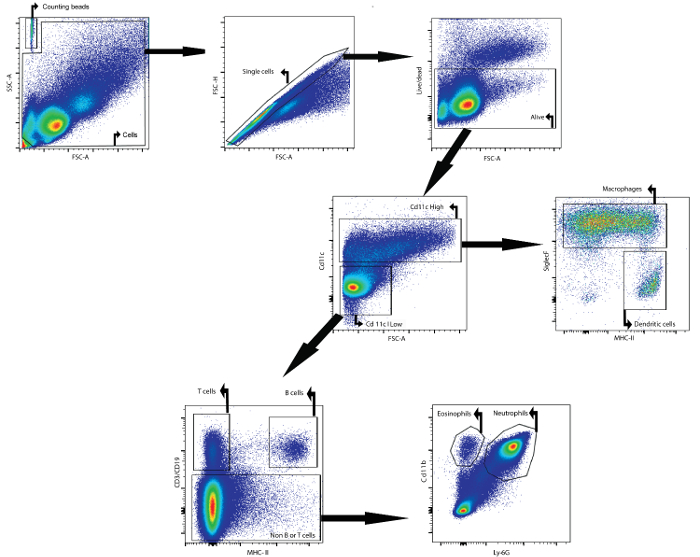
NOTE: One possibility is to analyze the absolute and relative cellular composition of the BAL fluid by performing flow cytometry. The goal of this paper is to elaborate on the technique of BAL. Flow cytometry is a specialized technique on its own. It is recommended to read specialized papers on the flow cytometry technique. Antibodies coupled to a fluorophore that recognize surface antigens (see Table 1) specific to a particular cell type(s) are used. By using a gating strategy, it is possible to identify T cells, macrophages, dendritic cells, B cells, eosinophils, and neutrophils in the cell fraction of the BAL.
- Cell surface staining
NOTE: It is important to include all the critical controls for the flow cytometry analysis. Three sets of tubes are needed (see Table 2): (1) tubes containing the samples; (2) tubes with BAL cells for each antibody-fluorophore to make single stains; this allows for the determination of the voltages for each channel on the flow cytometer; and (3) tubes with beads for each antibody-fluorophore to make single stains; this is to determine the compensation matrix.
- Make a mix of the antibodies and Fc-block (anti-CD16/CD32) in PBS at the appropriate dilutions (see Table 2). It is necessary to determine the optimal working dilution for each antibody prior to the experiment.
- Resuspend the cells in 50 µL of the antibody mix for the sample and add 50 µL of the appropriately diluted antibody to the critical controls.
NOTE: The staining can be performed in a 96-well, u-shaped plate. This makes it possible to easily reduce the stain volume and run significant amounts of samples.
- Incubate for 30 min in the dark at 4 °C.
- Centrifuge for 7 min at 400 x g and 4 °C. Discard the supernatant.
- Re-suspend the cells in PBS to a final volume of 200 µL.
NOTE: This final volume depends on the minimal volume the flow cytometer can access. This can differ slightly between machines. In addition, the read volume depends on the number of cells and/or time the sample will take to run in the flow cytometer.
- Use the samples and controls for flow cytometric analysis.
NOTE: To determine the absolute cell number of the different cell populations, counting beads should be added. Add the same number of beads (± 25,000 beads) to each sample just before measurement. By using forward and side scatter, counting beads can be identified by flow cytometry (see Figure 1). Subsequently, the absolute number of cells in the sample can be calculated by comparing the ratio of bead events to cell events. The following formula can be used:

- Flow cytometric analysis
NOTE: The flow cytometric analysis should be done immediately after the completion of the staining protocol. A flow cytometer with appropriate lasers and filters for signal detection must be used. Table 3 gives an overview of the lasers and filters needed for the study described in this manuscript. For more information on flow cytometric analysis, see Adan et al..
- Set up the primary gates based on the forward and side scatter, excluding debris and doublets (see Figure 1).
- Adjust the voltage and the compensation for spectral overlap with the help of the single-stained cells and beads.
NOTE: These settings are different for each flow cytometer and need to be checked before every experiment. For correct flow analysis, the forward- and side-scatter voltages are critical. A correct forward and side scatter can help in the identification and confirmation of the identity of the analyzed cells. To determine these voltages, an unstained sample should be run first.
- Set up fluorescence gates for the surface antigen (see Figure 1) and analyze the samples.
Table 1: Selection of Immune Cell Surface Antigens. This table provides a list of surface epitopes used to characterize the different cell types. Combinations of several markers will be required to reliably define a specific cell type.
| Antigen | Cell type |
| Cluster of differentiation 3 (CD3) | Expressed on T cells |
| Cluster of differentiation 11c (CD11c) | High expression on most dendritic cells, but also on monocytes, macrophages, neutrophils, and some B cells. |
| Cluster of differentiation 11b (CD11b) | Expressed on the surface of many leukocytes including monocytes, neutrophils, natural killer cells, granulocytes, and macrophages. |
| SiglecF | Alveolar macrophages and eosinophils. |
| MHCII | Normally found only on antigen-presenting cells such as dendritic cells, mononuclear phagocytes, and B-cells. |
| CD19 | B-lymphocyte antigen |
| Ly-6G | A marker for monocytes, granulocytes, and neutrophils |
Table 2. List of Controls to be Included. This table shows all necessary controls for the accurate interpretation of the obtained results.
| Samples | | | | |
| Tube | Antigen-fluorophore to be added to cells | Antibody stock concentration (mg/mL) | Antibody dilution | Total volume (µL) |
| Fixable viability dye | 0.2 | 1/1000 | 50 |
| CD11c | 0.2 | 1/800 | 50 |
| SiglecF | 0.2 | 1/100 | 50 |
| sample X | MHCII | 0.2 | 1/200 | 50 |
| CD3 | 0.2 | 1/200 | 50 |
| CD19 | 0.2 | 1/200 | 50 |
| CD11b | 0.2 | 1/200 | 50 |
| Ly6G | 0.2 | 1/200 | 50 |
| Voltage controls | | | | |
| Tube | Antigen-fluorophore to be added to cells | Antibody stock concentration (mg/mL) | Antibody dilution | Total volume (µL) |
| Unstained cells | / | / | / | 50 |
| Single-stained cells | Fixable viability dye | 0.2 | 1/1000 | 50 |
| Single-stained cells | CD11c | 0.2 | 1/800 | 50 |
| Single-stained cells | SiglecF | 0.2 | 1/100 | 50 |
| Single-stained cells | MHCII | 0.2 | 1/200 | 50 |
| Single-stained cells | CD3 | 0.2 | 1/200 | 50 |
| Single-stained cells | CD19 | 0.2 | 1/200 | 50 |
| Single-stained cells | CD11b | 0.2 | 1/200 | 50 |
| Single-stained cells | Ly6G | 0.2 | 1/200 | 50 |
| Compensation controls | | | | |
| Tube | Antigen-fluorophore to be added to beads | Antibody stock concentration (mg/mL) | Antibody dilution | Total volume (µL) |
| Unstained beads | / | / | / | 200 |
| Single-stained beads | CD11c | 0.2 | 1/2000 | 200 |
| Single-stained beads | SiglecF | 0.2 | 1/2000 | 200 |
| Single-stained beads | MHCII | 0.2 | 1/200 | 200 |
| Single-stained beads | CD3 | 0.2 | 1/2000 | 200 |
| Single-stained beads | CD19 | 0.2 | 1/2000 | 200 |
| Single-stained beads | CD11b | 0.2 | 1/400 | 200 |
| Single-stained beads | Ly6G | 0.2 | 1/200 | 200 |
Table 3: Overview of the Lasers and Filters of the Flow Cytometer used in This Study.
| Laser type | Filter setup | |
| 505 LP | 525/50 |
| Blue (488 nm) | 550 LP | 575/26 |
| 100 mW | 670 LP | 685/35 |
| 750 LP | 780/60 |
| violet 405 nm | | 450/50 |
| 100 mW | | |
| red 633 nm | | 660/20 |
| 70 mW | 750 LP | 780/60 |