A subscription to JoVE is required to view this content. Sign in or start your free trial.

Method Article

Determining the Role of Neutrophil-Like Cells in Lymphoma Cell Sensitivity to a Test Drug

763 views

July 8th, 2025

In This Article

Abstract

Source: Hirz, T., et al. Neutrophil Isolation and Analysis to Determine their Role in Lymphoma Cell Sensitivity to Therapeutic Agents. J. Vis. Exp. (2016).

This video demonstrates an assay investigating the role of neutrophil-like cells in safeguarding lymphoma cells against the cytotoxicity of chemotherapeutic agents. A 3D co-culture, consisting of lymphoma and neutrophil-like cells, is established and exposed to vincristine—a chemotherapy drug. Direct contact with the neutrophil-like cells induces an upregulation of anti-apoptotic proteins in the lymphoma cells, thereby promoting their survival in the presence of vincristine.
Protocol

1. Differentiation of HL60 Cells along the Granulocytic Pathway and Their Coculture with RL Lymphoma B Cells in 3D Model

  1. Differentiation of Human Promyelocytic (HL60) Cells into Neutrophil-like Cells
    1. Adjust HL60 cell number to 3 x 10⁵ cells/ml then add 1 µM retinoic acid (RA) and 1.25% DMSO to induce their differentiation. Seed each 3 x 10⁵ HL60 cells per well in 48-well plate then incubate for 48 hr at 37 °C with 5% CO2.
    2. Later, collect the cells and centrifuge at 300 g for 5 min at RT. Resuspend the cells with complete RPMI medium for counting using cell viability counter.
    3. Then dilute cell suspension in complete RPMI medium to adjust HL60 cell number to 3 x 10⁵ cells/ml and induce again their differentiation by adding 1 µM retinoic acid (RA) and 1.25 % Dimethyl sulfoxide (DMSO). Seed each 3 x 10⁵ HL60 cells per well in 48-well plate and incubate for another 48 hr at 37 °C with 5% CO2.
  2. Analysis of HL60 differentiation (HL60diff)
    1. Collect the cells and centrifuge the tubes at 300 g for 5 min at RT. Resuspend the pellet with complete Roswell Park Memorial Institute (RPMI) medium for counting using cell viability counter.
    2. To analyze the changes in cell-surface markers expression by flow cytometry. Place each 3 x 10⁵ undifferentiated HL60 cells (from cell culture) and 3 x 10⁵ HL60diff cells in 5 ml plastic tubes for Fluorescence-activated cell sorting (FACS) analysis and centrifuge the tubes at 300 g for 5 min at RT.
    3. Resuspend the pellets in 50 µl Phosphate-buffered saline (PBS)-Fetal bovine serum (FBS) (4%). Label the cells with anti-human CD11b conjugated to AF700 or anti-human CD38 conjugated to APC (5 µl/106 cells). Incubate the cells in dark for 30 min at 4 oC.
    4. Wash with 500 µl PBS-FBS (4%) then centrifuge at 300 g for 5 min at RT. Resuspend the pellets in 200 µl PBS-FBS (4%).
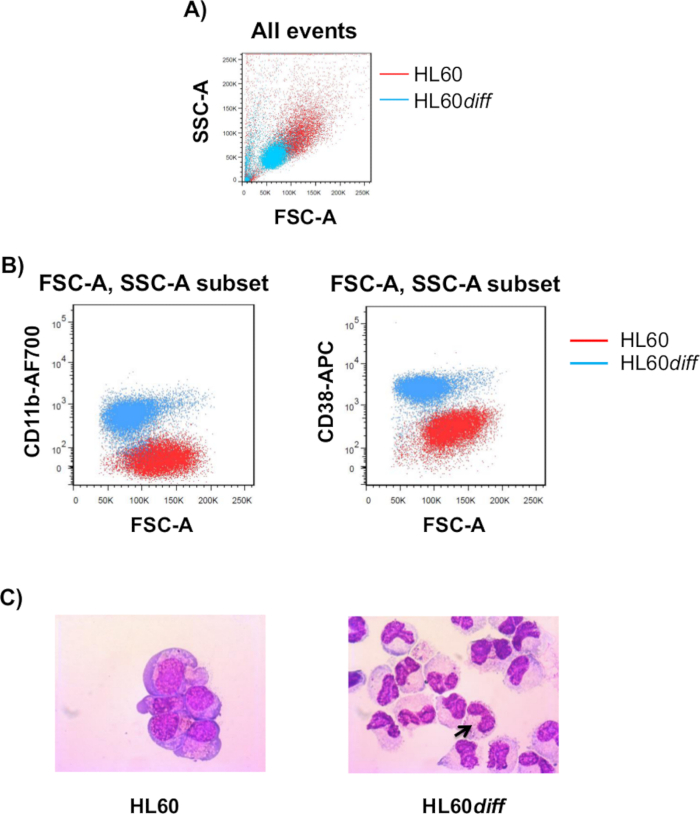
    5. Analyze on flow cytometer using the gating strategy of Figure 1A and the following optical configuration: 488 nm laser: FSC-A (488 nM), SSC-A (488/10BP); 633 nm laser: APC (660/20 BP), Alexa Fluor 700 (730/45 BP).
    6. To test the morphological changes in HL60diff, immobilize the cells onto glass slides for microscopic examination.
      1. To do so, resuspend each 3 x 10⁴ undifferentiated HL60 cells (from cell culture) and 3 x 10⁴ HL60diff in 150 µl complete RPMI medium. Assemble the glass slides, filter cards, and sample chambers in the cytospin centrifuge, ensuring that the centrifuge is balanced.
      2. Place each cell type into sample chamber and cyto-centrifuge at 1,500 rpm for 10 min at RT. Remove the slides, filter cards, and sample chambers from the centrifuge. Disassemble carefully, so as not to damage the cells on the slide. Discard filter cards and sample chambers.
      3. Stain the cells using Giemsa staining kit and keep the slides for 1 hr to dry. Examine the cells by microscope with 100X magnification.
  3. 3-dimensional (3D) Culture
    NOTE: Ensure that the materials used in this experiment are cold and the experiment is taking place on ice.
    1. Resuspend each 5 x 10⁴ RL cells, either alone or mixed with HL60diff at ratio RL:HL60diff 1:10, with 300 µl basement membrane matrix using 1 ml pipette tip cut with a sterile scissor in order to widen the opening to about 2 to 3 mm. Avoid bubbles during this step.
    2. Seed each 300 µl of cell suspension/well in 24-well plate. Avoid bubbles during this step. Incubate the plate for 30 min at 37 °C with 5% CO2 then add 1 ml complete RPMI medium for each well and incubate for 7 days at 37 °C with 5% CO2. Change the medium every two days. Add 10 nM vincristine at day 5.
  4. FACS Analysis
    1. After 7 days of culture, aspirate the medium and wash each well with 1 ml ice-cold PBS twice. Add 3 ml/well of ice-cold PBS-ethylenediaminetetraacetic acid (EDTA) (5 mM). Detach the gel from the bottom of the well by scraping using the bottom of 200 µl pipette tip. Shake the plate gently on ice for 30 min.
    2. Transfer cell suspension into sterile 15 ml tube and shake the tubes gently on ice for another 30 min. Check for the appearance of homogeneous cell suspension. (If it's not the case, then shake the cells for longer time or add more PBS-EDTA).
    3. Centrifuge the tubes at 300 x g for 10 min at RT. Wash the pellets with PBS then centrifuge at 300 x g for 10 min at RT.
    4. Resuspend with PBS-FBS (4%) and label with anti-human CD19 antibody conjugated to PE-Cy7 and anti-human CD38 antibody conjugated to APC (5 µl/106 cells). Incubate in dark for 30 min at 4 oC.
    5. Wash with 500 µl PBS-FBS (4%) then centrifuge tubes at 300 g for 5 min at RT. Resuspend the cells with Annexin V and PI using commercial kit.
    6. Analyze on flow cytometer using the gating strategy of Figure 2A and the following optical configuration: 488 nm laser: FSC-A (488 nM), SSC-A (488/10BP), FITC (530/30 BP), PI (610/20 BP), PE-Cy7 (780/60 BP); 633 nm laser: APC (660/20 BP). Ensure the color compensation.

Access restricted. Please log in or start a trial to view this content.

Results

Flow cytometry graph and cell staining images; HL60 and HL60diff differentiation analysis.
Figure 1. Structural Parameters of Differentiated HL60 Cells. (A) Forward-scatter (FSC) and side-scatter (SSC) plots represent HL60 and differentiated HL60 cells (HL60diff). (B) HL60 and HL60diff cells were labe...

Access restricted. Please log in or start a trial to view this content.

Disclosures

No conflicts of interest declared.

Materials

List of materials used in this article
NameCompanyCatalog NumberComments
RPMI 1640 Gibco Invitrogen21875-034
Fetal bovine serum (FBS)Gibco Invitrogen10270-106
Phosphate-buffered saline (PBS contains calcium and magnesium)Gibco Invitrogen14040-091
Vincristine EG labo
BD Matrigel basement membrane matrix BD Biosciences354234Put at 4 oC overnight before the day of the experiment
Dimethyl sulfoxide (DMSO)Sigma-AldrichD8418
Retinoic acidSigma-AldrichR2625
Bovine serum albumin (BSA)Sigma-AldrichA7906
Ethylenediaminetetraacetic acid (EDTA)Sigma-AldrichE5134
Annexing V-FLOUS staining kitRoche11 988 549 001
Kit RAL 555 Modified Giemsa staining kitCosmos BiomedicalCB361550-0000
LSRII flow cytometryBD Biosciences
CytocentrifugeThermo Scientific
Leica DMR-XA microscopeLeica Microsystems
Cellometer Auto T4 Cell Viability CounterNexcelom Bioscience

Tags

Neutrophil IsolationFlow Cytometry Analysis3D Co culture SetupVincristine TreatmentApoptosis DetectionCytokine SecretionAnti apoptotic ProteinsCell Survival AssayHL60 differentiated Cells