Method Article

An Immunofluorescence Technique for Viral Protein Localization in Infected Cells

July 8th, 2025

In This Article

Abstract

Loading...
$$\rightleftharpoonup{xx}$$ $$\longleftharp{xx}$$, $$\longrightharp{xx}$$,

Source: Samrat, S. K. et al., Temporal Analysis of the Nuclear-to-cytoplasmic Translocation of a Herpes Simplex Virus 1 Protein by Immunofluorescent Confocal Microscopy. J. Vis. Exp. (2018)

This video demonstrates a method for monitoring infected cell protein 0, ICP0 trafficking in herpes simplex virus-1 infection. Post-de novo synthesis, ICP0 translocates to the nucleus, later moving to the cytoplasm during infection progression. Immunofluorescence microscopy reveals and analyzes the protein's subcellular localization, offering insights into its trafficking across infection phases.
Protocol

Loading...
$$\rightleftharpoonup{xx}$$ $$\longleftharp{xx}$$, $$\longrightharp{xx}$$,

1. Cell Seeding and Virus Infection

  1. At 20–24 h before the virus infection, seed 5 x 10⁴ of human embryonic lung (HEL) fibroblast cells or other cells to be examined on a 4-well 11 mm staggered slide in growth medium (Dulbecco's Modified Eagle Medium (DMEM) supplemented with 10% fetal bovine serum (FBS)). Incubate the cells at 37 °C with 5% carbon dioxide (CO2).
    NOTE: Each well should have 70-80% cell confluency at the time of infection.
  2. On the next day, remove the growth medium and infect the cells with viruses in Medium-199 at a range of 4–10 pfu/cell. Incubate virus-infected cells for 1 h at 37 °C. Keep shaking the slide during the incubation period.
  3. After the 1 h incubation, remove Medium-199 and supplement with growth medium.
    NOTE: Drugs that interfere with different infection phases can be added at this step or prior to viral absorption.
  4. Incubate the virus-infected cells at 37 °C with 5% CO2 for various lengths of infection period.

2. Fixation and Permeabilization

  1. At proper infection time, quickly wash the infected cells with phosphate-buffered saline (PBS) 3 times and add 200 μL of 4% paraformaldehyde freshly prepared in PBS. Incubate the cells with paraformaldehyde for 8–10 min at room temperature to fix the cells in each well.
  2. Aspirate paraformaldehyde and wash the wells with 200 μL of PBS for 3 times. Completely aspirate PBS after the 3rd wash.
  3. Add 100 μL of 0.2% non-ionic surfactant to each well to permeabilize the cells for 5–10 min.
  4. Aspirate the non-ionic surfactant and wash the wells with 200 μL of PBS for 3 times.

3. Immunofluorescent Staining

  1. Completely aspirate PBS and add 200 μL of blocking buffer (1% bovine serum albumin (BSA) and 5% horse serum in PBS) in each well and incubate at room temperature for 1 h or at 4 °C overnight.
  2. Add experimentally determined concentration of primary antibody against infected cell protein 0 (rabbit anti-ICP0 polyclonal antibody) in blocking buffer and incubate primary antibody at room temperature for 2 h or at 4 °C overnight.
  3. Wash with blocking buffer 3 times with 10 min incubation. Add Alexa 594-conjugated goat anti-rabbit secondary antibody (1:400 diluted in blocking buffer) and incubate the slides at room temperature for 1 h. Then wash the slides 3 times with blocking buffer at 10 min intervals.
  4. Finally wash the slide once with PBS to remove residual BSA and horse serum.
  5. Add one drop of antifade mounting medium with 4',6-diamidino-2-phenylindole (DAPI) to mount the slide and seal it with coverslip using transparent nail polish.

4. Confocal Imaging

  1. With a confocal microscope, set the wavelength at 590–650 nm for Alexa 594 and 410–520 nm for DAPI. Select image format at 1024 x 1024 and line average of 8 to acquire high resolution images.
  2. Analyze each well on the 4-well slide under a confocal microscope. Acquire representative cell images under the 100X objective, as shown in Figure 1 and Figure 2.
  3. For counting large numbers of cells, take images of consecutive fields under the 40X objective.
    NOTE: It requires 5–10 images to accumulate over 200 infected cells from each time point of each infection.
  4. In each experiment, take pictures with constant confocal parameters for all samples that need to be compared.

5. Analyzing Nuclear vs. Cytoplasmic Distribution

  1. Open project with the confocal application software. Select an image from which cells need to be tabulated for nuclear vs. cytoplasmic distribution of ICP0.
  2. Click the tab "Quantity" from top menu and select "sort ROIs" from tools menu.
  3. Draw a longitudinal line across the cell to be analyzed by selecting "Draw line" from top menu.
    NOTE: Histogram will appear showing the fluorescence intensity along the line for both ICP0 and DAPI. In the histogram, blue line represents DAPI pixels and marks the boundary of the nucleus whereas the red line represents ICP0 pixels.
  4. Based on background staining, set up a constant threshold for ICP0 intensity to analyze ICP0 subcellular distribution in each experiment.
    1. As exemplified in Figure 2, if the red signal on average is below the threshold in the nuclear region but is above the threshold beyond the blue boundary, categorize the red signal as predominantly located in the cytoplasm.
    2. If the red signal is above the threshold throughout the nucleus and beyond the boundary of blue signal, group the red signal as nucleus plus cytoplasmic localization.
    3. If the red signal is above the threshold in the nucleus but on average is below it outside the boundary of blue signal, group the red signal as nuclear localization.
  5. Tabulate more than 200 infected cells from each sample at different infection time and plot in bar graph to illustrate ICP0 movement according to time (Figure 3).

Access restricted. Please log in or start a trial to view this content.

Results

Loading...
$$\rightleftharpoonup{xx}$$ $$\longleftharp{xx}$$, $$\longrightharp{xx}$$,

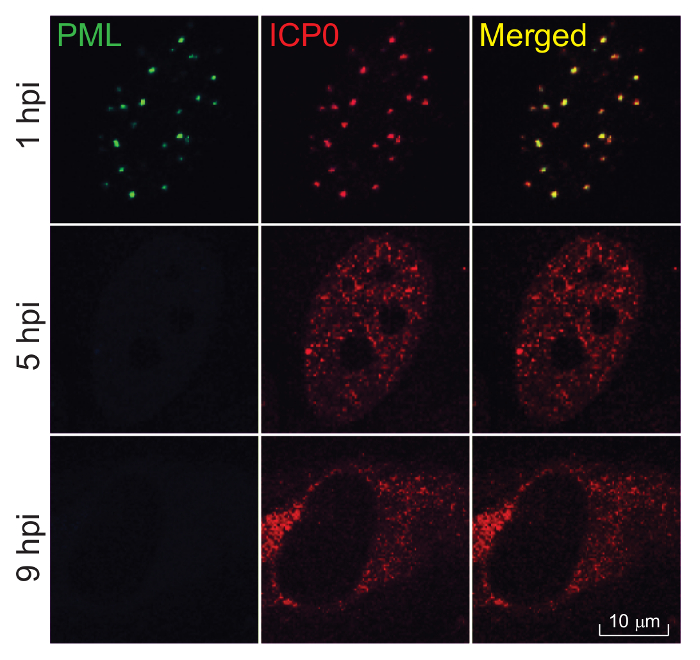
PML and ICP0 colocalization analysis, time-lapse microscopy diagram, viral protein interaction study.
Figure 1: Dynamic trafficking of ICP0 during HSV-1 infection. HEL cells grown on 4-well slides were infected with prototype HSV-1 (strain F) at 10 pfu/cell. At 1, 5, and 9 h post infection (hpi), cells were fixed, permeabilized, and reacted to rabbit a...

Access restricted. Please log in or start a trial to view this content.

Disclosures

Loading...
$$\rightleftharpoonup{xx}$$ $$\longleftharp{xx}$$, $$\longrightharp{xx}$$,
No conflicts of interest declared.

Materials

List of materials used in this article
NameCompanyCatalog NumberComments
Cells and viruses
Human Embryonic Lung fibroblasts (HEL Cells)Dr. Thomas E. Shenk (Princeton University)HEL cells were grown in DMEM supplemented with 10% FBS
HSV-1 viral Stock (Strain F)Dr. Bernard Roizman Lab
Medium
Dulbecco's modified Eagle's medium (DMEM)Invitrogen 11965-092
Fetal Bovine Serum (FBS)SigmaF0926-500ml
Medium-199 (10X)Gibco11825-015
Reagents
4- well 11 mm staggered slideCel-Line/Thermofisher Scientific 30-149H-BLACK
16% Paraformaldehyde solution(w/v) Methanol freeThermo Scientific28908
Triton X-100Fisher reagentsBP151-1C0
Bovine Serum Abumin (BSA)CalbiochemCAS 9048-46-8
Horse SerumSigmaH1270
Phosphate Buffered Saline (PBS) (137 mM NaCl, 2.7 mM KCl, 10 mM Na2HPO4, pH7.4)Dr. Haidong Gu lab
NaCl Fisher BioreagentBP358-212
KH2PO4 Fisher BioreagentBP362-500
KCl Fisher Scientific BP366-500
Na2HPO4 Fisher BioreagentBP332-500
Blocking buffer (PBS with 1% BSA and 5% Horse serum )Dr. Haidong Gu lab
Rabiit Anti-ICP0 antibodyDr. Haidong Gu lab
PML (PG-M3)-Mouse monoclonal IgGsanta Cruz BiotechnologySC-966
Alexa Fluor 594-goat anti-rabbit IgGinvitrogenA11012
Alexa Fluor 488-goat anti-mouse IgGinvitrogenA11001
Vectashield Mouting medium with DAPIVector laboratoriesH-1200
Pasteur pipetteFisher Brand13-678-20D
Nail PolishSally Hansen
Equipment
Confocal MicroscopeLeica SP8
Confocal SoftwareLeica LAS X Application suite
Excel softwareMicrosoft Excel
HERAcell 150i CO2 incubatorThermo ScientificOrder code 51026282

Reprints and Permissions

Request permission to reuse the text or figures of this JoVE article

Request Permission

Tags

Confocal MicroscopyHerpes Simplex Virus 1ICP0 TraffickingNuclear Cytoplasmic TranslocationParaformaldehyde FixationPrimary Antibody StainingSecondary Antibody DetectionFluorescent Nuclear DAPI

Related Articles