Method Article

Visualization of Vesicle Motilities in Neurons Using Fluorescence Imaging

July 8th, 2025

In This Article

Abstract

Loading...
$$\rightleftharpoonup{xx}$$ $$\longleftharp{xx}$$, $$\longrightharp{xx}$$,

Source: Tsuruta, F., et al. Quantification of Endosome and Lysosome Motilities in Cultured Neurons Using Fluorescent Probes. J. Vis. Exp. (2017).

This video demonstrates how neuronal vesicles are labeled with specific fluorescent proteins to visualize their movement. First, a plasmid coding for a fluorescent protein is incubated with a transfection agent and then introduced into a culture of neurons. Subsequently, images of the neurons are acquired and analyzed to track the vesicles' movement.
Protocol

Loading...
$$\rightleftharpoonup{xx}$$ $$\longleftharp{xx}$$, $$\longrightharp{xx}$$,

1. Imaging Vesicle Motility

  1. Prepare the plasmids that will label each type of vesicle. For instance, use EGFP-Rab5 for early endosomes, EGFP-Rab7 for late endosomes, LAMP-EGFP for lysosomes, and EGFP-LC3 for autophagosomes.
    NOTE: These plasmids are available on request from tsuruta.fuminori.fn@u.tsukuba.ac.jp. Typically, 3 -5 days in vitro (Division or DIV) neurons can be transfected with these plasmids using transfection reagents.
  2. Mix 4.0 µg of plasmids with 200 µL of serum-free medium by pipetting. In a separate tube, dilute 8 µL of transfection reagent (see Table of Materials) in 200 µL of serum-free medium. Incubate for 5 minutes at room temperature (RT).
  3. Mix the plasmid solution and transfection regent solution in step 1.2 by pipetting. Incubate for 20 min at RT.
  4. Add serum-free medium and 400 µL of the plasmid solution from step 1.3 to each coated glass-bottom dish containing cortical neurons cerebral cortical culture medium. Incubate the neurons at 37 °C in a 5% CO2 incubator for 30 min. Replace the medium with 2 mL of cerebral cortical culture medium. Incubate the neurons at 37 °C in a 5% CO2 incubator for 1-2 days.
    NOTE: Prepare a cerebral cortical culture medium consisting of neuron basal medium supplemented with 1x B-27 supplements, 2 mM L-glutamine, and 100 U/mL penicillin-streptomycin.
  5. After 1 - 2 days of transfection, select the transfected cells for image acquisition.
    NOTE: Premature neurons less than 7 DIV have a tendency to exhibit dynamic vesicle motility. Select neurons that moderately express the fluorescence probe because clear images cannot be obtained when a highly expressing neuron is selected. Also, select a typical neuronal shape, such as pyramidal neurons, which have long axons and intricate dendrites, for ease of identification of the axon and dendrites (see Figure 1A).
  6. Image acquisition using a time-lapse imaging system: For imaging, use a fluorescence microscope equipped with a Charge-Coupled Device (CCD) camera with 40X Plan Apo 0.95NA or 100X Plan Apo VC NA1.4 objective lenses. Control the temperature at 37 °C using an incubation system. Acquire neuron images at one frame/5 s over a 100 s period controlled by the image acquisition software. Alternatively, acquire images at shorter intervals and for longer time periods, such as at one frame per 2 s over a 300-s period.
    NOTE: A variety of applications are available for taking sequential images, many of which would be suitable for this method. Therefore, no particular application is recommended; instead, each researcher should use whatever application is available.

2. Image Analysis

  1. Open all sequential images in ImageJ software with Manual Tracking.
    NOTE: To date, Manual Tracking has been widely used in tracking experiments. Manual Tracking was developed by Dr. Fabrice Cordelières. Detailed written instructions are available online. For the analysis, the quality of the imaging data is improved with a sufficient number of images. It is recommended to use more than 20 images.
  2. To combine the sequential images, choose→ → . Click .
  3. Choose → ; a tracking window will pop up.
  4. Click on the checkbox of and define the tracking parameters in the parameters section.
    NOTE: Several parameters can be set, including time interval, x/y calibration, z calibration, search square size for centering, dot size, line width, and font size. In this simplified assay, both time interval and x/y calibration were defined. Under other experimental circumstances, it may be necessary to define other parameters as well. The parameters used here are as follows: the is 5 s, and the is either 0.26642 µm for a 40X Plan Apo 0.95NA objective lens or 0.10657 µm for a 100X Plan Apo VC NA1.4 objective lens.
  5. After the parameters are defined, click on to start a new track.
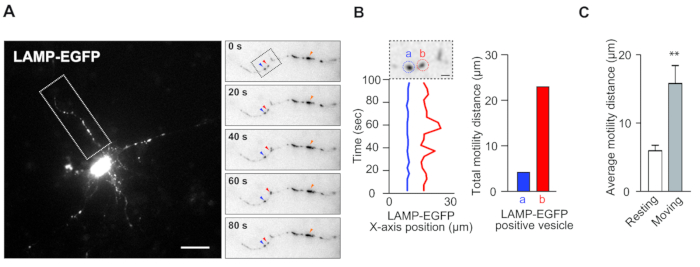
  6. After determining the vesicles of interest (e.g., the vesicles indicated by blue and red arrowheads in Figure 1A (right panel)), click on the center of the signals in the sequential images to record the xy coordinates. The results of the recorded xy coordinates, distance, and velocity show up in a new window.
    NOTE: In the case of lysosomes, large bright fluorescent signals (e.g., Figure 1A (right panel), orange arrowhead) are often observed in neurons. These signals occasionally exhibit either accumulated vesicles or pathological varicosities, so these signals should be avoided for quantifying motility.
  7. Repeat step 2.6 to collect the xy coordinates of vesicles from all sequential images; after the reference point is selected, each image automatically advances to the successive image.
  8. Export these data to a new table (e.g., a spreadsheet). Use appropriate software to create a suitable graph (see Table of Materials).
    NOTE: To analyze the data, select the column, sum up all values of this column, and show a motility distance as a bar graph, such as in Figure 1B. Additionally, repeat this step, calculate the average of the total motility distance, and show as a bar graph, as in Figure 1C. The software to create a bar graph and waveform data is shown in the Table of Materials.

Access restricted. Please log in or start a trial to view this content.

Results

Loading...
$$\rightleftharpoonup{xx}$$ $$\longleftharp{xx}$$, $$\longrightharp{xx}$$,

LAMP-EGFP vesicle motility analysis; fluorescence imaging, graph, bar chart; position vs. time, mobility distance measurement.
Figure 1: Lysosome Motility in Neuronal Dendrites. (A) Mouse cortical neurons (4 DIV) were transfected with LAMP-EGFP plasmid for 2 days. This image shows the motility of LAMP-EGFP-containing vesicles in the dendrites. The inse...

Access restricted. Please log in or start a trial to view this content.

Disclosures

Loading...
$$\rightleftharpoonup{xx}$$ $$\longleftharp{xx}$$, $$\longrightharp{xx}$$,
No conflicts of interest declared.

Materials

List of materials used in this article
NameCompanyCatalog NumberComments
Neurobasal mediumThermo Fisher21103-049
Opti-MEMThermo Fisher31985070Serum free medium
Penicilin StreptmycinThermo Fisher15140122
L-GlutamineThermo Fisher25030081
B-27 SupplementsThermo Fisher17504044
poly-D-lysine hydrobromideSigmaP7280
poly-L-ornithineSigmaP4957
Lipofectamine 2000Thermo Fisher11668027Transfection reagent
Polyethyleneimine "Max"polysciences24765Transfection reagent. As an alternative to Lipofectamine2000, 0.1mg/ml Polyethyleneimine dissolved in sterilized water is available. But it is low efficiency and high toxicity.
BIOREVO BZ-9000KeyenceNA
Incubation system INUG2-K13Tokay HitNA
GraphPad Prism version 6.0GraphPad SoftwareNA
Excel version 15MicrosoftNA
ImageJ verion 1.47NANA

Reprints and Permissions

Request permission to reuse the text or figures of this JoVE article

Request Permission

Tags

Fluorescence ImagingVesicle MotilityNeuronal VesiclesFluorescent ProteinsPlasmid TransfectionImage TrackingManual TrackingImageJ SoftwareFluorescence MicroscopeCCD Camera

Related Articles