A subscription to JoVE is required to view this content. Sign in or start your free trial.

Method Article

Assessing Glucose Uptake in the Motor Neurons of Drosophila Larvae with Upregulated Glucose Metabolism

631 views

July 8th, 2025

In This Article

Abstract

Source: Loganathan, S., et al., Measuring Glucose Uptake in Drosophila Models of TDP-43 Proteinopathy. J. Vis. Exp. (2021).

The video demonstrates a technique for measuring glucose uptake in Drosophila larval motor neurons using a fluorescence resonance energy transfer (FRET)-based intracellular glucose sensor. After dissecting the larvae to expose the ventral nerve cord, the motor neurons are visualized through the fluorescence emitted by the sensor's donor fluorophore. When stimulated with glucose, FRET between the sensor's donor and acceptor fluorophores triggers the emission of fluorescence from the acceptor, enabling the comparison of glucose uptake between control larvae and mutant larvae with upregulated glucose metabolism.
Protocol

1. Drosophila Ventral Nerve Cord (VNC) dissections

  1. Make silicone elastomer dissection dishes.
    1. Pour silicone elastomer components into a 50 mL tube as indicated in the manufacturer's protocol and stir well.
    2. Fill 35 mm tissue culture dishes with approximately 2 mL of the elastomer mixture. Use a syringe to remove any bubbles. Cover the dishes and place them on a level surface in a 60 °C oven overnight to cure.
  2. Dissect Drosophila larvae to expose the VNC while maintaining tissue viability.
    1. Collect a wandering third instar larva, rinse with ddH2O, and then place it in a drop of Hemolymph-like 3 (HL3) buffer (70 mM NaCl, 5 mM KCl, 20 mM MgCl2, 10 mM NaHCO3, 115 mM sucrose, 5 mM trehalose, 5 mM hydroxyethylpiperazine ethane sulfonic acid [HEPES]; pH 7.1) on an elastomer lined dish.
    2. Using a pair of forceps (#5 or 55 forceps) under a dissecting microscope, pin the anterior and posterior ends of the larva dorsal side up, carefully stretching the larva lengthwise with insect pins (Minutein Pins).
    3. Make an incision just above the posterior pin using a pair of angled iris scissors. Make a vertical cut starting from the incision toward the anterior end of the larva.
    4. Add a few drops of HL-3 buffer if needed. Remove the trachea and the rest of the floating organs without disturbing the central nervous system (CNS). Pin the flaps stretching the body wall to expose the CNS while keeping the neuromuscular system (VNCs, axons, and neuromuscular junctions) intact.

2. Image acquisition

  1. Optimize the imaging parameters.
    1. Turn on the microscope and lasers before starting dissections. Images must be acquired using an upright confocal microscope with a 40x water immersion lens. Use a 405 nm laser to excite cyan fluorescent protein (CFP) and acquire the images in both the CFP (465-499 nm) and the FRET (535-695 nm) detection channels.
    2. Optimize acquisition parameters such as scan speed (6), average (2), objective (40x), zoom (1x), pinhole size (1 AU), and spatial resolution (512 x 512). Adjust the gain such that the signal is in the optimal dynamic range. The same parameters must be used for all genotypes.
  2. Image motor neurons within the VNC.
    1. Place the silicone dish with the dissected sample under the lens. Lower the lens so that it comes in contact with trehalose-sucrose HL3 buffer. It is critical to ensure that the lens is completely submerged in the buffer. Add more buffer if required.
    2. Use the CFP and FRET channels to manually select an optical section that consists of at least 6 motor neurons in focus, located along the VNC midline. The motor neurons are identified based on the expression of the glucose sensor and position along the anterior-posterior axis.
    3. Acquire images every 10 s for 10 min. These images represent the baseline.
  3. Stimulate with glucose supplemented HL-3.
    1. Remove the trehalose-sucrose containing HL3-buffer using a Pasteur pipette and replace it with 5 mM glucose supplemented HL-3 (70 mM NaCl, 5 mM KCl, 20 mM MgCl2, 10 mM NaHCO3, 115 mM sucrose, 5 mM glucose, 5 mM HEPES, pH 7.1). This step needs to be performed with great care, to avoid the movement of the VNC as much as possible.
    2. Acquire images every 10 s for another 10 min. These images represent the stimulation phase.
  4. Save the images as .czi files or any file type supported by the imaging software with a file name including date, genetic background, experimental condition (baseline or stimulation), and channels used.
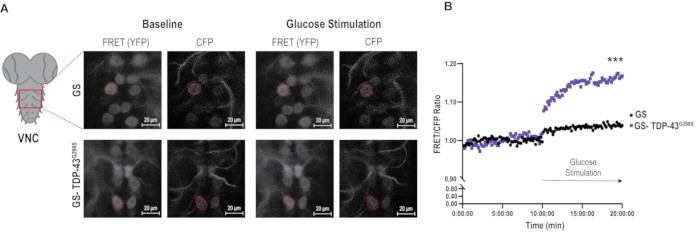
  5. Reuse the parameters to image all the genotypes (Figure 1A).

Access restricted. Please log in or start a trial to view this content.

Results

FRET ratio analysis, glucose stimulation; fluorescence microscopy images, FRET/CFP graph results.
Figure 1: Image analysis of glucose sensor in the context of TDP-43 mutant. (A) Representative images of FRET and CFP signals in glucose sensor controls and TDP-43G298S samples under baseline and stimulation conditions. A repres...

Access restricted. Please log in or start a trial to view this content.

Disclosures

No conflicts of interest declared.

Materials

List of materials used in this article
NameCompanyCatalog NumberComments
35 mm tissue culture dishesSigma AldrichCLS430165
40X water immersion lensZeiss440090dippable, N.A. 0.8
dissection scissorsRobozRS-5618
Dumont #5 forcepsVWR100189-236
Dumont #55 forcepsVWR100189-244
Minutien pinsFine Science tools26002-10used for dissections
SYLGARD 184 Silicone Elastomer KitDow1317318
Zeiss LSM880 NLO upright multiphoton/confocal microscopeZeissN/A

Tags

FRET SensorConfocal MicroscopyVentral Nerve CordFluorescence Resonance Energy TransferHL3 BufferImage Acquisition