This video demonstrates the analysis of peptide samples from neuromelanin granules (NMGs) isolated from human postmortem brain tissue. The peptides are first separated using high-performance liquid chromatography (HPLC) and then analyzed by mass spectrometry to determine their mass-to-charge ratios (m/z). Targeted peptides are fragmented to identify post-translational modifications and the resulting data is compared to a reference database to determine the proteomic profile of the NMGs.
A subscription to JoVE is required to view this content. Sign in or start your free trial.
Method Article
LC-MS/MS Analysis of the Proteomic Profile of Neuromelanin Granules Isolated from Human Brain Tissue
882 views
⸱
April 28th, 2025
In This Article
Abstract
Protocol
1. Tryptic digestion
1. Defreeze samples on ice.
2. Completely dry the samples in a vacuum concentrator.
3. Fill up the sample with 50 μL of a suitable digestion buffer, e.g., 50 mM ammonium bicarbonate.
4. After the addition of 1.25 μL of 200 mM 1,4-dithiothreitol, incubate the samples for 30 min at 60 °C and 300 rpm using a thermomixer and cool them down to room temperature (RT) afterwards.
5. Then, incubate samples at RT for 30 min in the dark after the addition of 1.36 μL 0.55 M iodoacetamide.
6. Add a suitable amount of trypsin to the samples and incubate the samples overnight (~16 h) at 37 °C.
NOTE: For 1,000,000 μm2, 0.1 μg of trypsin was found to be sufficient.
7. Add 2.6 μL of 10% trifluoroacetic acid (TFA) to the samples to stop the digestion (end concentration of 0.5% TFA).
8. Completely dry the samples using a vacuum concentrator. Then, fill samples up to a defined final volume with 0.1% TFA. NMG samples were filled up to 20 μL of which 5 μL were used for one mass spectrometric (MS) experiment.
9. Store the samples at -80 °C until further usage. Determine peptide concentration by amino acid analysis or another suitable quantification method (e.g., Direct Detect).
NOTE: Low sample amounts may not be quantifiable using the mentioned techniques. To ensure identical sample loading, each sample should contain the same amount of isolated tissue, and every sample should be treated equally.
2. High-performance liquid chromatography and mass spectrometry
NOTE: The following high-performance liquid chromatography (HPLC) mass spectrometric (MS) analyses are optimized for the specific LC system with a trapping column device and mass spectrometer used here (see Table of Materials). For other LC and MS systems, adaptation of parameters is recommended.
- Using the software Xcalibur, adjust the HPLC settings as follows.
- Trap column: Set temperature to 60 °C, flow rate to 30 µL/min, running buffer to 0.1% trifluoroacetic acid.
- Analytical C18 reversed-phase column: Set temperature to 60 °C, flow rate to 30 µL/min, running buffer A to 0.1% trifluoroacetic acid, running buffer B to 84% acetonitrile, and gradient to 5%-30% running buffer B over 98 min.
NOTE: Adaption of the gradient may be inevitable and is strongly recommended when using different tissues or cells. Total gradient time may vary due to sample loading at the beginning of the gradient and sample washing at the end of the gradient. The total gradient in this protocol consists of 7 min sample loading and additional column wash for 15 min resulting in a total gradient time of 120 min.
- Create a data-dependent acquisition (DDA) method using the XCalibur Instrument Setup, which can be found in the HPLC software roadmap menu.
- In the Global Parameters tab, define the infusion mode Liquid Chromatography, the Expected LC Peak Width (30 s), and the Default charge state (2).
- Proceed to the Scan Parameters tab and add the following scans and filters in the order mentioned: MS OT, MIPS, Intensity, Charge State, Dynamic exclusion, and ddMS2 OT HCD.
Optimal MS and DDA settings might vary for the specific mass spectrometer used as well as the sample type and should be, therefore, adapted. - Prepare samples by dissolving 200-400 ng of sample peptides in a defined volume of 0.1% TFA in inert mass spectrometric glass vial inlets. If concentration determination is not applicable due to low sample amount, verify identical sample loading by comparing the Total Ion Current (TIC).
NOTE: To do this, open the resulting file of mass spectrometric measurement in a suitable software, e.g., FreeStyle, and check the chromatogram. Intensities should be comparable for all samples. A representative TIC is shown in Figure 1. - Analyze the raw data obtained using a proteomic suitable software, e.g., MaxQuant, Progenesis QI for Proteomics, or Proteome Discoverer, and perform a statistical data analysis based on the research question.
3. Analysis of proteomic raw data using MaxQuant
- Load raw files into the MaxQuant software in the raw data header by clicking Load.
- Assign sample names by clicking on Set Experiment.
- Define group-specific parameters. First, add modifications. Due to sample processing, choose Deamidation (NQ), Oxidation (M), and Carbamidomethylation (N-term) as variable modifications, and add Carbamidomethylation (C) as fixed modification.
- Choose Trypsin as digestion enzyme in the Digestion tab.
- Add the label free quantification option LFQ in the Label Free Quantification tab. If more than 10 files are to be processed, choose the Fast LFQ option to shorten the processing time. Add iBAQ option as a measure for protein quantification.
- Ensure that all other group-specific parameters remain in factory settings.
- Proceed to the Global Parameters tab and add the FASTA file derived from uniprot.org in the Sequences tab. Modify the identifier rule accordingly and add the taxonomy ID, in this case, 9606 for homo sapiens.
- For protein quantification choose Unique and Razor peptides.
- Ensure that all other global parameters remain in factory settings.
- Click on Start and retrieve the proteingroups.txt output after MaxQuant analysis for further analysis in Perseus.
Access restricted. Please log in or start a trial to view this content.
Results
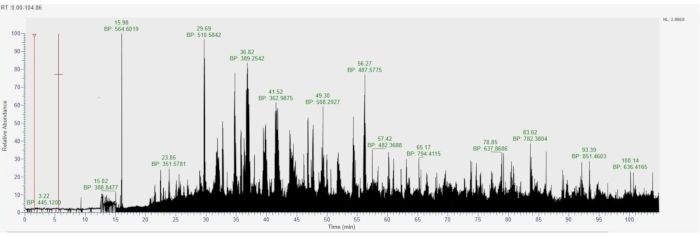
Figure 1: Total Ion Current (TI...
Access restricted. Please log in or start a trial to view this content.
Materials
| Name | Company | Catalog Number | Comments |
|---|---|---|---|
| 1,4-dithiothreitol | AppliChem | A1101 | |
| Acetonitrile | Merck | 1.00029.2500 | |
| Ammonium bicarbonate | Sigma-Aldrich | A6141 | |
| Formic acid | Sigma-Aldrich | 56302 | |
| Iodoacetamide | AppliChem | A1666,0100 | |
| Micro Tube 500 | Carl Zeiss | 415190-9221-000 | |
| Orbitrap Fusion Lumos Tribrid mass spectrometer | Thermo Fisher Scientific | IQLAAEGAAPFADBMBHQ | |
| PALM MicroBeam | Zeiss | 494800-0014-000 | |
| Trifluoroacetic acid | Merck | 91707 | |
| Trypsin sequencing grade | Serva | 37283.01 | |
| Ultimate 3000 RSLC nano LC system | Thermo Fisher Scientific | ULTIM3000RSLCNANO | |
| Name of Software | Weblink/Company | Version | |
| FreeStyle | Thermo Fisher Scientific | 1.6 | |
| MaxQuant | https://www.maxquant.org/ | 1.6.17.0 | |
| PALMRobo | Zeiss | 4.6 pro | |
| Perseus | https://www.maxquant.org/perseus/ | 1.6.15.0 | |
| Skyline | https://skyline.ms/project/home/software/Skyline/begin.view | 20.2.0.343 | |
| XCalibur | Thermo Fisher Scientific | 4.3 |
