This video showcases the imaging of insulin-induced GLUT4 translocation in hypothalamic neurons, employing deconvolution microscopy to capture and analyze GFP-GLUT4 trafficking dynamics with high resolution.
A subscription to JoVE is required to view this content. Sign in or start your free trial.
Method Article
Imaging GLUT4 Protein Trafficking in Mouse Primary Hypothalamic Neurons Using Deconvolution Microscopy
797 views
⸱
April 28th, 2025
In This Article
Abstract
Protocol
1.Live Image Recording
- Preparing Cells for Live Imaging
1. Culture WT and CCR5-/- hypothalamic neuron cells expressing green fluorescence protein labeled glucose transporter 4 (GFP-GLUT4) on the #1.5 (or 0.17mm thickness) glass coverslip which has been pre-coated with poly-D-Lysine in the 6-well plate.
2. Carefully remove the coverslips with neurons using forceps and place it on the glass slides with caution.
3. Remove excess medium/liquid with delicate task wipes. Fold the wipes twice, and carefully place them on top of the coverslip. Gently press down the wipes without moving the coverslip.
CAUTION: Do not press the coverslip against the glass slide forcefully. The purpose of this step is to ensure that the coverslip does not move/drift during image acquisition caused by buoyant force.
4. Place coverslips and slides on the deconvolution microscope stage, with the coverslip facing down, and secured properly. This step is to ensure that the slide position remains constant so users can track the same set of target cells later.
5. Observe WT and CCR5-/- hypothalamic neuron cells with a 60x/1.42 NA oil immersion objective lens.
6. Treat the selected cell samples with CCL5 (10 ng/mL) or insulin (10 U/mL) for one min. Add 1.5 µL of diluted insulin on the edge of coverslip.
7. Visualize and record the selected cell samples immediately. Program the video recording software to record for 30 min.
2. Deconvolution microscopy and analysis
NOTE: This part of the protocol requires the use of a deconvolution microscope and specialized software for analysis.
1. Turn on the power of the imaging system, allow microscope stage to initialize properly, and then turn on the LED light source.
2. Add immersion oil (refractive index 1.520 for live samples at 37 °C) on a 60x 1.42 NA objective lens. Place the sample slide on the microscope with the coverslip facing toward the objective lens and secure the slide properly.
3. Use bright-field or fluorescence illumination to identify target cells. Adjust the focus until target cells can be clearly observed. Do not move the objective lens outside of the coverslip area to avoid unnecessary scratch marks.
4. Identify green fluorescence protein conjugated Glucose Transporter 4 (GFP-GLUT4) by the GFP signal. Identify desired target cells for image acquisition. Selected target cell position can be memorized for future reference (see Figure 1).
5. Set up proper experimental parameters (including pixel number, excitation wavelength, transmission percentage, exposure time, stack thickness, time interval, and total imaging time) on each target cell. For this experiment, the image pixel number was set at 512 x 512 (it can be set at 1,024 x 1,024 for higher resolution) for GFP signals. The exposure time was set between 0.025 to 0.05 s for every 5 min. Minor lateral x, y, and z adjustments can be controlled by the recommended software (see Materials Table).
6. Set the exposure parameter to approximately 2,000 to 3,000 counts to achieve maximum pixel intensity. To minimize fluorescence photobleaching, reduce the percentage of excitation light transmission as much as possible while keeping exposure time less than 1 s. Repeat these steps for each additional fluorescence channel(s) and each individual area of interest.
7. Set the upper and lower limit of the Z-stack on each target cell. This can be achieved by moving the microscope stage until the top and bottom of the target cell are both slightly out of focus. The users can adjust the resolution of the Z-axis by setting the number of images between the upper and lower limit (which can be done by setting the distance between each image).
8. Stacks of images were deconvolved and later analyzed with the help of the respective software – Velocity from PerkinElmer in this case.
Access restricted. Please log in or start a trial to view this content.
Results
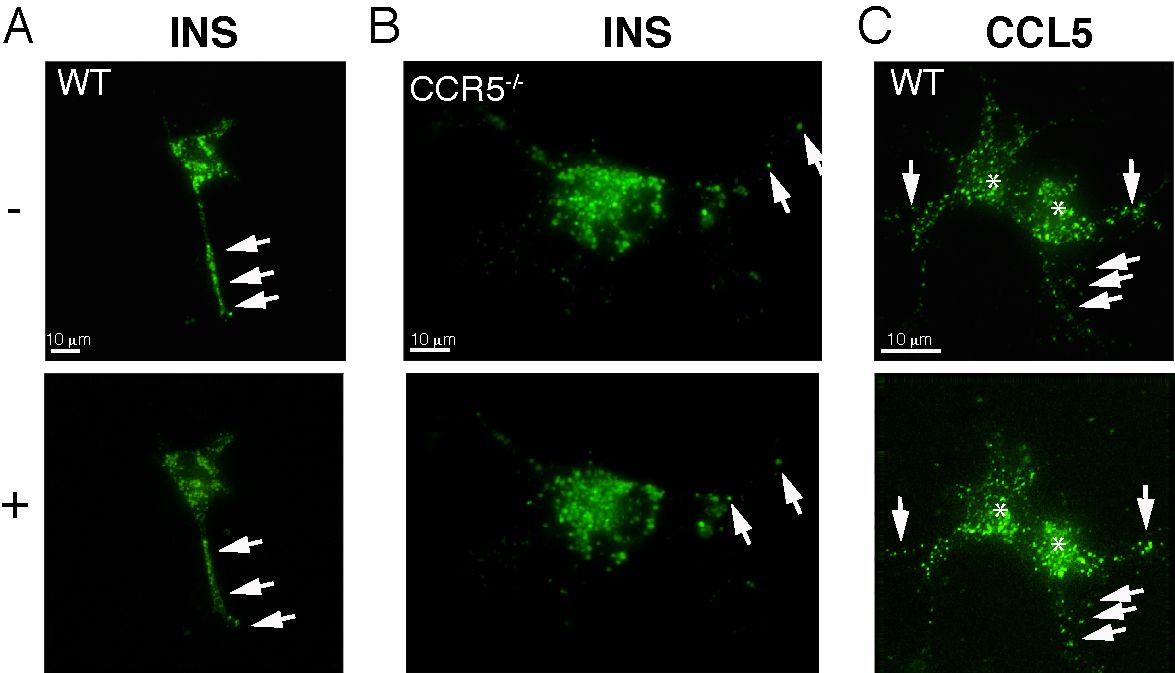
Figure 1: The snapshots of GFP-GLUT4 in hypothalamic neurons. (A, C) GFP-GLUT4 protein expressed in Wildtype (WT) hypothalamic neurons and (B) CCR5-/- hypothalamic neurons. Neurons wer...
Access restricted. Please log in or start a trial to view this content.
Materials
| Name | Company | Catalog Number | Comments |
|---|---|---|---|
| DeltaVision deconvolution microscope | Applied Precision Inc./(GE Healthcare Life Science) | equipped with 60x/1.42 NA oil immersion objective lens; used for taking live cell images | |
| SoftWorX application software | Applied Precision Inc. | used to control microscope and camera | |
| VoloCITY software | PerkinElmer | used to analyze the images | |
| Insulin | Actrapid, Denmark | ||
| Kimwipes | Kimberly-Clark | #FL42572A | 0.17mm thickness |
| 12 mm Microscope coverglass | Deckglaser | #41001112 | used for immmunstaining study |
| standard straight-tipped forceps | Ideal-tek | Surgical tool | |
| CCL5/RANTES | R&D Systems | 478-MR-025 | 10ng/ml |
| 5 ml pipette | Corning costar | 4487 | dissociate brain tissue |
