$$\rightleftharpoonup{xx}$$
$$\longleftharp{xx}$$,
$$\longrightharp{xx}$$,
All procedures involving animal samples have been reviewed and approved by the appropriate animal ethical review committee.
1. Morphological analyses of cerebellar granule neurons or CGNs - three-dimensional (3D) reconstruction and surface area and cellular volume
- Image single electroporated CGNs on a confocal microscope at 63x objective with a 2x zoom, taking z-stack images at 0.5 µm per stack. Image one cell per image window to allow for easy image analysis and reconstruction.
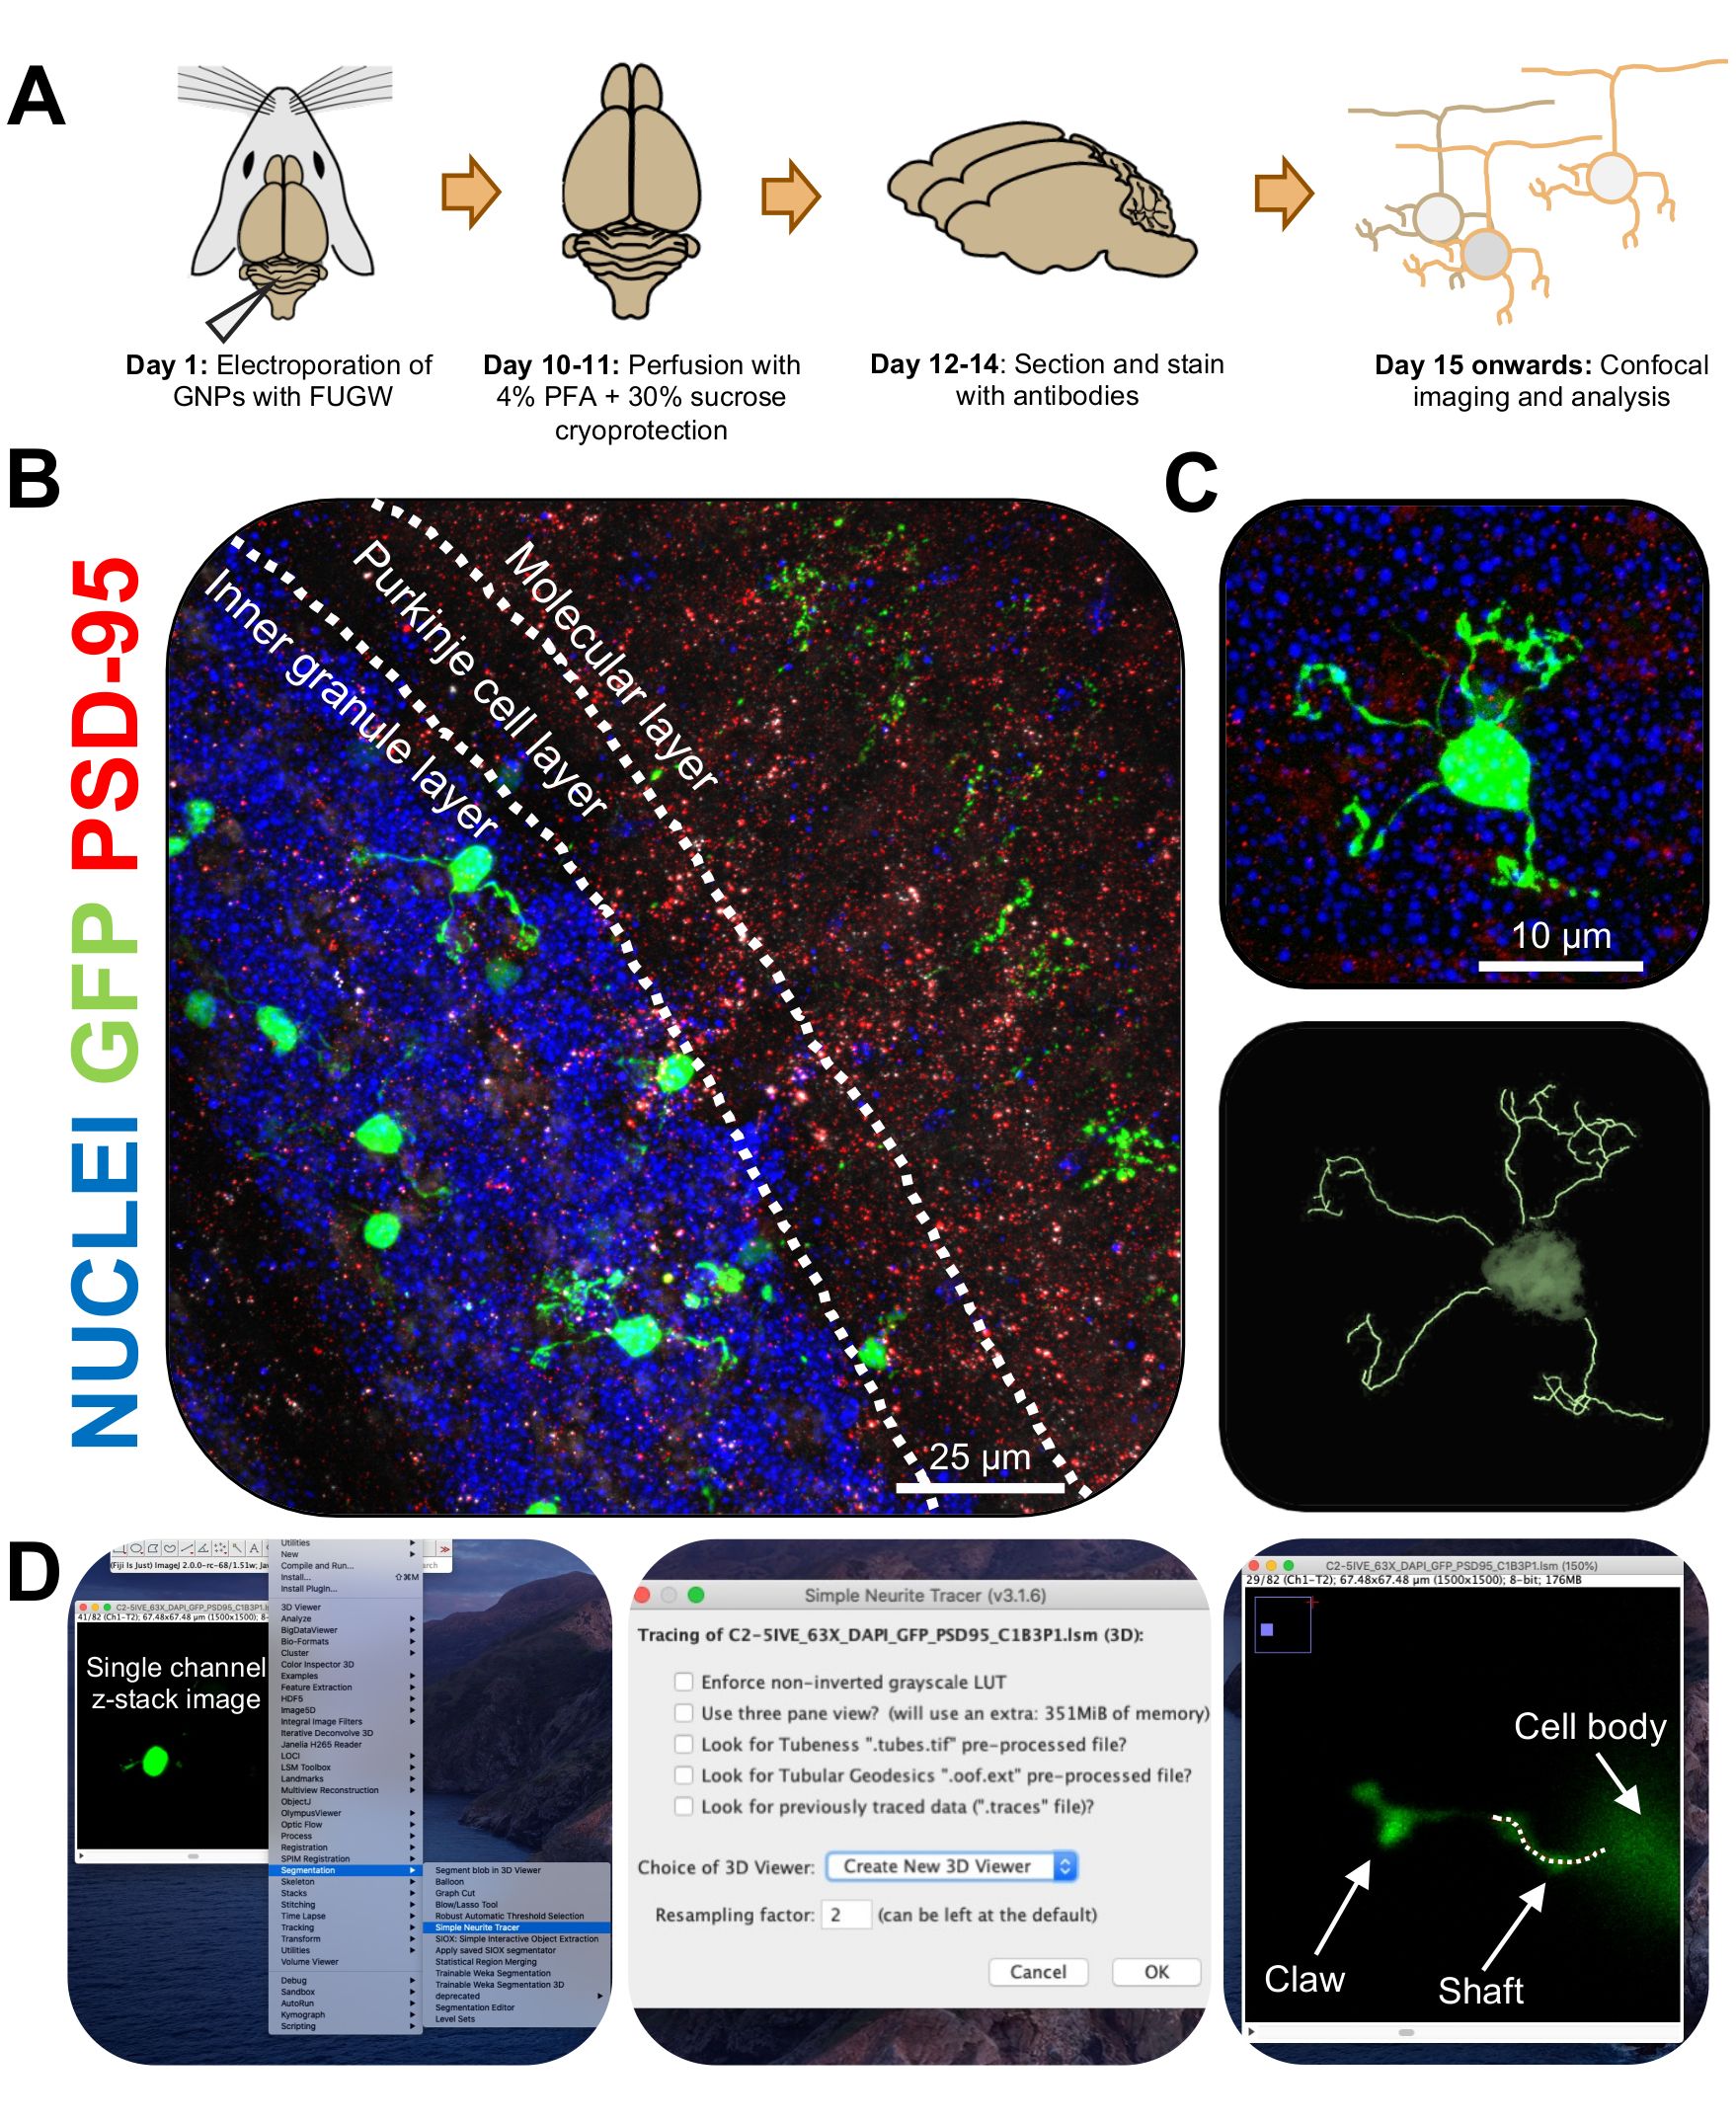
- Install the Simple Neurite Tracer plug-in for FIJI using the following link (https://imagej.net/Simple_Neurite_Tracer:_Basic_Instructions) to easily and efficiently trace the structure of electroporated CGNs in three-dimensional (3D) space.
NOTE: There is an updated version of the plug-in (https://imagej.net/SNT).
- Analyze neurite length and dendritic claw formation in a blinded manner using a Simple Neurite Tracer. Upload single-channel z-stack images of electroporated CGNs onto FIJI, and click on Plugins | Segmentation | Simple Neurite Tracer (Figure 1D).
- Access the drop-down menu, and select Create New 3D Viewer (Figure 1D).
- Scroll to the base of a dendrite, where it connects to the cell soma, and start a path by clicking on the junction. Manually trace the path by clicking through the sections where the cell-fill signal is brightest, pressing [y] to keep the trace. Trace until the end of the dendrite if it does not contain a claw or until the base of the claw and confirm the path by pressing [f] (Figure 2D).
- Next, trace the claw by starting a path at the base of the structure and tracing until the end of the longest neurite. Trace secondary and tertiary branches by holding down [ctrl] on Windows or [alt] on a Mac OS and clicking the path. Confirm the path by pressing [f].
- Observe that measurements for the traces are visible on a separate window; add up all of the measurements of the claw branches (primary, secondary, tertiary) to obtain the total length for each claw.
- For analyzing the surface area and cellular volume of electroporated CGNs, download Imaris cell analysis software (https://imaris.oxinst.com/).
NOTE: FIJI can also be used to reconstruct cells in 3D from z-stack images using readily available and free plug-ins. Additionally, Simple Neurite Tracer has a volumetric rendering feature, but Imaris was used for the reasons outlined below.
- Upload a z-stack image of an electroporated CGN onto Imaris. Access the 3D-reconstruction toolkit by pressing Surpass.
- To reconstruct the CGN, press Surfaces, and select a region of interest that encompasses the entirety of the cell within the image window. Once finished, press the blue forward arrow at the bottom right corner under Create.
- If the image contains multiple channels for different signals, select the channel containing the electroporated CGN, and press the blue forward arrow.
- Using the sidebar, set a desired threshold that most accurately fits the signal of the electroporated cell. Zoom in closer to the surface of the cell to accurately determine the threshold. Once finished, press the double green arrow to reconstruct the cell and obtain the surface area and volume size from the metadata.