$$\rightleftharpoonup{xx}$$
$$\longleftharp{xx}$$,
$$\longrightharp{xx}$$,
All procedures involving animal samples have been reviewed and approved by the appropriate animal ethical review committee.
1. Tissue processing
NOTE: Following transcardial perfusion and postfixation in 4% paraformaldehyde (PFA) diluted in 0.2 M phosphate buffer overnight at 4 °C, brains are transferred to 30% sucrose in phosphate-buffered saline (PBS) for three days at 4 °C. After that, the brains are frozen on powdered dry ice and stored at -80 °C until sectioning.
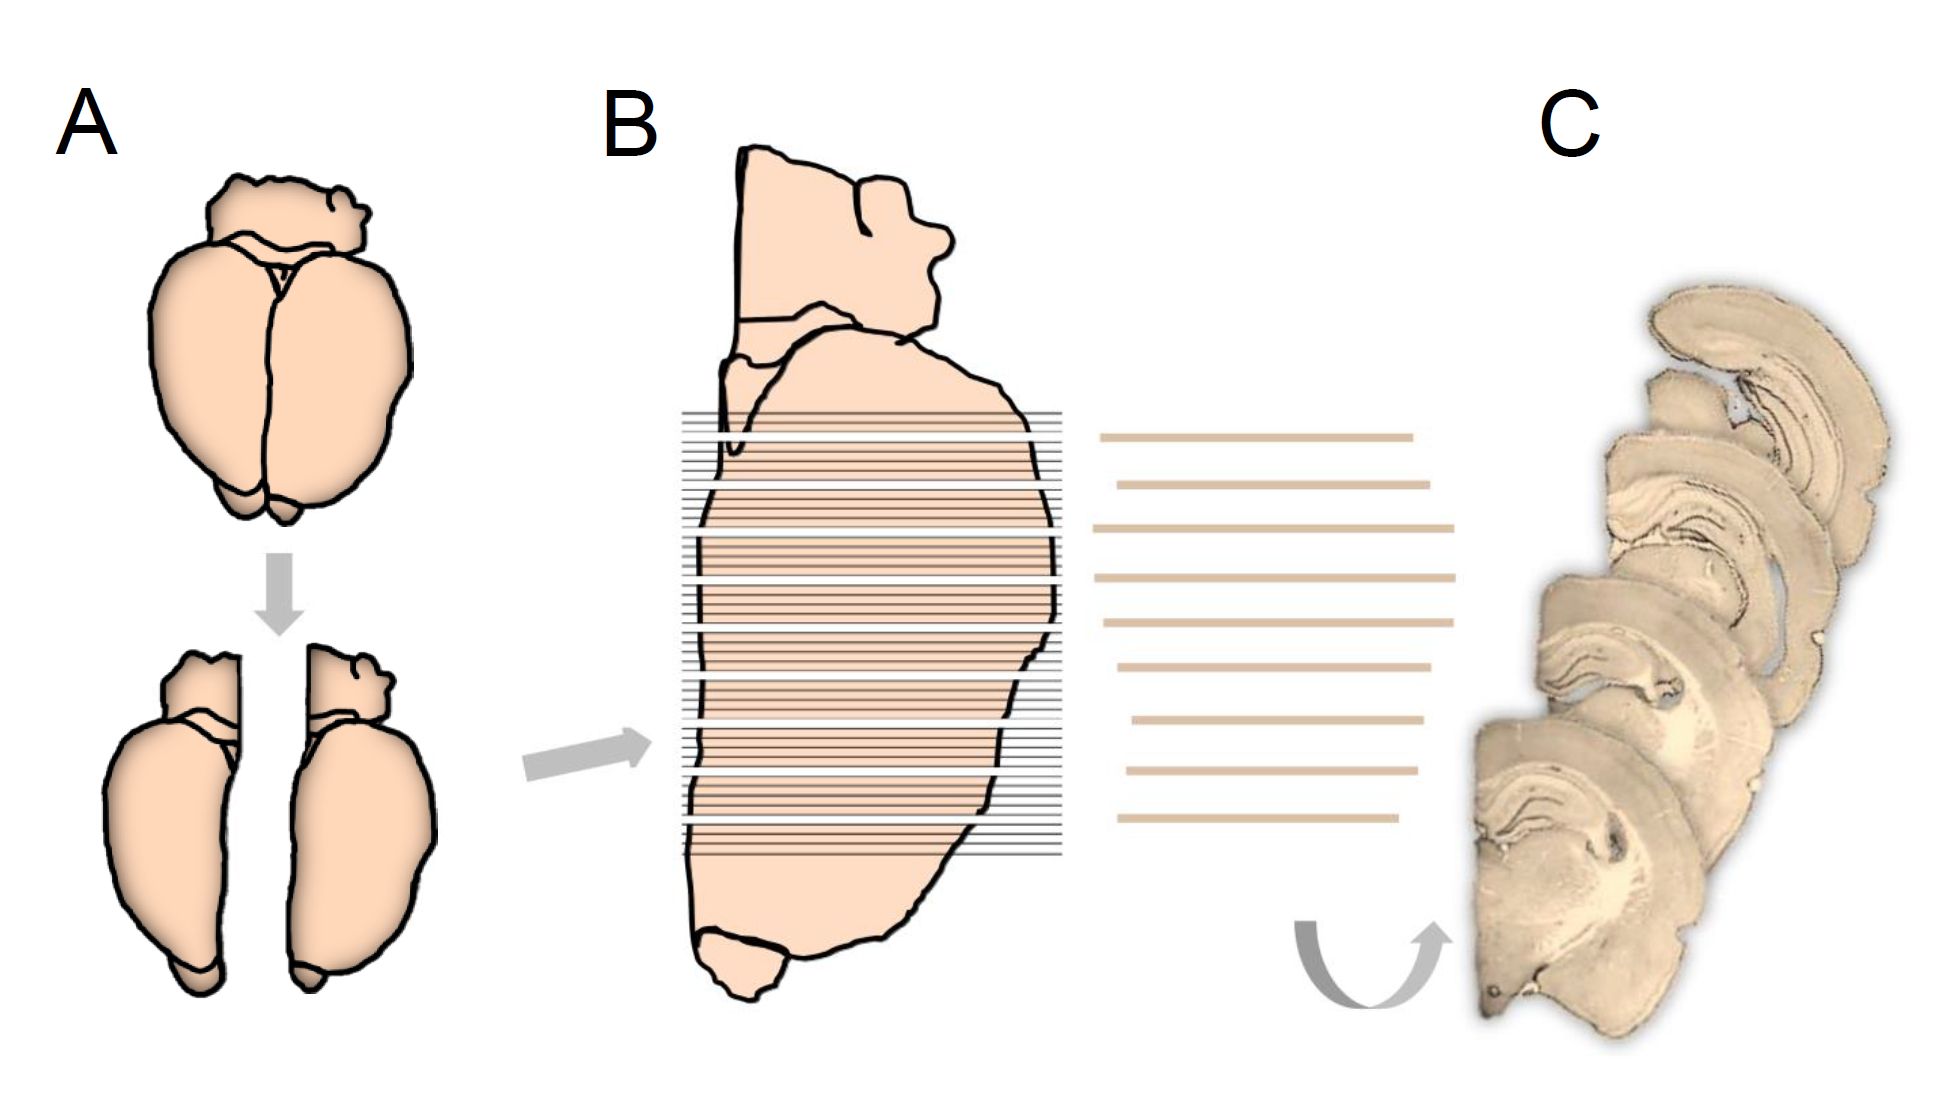
- Separate the right and left hemispheres along the brain's midline using a scalpel. Then, choose one or the other hemisphere randomly in the first brain. Afterward, shift systematically between the right and left hemispheres (Figure 1A). Mount the sampled hemisphere onto a specimen disc with the long axis perpendicular to the disc using a mounting medium.
- Place numbered multi-dish containers for pre-cooling in the cryostat.
- Mount the specimen disc into the cryostat and cut the entirety of the hippocampus (Bregma 1.80 to - 7.04) into 80 µm-thick sections in the coronal plane (Figure 1B).
- Place all sampled sections consecutively in the cooled multi-dish containers to keep the sections in cutting order.
- Cover the sections completely with cryoprotectant and hold the containers at -20 °C until further use.
2. Immunostaining
NOTE: To keep track of the individual sections throughout the staining procedure, place the sampled sections in 25-well staining nets. Use every 5th section, giving a mean final number of 12 (8-16) sections per hippocampus for immunostaining and subsequent cell counting.
- Before subsampling every nth section with a random start between sections one and n (Figure 1C), transfer the containers from -20 °C to room temperature (RT).
- Use a paintbrush, for example, to transfer the sections in numerical order to the 25-well staining nets placed in Petri dishes filled with phosphate-buffered saline (PBS).
NOTE: From this point, keep the sections in the staining nets placed in matching glass dishes on an orbital shaker (sections 2.3 to 2.9). - Transfer the staining nets to the matching glass dishes and wash the sections twice for 10 min in PBS at room temperature (RT) before incubation in 3% hydrogen peroxide (H2O2) diluted in distilled water (dH2O) for 20 min.
- Transfer the sections to three different solutions of hydrochloric acid (HCl) (1 M at 0 °C for 10 min, 2 M at RT for 10 min, and 2 M at 37 °C for 20 min) before neutralization in 0.1 M sodium tetraborate at RT for 20 min.
- After 3 × 10 min incubations in 1% Triton X-100 diluted in PBS (washing buffer), transfer the sections to washing buffer containing 10% fetal bovine serum (blocking solution) for 1 h at RT.
- Incubate the sections for 48 h at 4 °C in mouse-anti-BrdU (5-bromo-2’-deoxyuridine) diluted 1:100 in blocking solution.
- Wash the sections 3 × 10 min in washing buffer and incubate for 48 h in horse radish peroxidase diluted 1:10 in washing buffer.
- Transfer the sections to PBS for 5 × 10 min and then for 7 min in 0.01% diaminobenzidine (DAB) diluted in PBS before being transferred to a similar DAB solution containing 0.02% H2O2 for 10 min at RT.
- Complete a series of washes (2 × 10 min in PBS and 2 × 10 min in phosphate buffer without added sodium chloride) and mount the sections in numerical order on microscope slides.
- Dry the sections for approximately 30 min before counterstaining with cresyl violet.
- Place the microscope slides in a slide rack.
- Rehydrate the sections for 10 min in slide staining dishes containing dH2O, and then transfer the slides to 0.02% cresyl violet in dH2O for 15 min.
- Repeat step 2.12 before the sections are dehydrated three times in ethanol (96% for 5 min and 99% for 2 × 2 min).
- Place the sections in xylene for 2 × 15 min, and coverslip the slides using a rapid-drying medium for mounting.
- Finally, leave the cover-slipped slides for approximately 24 h before they can be used for microscopy.
3. Estimation of the total number of BrdU-labelled neurons using the optical fractionator
NOTE: Conduct a pilot study that includes a few animals to determine the optimal sampling parameters, such as the number of sections to be analyzed and the number of optical dissectors within the sampled sections. This pilot also provides a preliminary CV (standard deviation/mean) and the possibility of adjusting the CE to obtain a satisfactory precision of the estimates determined by the investigator (for more details, see below). Likewise, a z-distribution analysis will address the following points: tissue shrinkage, quality of the staining throughout the section, and distribution of the cells in the z-axis.
- Check the thickness of the tissue in the sections to confirm that they are suitable for the optical fractionator's use, e.g., thick enough for the chosen dissector’s height, including guard zones (see below). NOTE: The tissue thickness is measured in several places within the region of interest.
- Place the slides on the motorized stage of the microscope and turn on the preferred stereological software.
- Delineate the area of interest using a low-magnification objective (2X or 4X) before changing to a 100X oil-immersion objective (see Figure 2A).
- Using a specific point of a counting frame (e.g., at or adjacent to a corner), locate the top of the section by moving along the focal plane until some fsection feature appears in focus. Register this z-position as 0 (see Figure 2B).
- Move the focal plane down through the tissue until the same specific point of the counting frame is at the last z-level of tissue in focus and mark this position. The local tissue thickness is defined from 0 to this endpoint and can be read on the z-axis. Register the tissue thickness (see Figure 2B).
- Document full penetration of the stain and distribution of the cells in the full thickness of the section.
NOTE: The distribution of BrdU-labelled neurons is used as a guide for determining the required guard zones. Although a uniform distribution of cells is critical, observing fewer cells near the top and bottom of the section is acceptable, indicating the effect of lost caps.- Sample BrdU-labelled neurons and register their z-position together with the local section thickness measured in the selected corner of each counting frame.
- Plot the number of BrdU-positive neurons as a function of their z-position.
- The height of the director and guard zones should be fixed based on the mean section thickness and the distribution of cells (see 3.1 and 3.2).
NOTE: The height of the dissector should be less than the section thickness to avoid artifacts close to the surfaces. This risk is circumvented by including guard zones at the top and bottom of the section. - Determine the step length between the dissectors.
- Delineate the region of interest on all the sections to be analyzed and register the areas.
- Sum these areas and divide by the number of dissectors placed within this area.
NOTE: Based on previous experience, a good starting point entails 75 probes. This will approximate the area and the corresponding sampling positions (Astep). - Take the square root of Astep, which will provide the x-y-step size.
- Determine the size of the counting frame.
- Set the size of the counting frame to an arbitrary unit and perform a pilot sampling of BrdU-positive neurons using the parameters obtained in sections 3.3 and 3.4.
NOTE: The size must be determined empirically by trial and error, but adjusting to enable sampling of 2-3 cells per dissector is recommended.
- Following this final step of the pilot study, begin cell sampling.
NOTE: The obtained sampling parameters should result in counts of approximately 150-200 cells in each animal, sufficient to obtain an efficient stereological design. - Count the BrdU-positive neurons using a 100× oil-immersion objective and a final magnification 2000-3000×. In each optical dissector, identify any BrdU-labelled neurons that are recognized by the feature of interest (in the present study, the criterion is when the leading edge of the BrdU-labelled neuron comes into focus for the first time), are located inside the counting frame or touch the inclusion lines (Figure 2B). Do not count the BrdU-positive neurons that touch the exclusion lines when clearly recognized by the feature of interest inside the dissector height. It is critically important to follow carefully these counting rules throughout the entire stereological quantification.
NOTE: As BrdU incorporates into all dividing cells, morphology distinguishes between neurons and other types of cells. Neuron characteristics are a clearly defined nucleus with a neutral cytoplasm and a dark nucleolus. BrdU-positive cells are recognized as newly formed neurons based on their larger size than glial cells. In studies of short-term proliferation (e.g., < 2,4 h), double staining using immature neuronal markers may be a prerequisite.