In this video, we explore the technique of high-intensity UV laser ablation for precisely targeting and studying individual neurons in transgenic zebrafish. We demonstrate how to prepare, immobilize, and visualize neuronal responses, highlighting the cellular dynamics of injury and recovery.
A subscription to JoVE is required to view this content. Sign in or start your free trial.
Method Article
Selective Single-Neuron Laser Ablation in a Zebrafish Larva Using a Confocal Microscope
853 views
⸱
May 29th, 2025
In This Article
Abstract
Protocol
- Prepare solutions for zebrafish embedding in agarose.
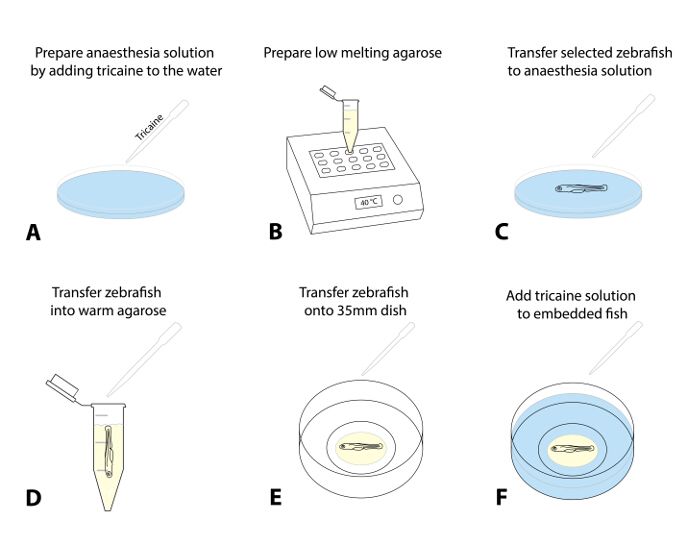
- Prepare an anesthesia solution by adding 4 g/L MS222 (tricaine stock solution, pH 7.0) dropwise to a Petri dish containing egg water. A dose of 50 mg/L is a recommended starting point (Figure 1A).
- Prepare a stock of low-melting agarose (0.8 - 1.5%) in egg water and aliquot it into 1.5-mL microcentrifuge tubes. Place an aliquot into a pre-heated heat block (38 - 40 °C) and let it equilibrate to the set temperature (~ 30 min; Figure 1B).
- Optional: For longer-term imaging (> 4 h), prepare a little agarose circle within the 35-mm glass-bottom Petri dish and allow it to set.
NOTE: This extra step was effective in avoiding any movement of the whole agarose drop with the zebrafish over longer time frames.- To do so, place ~ 300 µL of agarose along the inner circle of the glass-bottom dish to prepare a doughnut-shaped circle with a little opening in the middle in which to place the fish (step 1.5.3).
- Mount the zebrafish in agarose for microscopy.
- Select 1 - 3 of the pre-screened fish for ablation and anesthetize the larvae by transferring them (using a transfer pipette) into a dish with the anesthesia solution (step 1.4.1; Figure 1C; approximately 5 min).
NOTE: The fish are anesthetized when they show a shallow opercular movement and a decreased heart rate and no longer display a touch-evoked escape response (TEER; failure to swim away after gently touching their tail with a brush). Ensure appropriate anesthesia for the ethical treatment of the fish and to prevent twitching upon transfer into agarose or exposure to fluorescent light. - After the anesthesia is confirmed, suck up a larva using an adjustable pipette (with a cut-off 200-µL tip set to ~ 30 µL) and let it sink to the bottom of the tip. Transfer the larva into preheated agarose (step 1.4.2) by releasing a drop of the liquid with the larva into the agarose (try to minimize the amount of egg water going into the agarose; Figure 1D).
- Suck up the fish surrounded by agarose. Dispense it quickly into the previously prepared glass-bottom 35-mm dish.
- Use a dissection microscope and a standard paint brush (long liner, size 1) to position the animal within the agarose on the side (head to the left) so that body and tail are flat (Figure 1E). If working with multiple fish, align all the fish in the dish so that they are easily located using the confocal microscope later on.
NOTE: Quickly perform this procedure of positioning and aligning (it may require some practice, as the agarose starts to set immediately after exposure to colder temperatures). - Leave the agarose-embedded fish for 10 - 15 min until the agarose is set firmly. Carefully top up the 35-mm Petri dish with ~ 2 mL of egg water containing tricaine (Figure 1F).
- Select 1 - 3 of the pre-screened fish for ablation and anesthetize the larvae by transferring them (using a transfer pipette) into a dish with the anesthesia solution (step 1.4.1; Figure 1C; approximately 5 min).
2. Set up the Confocal Microscope and Imaging Parameters
- Place the Petri dish with the embedded larva on the confocal microscope stage and focus on the dorsal side of the animal spinal cord (using bright field). Examine the animal under the appropriate magnification (40X) and fluorescent setting and visualize the structure of interest (e.g., fluorescence intensity of the labeled neurons or microglial movement) to confirm that all imaging parameters are as needed for subsequent ablation (Figure 2). We routinely use the 40X objective to perform our time lapse studies.
- Optional: To perform a time-lapse study for several hours, it is advisable to record a single or a few time-points prior to ablation to establish the unperturbed physiological response of the cell and its environment (e.g., microglial movement to establish baseline speed and motility).
- Determine the thickness of the structure of interest for the UV laser ablation.
- Using the z-drive, verify the top and bottom of the structure of interest (e.g., the cell soma) by manually focusing up and down. Note down the z-plane that will be ablated (e.g., the center of the cell).
NOTE: From experience, this method was most effective by targeting spinal cord neurons that were brightly labeled (a high signal-to-noise ratio that allows easy time-lapse visualization after ablation; e.g., Figure 4) and by ablating the middle of the cell soma. Cell nucleus fluorescence can be of advantage to assure correct targeting and high ablation efficiency.
- Using the z-drive, verify the top and bottom of the structure of interest (e.g., the cell soma) by manually focusing up and down. Note down the z-plane that will be ablated (e.g., the center of the cell).
3. Perform Targeted Laser Ablation of Individual Cells in the Zebrafish Spinal Cord
NOTE: For this ablation and visualization approach, a confocal microscope (Leica SP5) was used. The ablation procedure using a 405-nm diode for cell-specific destruction is detailed according to the software (Leica Application Suite, v2.7.3.9723). However, any conventional confocal microscope that is equipped with a 405-nm laser and a FRAP (fluorescence recovery after photobleaching) or bleach module will allow the performance of the same cell manipulations, but potentially with slightly different settings, parameters, and names.
- Start the FRAP wizard by clicking on the dropdown menu at the top of the software menu (Figure 3A, 1 and 2). Observe a new window with different steps that allows the set up of the specific parameters for the laser ablation (Figure 3B, 3).
- Determine the image parameters for the ablation approach by selecting the format, scan speed (Figure 3B, 4), and averaging (Figure 3B, 5). An image format of 1,024 x 1,024 at a scan speed of 400 Hz and a line average of 4 was most applicable.
NOTE: There is generally no need to change the spectral detection (such as the excitation or emission parameters), as they have been determined in the previous acquisition.- If the z-plane for ablation hasn't already been selected (as described in step 2.4.), press the "Live" button and focus through the specimen until the fluorescent structure or the desired z-plane that is going to be ablated is in focus.
- Once the general image parameters are set, access the "Bleach" step (Figure 3C, 6) to control the specific ablation components.
NOTE: A combination of the laser intensity (Figure 3C, 8), the scan speed, and the averaging that has been set in step 3.2 (Figure 3B, 4 and 5), as well as the number of repetitions that will be set in step 3.5 (Figure 3E, 12), will determine the overall dwell time of the UV laser at the ROI, and therefore, the bleaching efficiency.- Engage the 405-nm laser by activating it for the bleaching procedure (Figure 3C, 8).
NOTE: Most success with the aforementioned settings was achieved with 405-nm laser intensities between 60 - 80% in our experimental setup. Be aware that this laser power output is instrument-specific and will differ for every confocal setup. - Use the "zoom in" option (Figure 3C, 7) to maximize the bleaching intensity at the selected ROI by reducing the scan field, therefore maximizing dwell time. Alternatively, use the "Bleach point" option of the software of choice for this process.
- Engage the 405-nm laser by activating it for the bleaching procedure (Figure 3C, 8).
- Select one or multiple ROIs (Figure 3D, 10) for the ablation by using any of the drawing tools in the image acquisition window (Figure 3D, 9). Target the axon hillock, for example, with the circular drawing tool of approximately 4 - 8 µm.
NOTE: The ablation area is adjustable from a single pixel to a larger area, depending on the application. - After establishing the ROI, select the "Time Course" button (Figure 3E, 11) and confirm the number of cycles the ROIs will be scanned/ablated (Figure 3E, 12). Choose the "Pre-Bleach" and "Post-Bleach" frames as desired to permit an overview of the whole image just before and immediately after the bleaching process.
- After establishing all the necessary ablation parameters, press "Run Experiment" (Figure 3E, 13) and monitor the efficiency of the ablation.
NOTE: In our FRAP setup, a single image will be taken before and after the FRAP cycle with the appropriate laser excitation (e.g., 488-nm excitation for EGFP-expressing cells). These pre- and post-ablation pictures allow a quick judgment of how satisfactorily the ROI was bleached and how effective the chosen ablation parameters were. - Repeat the process by adjusting the laser intensity (Figure 3C, 8), scan speed and averaging (Figure 3B, 4 and 5), and repetitions (Figure 3E, 12) in case the selected ROI still shows high fluorescence intensity after completion of the FRAP cycle.
Access restricted. Please log in or start a trial to view this content.
Results
Access restricted. Please log in or start a trial to view this content.
Materials
| Name | Company | Catalog Number | Comments |
|---|---|---|---|
| Agarose low melting | |||
| Tricaine | |||
| Harvard standard wall Borosilicate with filament Capillary Glass | |||
| Egg water | |||
| Heat block | |||
| Microscope | |||
| 35mm glass bottom dish |
