This video demonstrates a confocal macroscopic method to track the ex vivo migration of granule cells in cerebellar slices from postnatal rat brains.
A subscription to JoVE is required to view this content. Sign in or start your free trial.
Method Article
Ex Vivo Imaging of Postnatal Cerebellar Granule Cell Migration Using Confocal Macroscopy
528 views
⸱
June 17th, 2025
In This Article
Abstract
Protocol
All procedures involving animal samples have been reviewed and approved by the appropriate animal ethical review committee.
1. Fluorescent Staining of Living Interneurons
1. Transfer cerebellar slices with a wide-bore glass truncated Pasteur pipette to a 6-well plate (max 3 slices/per well). Aspirate the Hanks’ balanced salt solution (HBSS) medium.
2. Incubate slices (3 max) in 5 ml of loading solution of the fluorescent dye (10 μM).
3. To protect from light, cover the microplate with aluminum foil. Put it on a gyro-moving table at 35 rpm for 10 min at RT to facilitate cell labeling.
4. Transfer slices on the membrane of a Transwell insert (3.0 μm pore size; Figure 1D) with a wide-bore glass truncated Pasteur pipette. Aspirate the loading medium with pipette.
5. Remove the insert and fill the well with 1.9 ml of Dulbecco's modified eagle medium (DMEM). Replace the insert and add 100 μl of DMEM on top of the slice to cover the tissue.
6. Place the plate containing the culture inserts in the incubator chamber (37 °C, 5% CO2) for 2 hrs which is sufficient to observe granule cells (GCs) in the molecular layer (ML). Lie tissues flat to allow attachment on the insert membrane (Figure 1E). Ensure that slices are not drying.
2. Ex vivo Imaging Through Confocal Macroscopy
1. Transfer the plate without the plastic lid into an incubator attached to the stand of a confocal macroscope. Place a glass cover on the plate insert of the macroscope. Keep the temperature of the chamber at 37.0 °C ± 0.5 °C and supply the slices with constant gas flow (95% O2, 5% CO2) through the plate insert to maintain the pH constant. Wait for 2 additional hours before time-lapse experiment.
2. To visualize GC migration in the tissue slices, illuminate the preparation with a 488 nm wavelength light by means of a laser diode through a confocal laser scanning macroscope equipped with a X2 dry objective (working distance: 39 mm, diameter: 58 mm, NA = 0.234), and detect fluorescence emission from 500 to 530 nm.
1. To finely resolve the movement of GCs, acquire images with an additional optical zoom factor of 1.5 to 2.0. Collect images of GCs in a single focal plane or up to 10 different focal planes along the z-axis every 30 min for up to 12 hr.
3. When necessary, remove the glass cover and add small volumes (1-10 μl) of biological activators or inhibitors in DMEM with a 10 μl pipette to study their effect on GC migration.
3. Cell Tracking
1. For each time of the movie, perform z-stack projection through the ecart-type mode in ImageJ. Modulate the contrast and the brightness levels of the successive images to facilitate the identification and the tracking of labeled GCs. Map manually each position on the reference snapshot (at t = 0).
1. Use the “Manual tracking” plugin in the Analyse Particle Menu and determine by clicking the gravity point of each cell body during timelapse. Export the raw tracking data in a spreadsheet.
2. Reorganize the exported raw tracking data from ImageJ with a smart home-made program that identify each cell and associated positions. Using the program, calculate the total travelled distance and the average speed of migration for each cell. Classify and compare characteristics of cell migration in control and treatment conditions under appropriate filters using the same program.
Access restricted. Please log in or start a trial to view this content.
Results
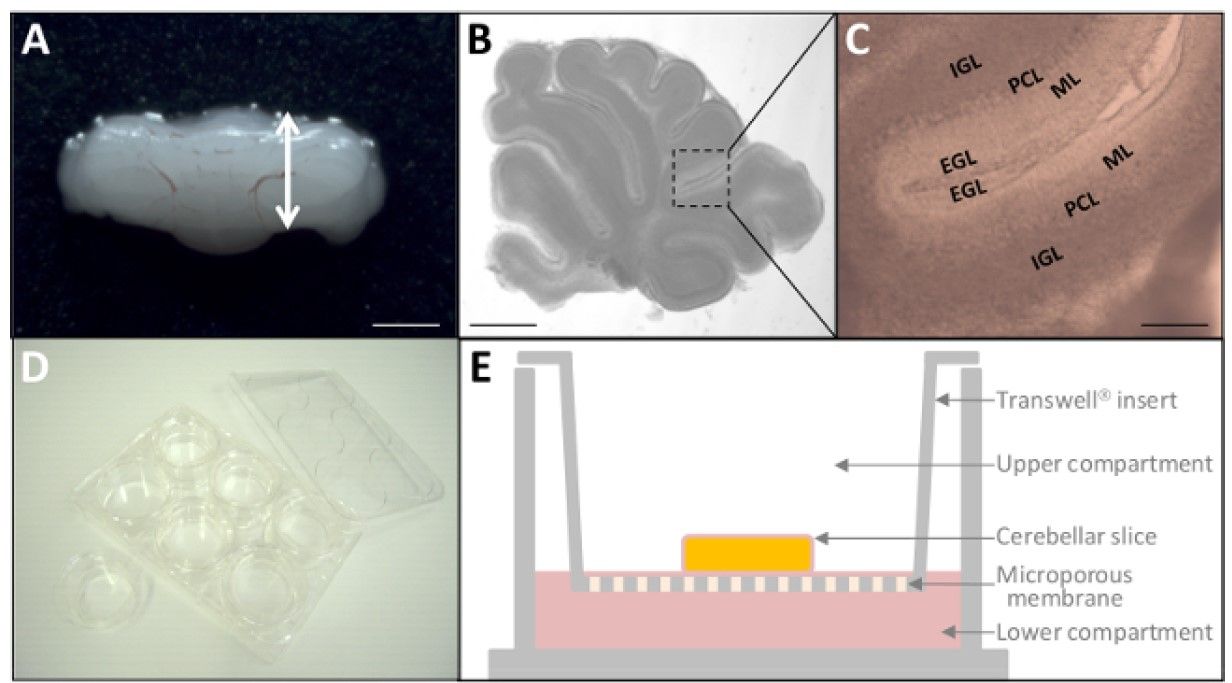
Figure 1: Ex vivo culture of P10 cerebellar slices. (A<...
Access restricted. Please log in or start a trial to view this content.
Materials
| Name | Company | Catalog Number | Comments |
|---|---|---|---|
| Dulbecco’s modified eagle medium (DMEM) nutrient mixture F-12 | Sigma-Aldrich | D8437 | |
| Cell Tracker Green CMFDA | Invitrogen | C2925 | |
| Polyester Transwell-Clear inserts | Corning | 3452 | |
| 6-well Cell culture cluster | Corning | 3516 | |
| DMSO | Fisher Scientific | BP231-100 | |
| Gyro-rocker, SSL3 | Stuart | ||
| CO₂ incubator, Hera Cell 150 | Thermo Scientific | ||
| Confocal macroscope, TCS LSI | Leica Microsystems | ||
| CO₂-controller | PeCon | ||
| Hank's balanced salt solution 10x | Sigma-Aldrich | H1641 | |
| Adjustable-volume pipette (0.5-10μL) | Eppendorf | 4910 000.018 | |
| Temperature controller | PeCon |
