Fibroblasts from patients carrying mutations in Parkinson's disease-causing genes represent an easily accessible ex vivo model to study disease-associated phenotypes. Live cell imaging gives the opportunity to study morphological and functional parameters in living cells. Here we describe the preparation of human fibroblasts and subsequent monitoring of mitochondrial phenotypes.
A subscription to JoVE is required to view this content. Sign in or start your free trial.
Method Article
The Use of Primary Human Fibroblasts for Monitoring Mitochondrial Phenotypes in the Field of Parkinson's Disease
In This Article
Summary
Abstract
Parkinson's disease (PD) is the second most common movement disorder and affects 1% of people over the age of 60 1. Because ageing is the most important risk factor, cases of PD will increase during the next decades 2. Next to pathological protein folding and impaired protein degradation pathways, alterations of mitochondrial function and morphology were pointed out as further hallmark of neurodegeneration in PD 3-11.
After years of research in murine and human cancer cells as in vitro models to dissect molecular pathways of Parkinsonism, the use of human fibroblasts from patients and appropriate controls as ex vivo models has become a valuable research tool, if potential caveats are considered. Other than immortalized, rather artificial cell models, primary fibroblasts from patients carrying disease-associated mutations apparently reflect important pathological features of the human disease.
Here we delineate the procedure of taking skin biopsies, culturing human fibroblasts and using detailed protocols for essential microscopic techniques to define mitochondrial phenotypes. These were used to investigate different features associated with PD that are relevant to mitochondrial function and dynamics. Ex vivo, mitochondria can be analyzed in terms of their function, morphology, colocalization with lysosomes (the organelles degrading dysfunctional mitochondria) and degradation via the lysosomal pathway. These phenotypes are highly relevant for the identification of early signs of PD and may precede clinical motor symptoms in human disease-gene carriers. Hence, the assays presented here can be utilized as valuable tools to identify pathological features of neurodegeneration and help to define new therapeutic strategies in PD.
Protocol
1. Skin Biopsy and Culturing of Human Fibroblasts
- The skin biopsy has to be taken by an experienced physician. The procedure takes place under sterile conditions and requires local anesthesia. Typical sites used for biopsy are the inner side of the upper arm, shoulder or lower back.
- You can take 4x4mm or 6x6mm diameter specimen by punch biopsy to get enough tissue for culturing human fibroblasts.
- Cut the skin biopsy into equal small pieces under sterile conditions to separate them into 2-4 T25 flasks. Every flask should contain 2-3 pieces of epidermis. The culture media contains 15% FCS, 1.1% sodium pyruvate and 1% penicillin/streptomycin in Roswell Park Memorial Institute (RPMI) 1640 medium.
- Incubate the cells at 37 °C and 5% CO2. The expected propagation time until first fibroblasts grow out of the epidermal sample is 1-2 weeks. If growth problems are encountered, you can make use of fibroblast growth factor (5-10 ng/ml FGF2) to enhance growth of cells.
- Once a cell confluency of 50-70% is reached, the primary human fibroblasts can be frozen. The time until 50-70% confluency is reached, differs among cell lines. Freeze the fibroblasts in 90% FCS plus 10% dimethyl sulfoxide (DMSO).
2. Preparation of Human Fibroblasts for Live Cell Imaging Microscopy
In general, experiments with human fibroblasts should be performed with passages below 10 as senescence-associated alterations can change properties of cells after multiple passages. In case of doubt, beta-galactosidase assays can be used to assess the induction of ageing processes in the respective cells. Generally, do not use aged fibroblasts(see above). Furthermore, to compare several cell lines, work with the same passage number of each cell line. Comparison of different genetically homogenous patients compared to healthy controls is recommended. However, as sometimes patients carrying specific mutations can be rare, this can mean that skin biopsies from only one patient with a certain passage number and different control lines have to be included - here it is essential to ensure the same passage number of all lines included. If a cell confluency of 50-70% is reached but no experiment planned, fibroblasts should be frozen.
- On the first day of the experiment, wash the attached fibroblasts once with PBS. Then release them from the flask bottom by using a cell detachment solution of proteolytic DNase enzymes (i.e. AccuMax).
- Count your cells and seed 50,000-70,000 cells in each well of a 4-chamber coverglass (1.8 cm2 culture area per well). Accordingly, for the 8-chamber coverglas, half of the cell number or a little less is appropriate (0.8 cm2 culture area per well). It is important to seed rather a small number of cells to perform real single-cell analysis. No specific coating for the chambers is needed.
- After 24-48 hr, the live cell imaging experiment can be performed. Ensure that the live cell imaging microscope is equipped with an incubator that controls temperature and CO2 levels. During image acquisition, an atmosphere of 37 °C and 5% CO2 should be maintained.
- Each live cell imaging measurement should be carried out in at least three independent experiments. In total, a minimum of 50 cells per cell line should be imaged. The live cell imaging experiments as well as the off-line analyses have to be performed under blinded conditions to guarantee unbiased data collecting.
3. Measurement of Mitochondrial Function in Living Human Fibroblasts
For conventional measurement of mitochondrial function via mitochondrial membrane potential (MMP)-dependent dyes, fluorescent activated cell sorting (FACS) is the primary method. In the case of human fibroblasts, cellular autofluorescence is frequently observed and may cause false positive results by interference with the actual staining signal. Autofluorescence typically becomes more pronounced with higher passage numbers of fibroblasts. Therefore, we prefer to assess mitochondrial function of human fibroblasts by live cell imaging microscopy.
- 24-48 hr after seeding, incubate the fibroblasts in 50 nM of the MMP-dependent dye tetramethylrodamine ethyl ester (TMRE) in RPMI medium. This RPMI medium should lack phenol red as this can negatively affect image quality. 1.6 μM of Hoechst staining should be added to visualize nuclei.
- Incubate cells in prepared staining solution protected from light for 15 min at 37 °C and 5% CO2.
- Replace the staining solution with RPMI medium (without phenol red). Proceed without a washing step and immediately image cells. Use 63x magnification and confocal laser scanning microscopy technique (alternatively fluorescence microscopy using Apotome technique) to define single layers of cells. Apply 37 °C and 5% CO2 to cells during imaging process.
- When imaging the fibroblasts, pay maximum attention to the applied exposure time of fluorescent light as TMRE staining can bleach out quickly. Define your appropriate exposure time between 200 and 300 ms and do not exceed this interval. The image acquisition under standardized settings is very important, as one would be unable to make comparisons based on intensity if the settings are different between cell lines.
- As a defined radius around the imaged cells is bleached out after light exposure, keep the next visual field adequately far from the photobleached section.
- Off-line analyses are performed using ImageJ Software (Wayne Rasband; National Institutes of Health, USA).
- Select your cell of interest by using a selection tool.
- Convert image to 8-bit (Image < Type < 8-bit).
- Reduce unspecific noise by using the "despeckle" function (Process < Noise < Despeckle).
- Choose the "Lookup Tables - Fire" condition (Image < Lookup Tables < Fire).
- Switch in the threshold function to the "Over/Under" function and adjust threshold (Image < Adjust < Threshold).
- Select the "analyze particles" option, which will give you the mean gray value for each mitochondrial particle detectable (Analyze < Analyze Particles). Save the given result list as an Excel spreadsheet.
- Open result file in Excel program and calculate the average of the mean gray value of the mitochondrial structures (indicated as 'mean' in the given excel result list).
- To create a surface plot, choose the plugin "Interactive 3D surface plot" in the "3D" plugin section. Here, you can further adjust the plot using different display options. Changing the "Original Colors" to "Spectrum LUT" gives the intensity scale bar for the appropriate plot.
- Alternatively to using TMRE for analyzing the mitochondrial function of human fibroblasts via live cell imaging, a combination of the MMP-independent dye Mitotracker Green FM and the MMP-dependent dye Mitotracker CM-H2XRos can be used. Again, for human fibroblasts live cell imaging microscopy is preferred, but in general this alternative has also been used using FACS analysis in other kind of cells 12. When using this alternative approach to measure mitochondrial function in human fibroblasts, step 3-7 of the protocol section 5 "Measurement of mitochondrio-lysosomal colocalization in living human fibroblasts" should be applied. Therewith, the overlay of signals, both from mitochondria positive for Mitotracker Green FM and Mitotracker CM-H2XRos is calculated and indicates the amount of functional mitochondria as ratio to all mitochondria present.
4. Measurement of Mitochondrial Morphology in Living Human Fibroblasts
- 24-48 hr after seeding, incubate cells in 200 nM Mitotracker Green FM in RPMI medium (no phenol red) protected from light for 15 min at 37 °C and 5% CO2. 1.6 μM of Hoechst staining should be used to highlight nuclei. Mitotracker Green FM is a MMP-independent dye, which stains all mitochondrial structures present.
- Gently wash the cells once with PBS.
- Add fresh RPMI medium (without phenol red) to cells and immediately image cells. Use 63x magnification and confocal laser scanning microscopy technique (alternatively fluorescence microscopy using Apotome technique) to define single layers of cells.
- Off-line analyses are taken out by the use of ImageJ Software.
- Select your cell of interest by using a selection tool.
- Convert image to 8-bit (Image < Type < 8-bit).
- Reduce unspecific noise by using the "despeckle" function (Process < Noise < Despeckle).
- Use the convolution filter to highlight mitochondrial structures (Process < Filters < Convolve).
- Adjust the threshold so that the signal-to-noise ratio is appropriate (Image < Adjust < Threshold).
- By using the "analyze particles" option, the automatic identification of mitochondrial structures is initiated based on a chosen pixel size (Analyze < Analyze Particles). Several mitochondrial parameters are subsequently calculated such as area, perimeter, minor and major axes or circularity. These measurements can be set individually (Analyze < Set Measurements). Save the given result list as an Excel spreadsheet.
- Open result file in Excel program. With use of such parameters, analyses of mitochondrial morphology can be carried out. This includes the definition of the form factor indicating the degree of branching of a mitochondrial network [formula: (perimeter2)/(4*PI()*area)] as well as the aspect ratio defining the length of mitochondria (formula: major axes / minor axes).
5. Measurement of Mitochondrio-lysosomal Colocalization in Living Human Fibroblasts
- 24-48 hr after seeding, incubate cells in 200 nM Mitotracker Green FM and 100 nM Lyostracker Red DND-99 in RPMI medium (without phenol red) protected from light for 15 min at 37 °C and 5% CO2. 1.6 μM of Hoechst staining is used to highlight nuclei.
- Replace the medium with fresh RMPI medium (without phenol red) containing 100 nM Lyostracker Red DND-99. This dye has to be present during the entire imaging session. Do not wash the cells after incubation period. Immediately image the cells. Use 63x magnification and confocal technique (alternatively Apotome technique) to define single layers of cells.
- Off-line analyses are taken out by the use of ImageJ Software.
- Open the two respective images you would like to analyze in terms of colocalization status.
- Convert image to 8-bit (Image < Type < 8-bit).
- Reduce unspecific noise by using the "despeckle" function in both images (Process < Noise < Despeckle).
- Choose the plugin "JACoP" as colocalization analyzing tool, which gives you values for the respective channels and calculates the Pearson's coefficient, overlap coefficient and Manders' coefficient (Plugins < JACoP).
6. Representative Results
Mitochondrial function in living human fibroblasts can be evaluated via live cell imaging technique. For functional assays, the TMRE fluorescence signal correlates with the mitochondrial membrane potential (MMP). Under normal MMP conditions, the TMRE fluorescence is significantly higher (Figure 1A, upper row) than under pathological conditions characterized by a reduced MMP (Figure 1A, lower row). This fluorescence intensity is measured by calculating the average of the mean gray value of every mitochondrial structure (Figure 1B). The fluorescence intensity can be measured via ImageJ software. Here, the use of the option "interactive surface plot" allows for the illustration of different peak intensities (Figure 1A, right side).
Next to the assessment of mitochondrial function in human fibroblasts, live cell imaging microscopy can be used to define different parameters of mitochondrial morphology. By using the Mitotracker Green FM dye mitochondrial structures are visualized independent of their respective MMP (Figure 2). This is important to ensure the inclusion of all mitochondrial structures present into the analyses. Using ImageJ Software, the morphology is analyzed on the basis of binary figures, as only here mitochondrial morphology parameters can be assessed (Figure 2, "binary"). Examples for mitochondrial morphology analyses in terms of form factor as well as aspect ratio were recently published 6, 13. Another important feature that can be measured in living human fibroblasts is the degradation of mitochondrial structures. The first step in this progress can be assessed by mitochondrio-lysosomal colocalization in live cell imaging microscopy. Certain pathological conditions result in an increased colocalization of mitochondria with lysosomes (Figure 3A). Again, Mitotracker Green FM is used to stain mitochondrial structures independent of their respective MMP. In addition, staining with Lysotracker Red DND-99 allows visualizing lysosomal structures. It is critical that the Lysotracker Red dye is present during the imaging process, as washing steps reduce the signal that becomes too low for visualization. Colocalization is represented by clear yellow fluorescence signals due to the overlap of the green (Mitotracker Green FM) and red (Lysotracker Red DND-99) staining (white arrows, Figure 3A) and are determined by calculation of the Pearson coefficient (Figure 3B).
In general, for off-line analyses with ImageJ software, it is helpful to visualize one cell per image, so that the definition of a specific region of interest (ROI) can be avoided.
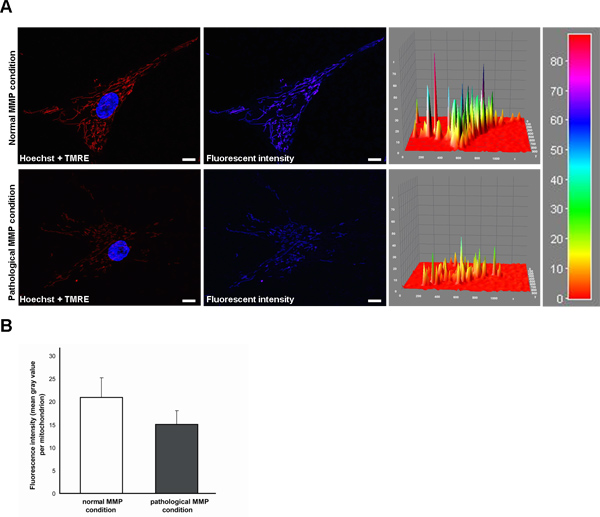
Figure 1. Measurement of the TMRE fluorescence signal indicating the mitochondrial membrane potential (MMP) in living human fibroblasts by live cell imaging technique. (A) TMRE is a fluorescent MMP-dependent dye, whose fluorescence intensity correlates with the MMP. Hoechst dye was used to stain nuclei (blue). Under normal MMP conditions (upper row), the TMRE fluorescence is significantly higher than under pathological conditions characterized by a reduced MMP (lower row). Fluorescence intensity is additionally shown as intensity surface plot. Scale bar indicates 10 μm. (B) Statistical analyses of the exemplary fibroblasts shown in (A). Under pathological conditions, a decreased TMRE fluorescence of mitochondria is measured compared to the normal MMP condition. Click here to view larger figure.

Figure 2. Measurement of the mitochondrial morphology in living human fibroblasts by live cell imaging technique. Mitotracker Green FM (green) is used to visualize mitochondrial structures, for that it is independent of the MMP. Hoechst dye was used to stain nuclei (blue). Using ImageJ Software, the morphology can be analyzed on binary figures. Scale bar indicates 10 μm. Click here to view larger figure.
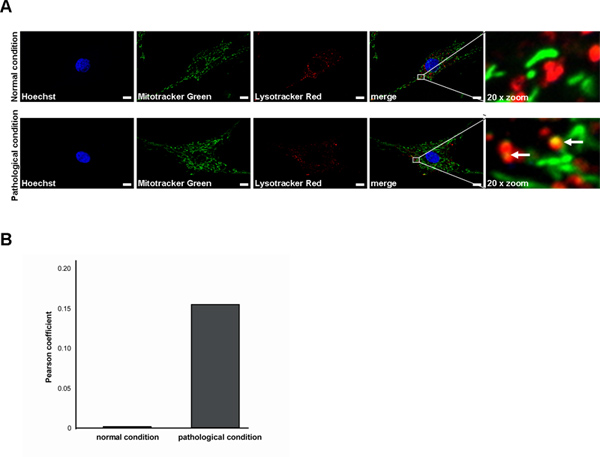
Figure 3. Measurement of the colocalization of mitochondria with lysosomes in living human fibroblasts by live cell imaging technique. (A) Mitotracker Green FM (green) is used to stain mitochondrial structures, Lyostracker Red DND-99 (red) visualizes lysosomal structures. Hoechst dye was used to stain nuclei (blue). Successful colocalization under pathological conditions is indicated by a yellow signal due to overlap of Lysotracker Red and Mitotracker Green staining (white arrows). Scale bar indicates 10 μm. (B) Statistical analyses of the exemplary fibroblasts shown in (A). A higher degree of mitochondrio-lysosomal colocalization results in an elevated Pearson coefficient value. Click here to view larger figure.
Access restricted. Please log in or start a trial to view this content.
Discussion
Patient skin fibroblasts as ex vivo models represent an important tool to characterize disease-associated genetic defects. In addition, skin-derived fibroblasts are easily accessible and can be expanded upon culturing. Therefore, primary cells obtained from patients carrying PD-associated genetic mutations are preferable over the use of tumor cell lines as they contain not only the endogenous disease-causing gene, but the whole genetic background of the affected individual. Moreover, the fibroblasts have ...
Access restricted. Please log in or start a trial to view this content.
Disclosures
No conflicts of interest declared.
Acknowledgements
This work was supported by grants from the Fritz Thyssen Foundation (10.11.2.153 to R.K.), the German Research Council (DFG, KR2119/3-2 and KR2119/8-1 to R.K.), the Federal Ministry for Education and Research (BMBF, NGFNplus; 01GS08134 to R.K.) and by a doctoral scholarship from the charitable Hertie Foundation [to L.F.B]. We thank Carolin Obermaier and Julia Westermeier for their support during the video shoot.
Access restricted. Please log in or start a trial to view this content.
Materials
| Name | Company | Catalog Number | Comments |
|---|---|---|---|
| Roswell Park Memorial Institute (RPMI) 1640 medium | Invitrogen | 52400-025 | |
| RPMI 1640 medium, no Phenol Red | Invitrogen | 11835-063 | |
| Dulbecco's Phosphate-Buffered Saline (DPBS) | Invitrogen | 14190-094 | |
| Fibroblast growth factor 2 (FGF2) | PeproTech | 100-18B | |
| AccuMax (detachment solution) | PAA | L11-008 | |
| Lab-TekTMII chambered coverglasses | Nalge Nunc International | 115382 | |
| Tetramethylrodamine ethyl ester (TMRE) | Invitrogen | T-669 | |
| Mitotracker Green FM | Invitrogen | M-7514 | |
| Mitotracker CM-H2XRos | Invitrogen | M-7513 | |
| Lyostracker Red DND-99 | Invitrogen | L-7528 | |
| H–chst 33342 | Invitrogen | H-3570 | |
Table 1. Specific reagents and equipment. |
References
- de Rijk, M. C., Launer, L. J., Berger, K., Breteler, M. M., Dartigues, J. F., Baldereschi, M., Fratiglioni, L., Lobo, A., Martinez-Lage, J., Trenkwalder, C. Prevalence of Parkinson's disease in Europe: A collaborative study of population-based cohorts. Neurologic Diseases in the Elderly Research Group. Neurology. 54, 21-23 (2000).
- Dorsey, E. R., Constantinescu, R., Thompson, J. P., Biglan, K. M., Holloway, R. G., Kieburtz, K., Marshall, F. J., Ravina, B. M., Schifitto, G., Siderowf, A. Projected number of people with Parkinson disease in the most populous nations. Neurology. 68, 384-386 (2005).
- Spillantini, M. G., Schmidt, M. L., Lee, V. M., Trojanowski, J. Q., Jakes, R., Goedert, M. Alpha-synuclein in Lewy bodies. Nature. 388, 839-840 (1997).
- Chung, K. K., Zhang, Y., Lim, K. L., Tanaka, Y., Huang, H., Gao, J., Ross, C. A., Dawson, V. L., Dawson, T. M. Parkin ubiquitinates the alpha-synuclein-interacting protein, synphilin-1: implications for Lewy-body formation in Parkinson disease. Nature. 7, 1144-1150 (2001).
- Kruger, R., Eberhardt, O., Riess, O., Schulz, J. B. Parkinson's disease: one biochemical pathway to fit all genes. Trends Mol. Med. 8, 236-240 (2002).
- Krebiehl, G., Ruckerbauer, S., Burbulla, L. F., Kieper, N., Maurer, B., Waak, J., Wolburg, H., Gizatullina, Z., Gellerich, F. N., Woitalla, D. Reduced basal autophagy and impaired mitochondrial dynamics due to loss of Parkinson's disease-associated protein DJ-1. PLoS One. 5, e9367(2010).
- Exner, N., Treske, B., Paquet, D., Holmstrom, K., Schiesling, C., Gispert, S., Carballo-Carbajal, I., Berg, D., Hoepken, H. H., Gasser, T. Loss-of-function of human PINK1 results in mitochondrial pathology and can be rescued by parkin. J. Neurosci. 27, 12413-12418 (2007).
- Burbulla, L. F., Krebiehl, G., Kruger, R. Balance is the challenge--the impact of mitochondrial dynamics in Parkinson's disease. European journal of clinical investigation. 40, 1048-1060 (2010).
- Strauss, K. M., Martins, L. M., Plun-Favreau, H., Marx, F. P., Kautzmann, S., Berg, D., Gasser, T., Wszolek, Z., Muller, T., Bornemann, A. Loss of function mutations in the gene encoding Omi/HtrA2 in Parkinson's disease. Human molecular genetics. 14, 2099-2111 (2005).
- Narendra, D., Tanaka, A., Suen, D. F., Youle, R. J. Parkin is recruited selectively to impaired mitochondria and promotes their autophagy. The Journal of cell biology. 183, 795-803 (2008).
- Dagda, R. K., Cherra, S. J. 3rd, Kulich, S. M., Tandon, A., Park, D., Chu, C. T. Loss of PINK1 function promotes mitophagy through effects on oxidative stress and mitochondrial fission. The Journal of biological chemistry. , 284-13843 (2009).
- Kieper, N., Holmstrom, K. M., Ciceri, D., Fiesel, F. C., Wolburg, H., Ziviani, E., Whitworth, A. J., Martins, L. M., Kahle, P. J., Kruger, R. Modulation of mitochondrial function and morphology by interaction of Omi/HtrA2 with the mitochondrial fusion factor OPA1. Experimental cell research. 316, 1213-1224 (2010).
- Burbulla, L. F., Schelling, C., Kato, H., Rapaport, D., Woitalla, D., Schiesling, C., Schulte, C., Sharma, M., Illig, T., Bauer, P. Dissecting the role of the mitochondrial chaperone mortalin in Parkinson's disease: functional impact of disease-related variants on mitochondrial homeostasis. Human molecular genetics. 19, 4437-4452 (2010).
- Takahashi, K., Tanabe, K., Ohnuki, M., Narita, M., Ichisaka, T., Tomoda, K., Yamanaka, S. Induction of pluripotent stem cells from adult human fibroblasts by defined factors. Cell. 131, 861-872 (2007).
- Nguyen, H. N., Byers, B., Cord, B., Shcheglovitov, A., Byrne, J., Gujar, P., Kee, K., Schule, B., Dolmetsch, R. E., Langston, W. LRRK2 mutant iPSC-derived DA neurons demonstrate increased susceptibility to oxidative stress. Cell Stem Cell. 8, 267-280 (2011).
- Seibler, P., Graziotto, J., Jeong, H., Simunovic, F., Klein, C., Krainc, D. Mitochondrial Parkin recruitment is impaired in neurons derived from mutant PINK1 induced pluripotent stem cells. The Journal of neuroscience : the official journal of the Society for Neuroscience. 31, 5970-5976 (2011).
Access restricted. Please log in or start a trial to view this content.
Reprints and Permissions
