A novel method involving quantitative analysis of FRET (Förster Resonance Energy Transfer) signals is described for studying enzyme kinetics. KM and kcat were obtained for the hydrolysis of the catalytic domain of SENP1 (SUMO/Sentrin specific protease 1) to pre-SUMO1 (Small Ubiquitin-like MOdifier). The general principles of this quantitative-FRET-based protease kinetic study can be applied to other proteases.
A subscription to JoVE is required to view this content. Sign in or start your free trial.
Method Article
Quantitative FRET (Förster Resonance Energy Transfer) Analysis for SENP1 Protease Kinetics Determination
In This Article
Summary
Abstract
Reversible posttranslational modifications of proteins with ubiquitin or ubiquitin-like proteins (Ubls) are widely used to dynamically regulate protein activity and have diverse roles in many biological processes. For example, SUMO covalently modifies a large number or proteins with important roles in many cellular processes, including cell-cycle regulation, cell survival and death, DNA damage response, and stress response 1-5. SENP, as SUMO-specific protease, functions as an endopeptidase in the maturation of SUMO precursors or as an isopeptidase to remove SUMO from its target proteins and refresh the SUMOylation cycle 1,3,6,7.
The catalytic efficiency or specificity of an enzyme is best characterized by the ratio of the kinetic constants, kcat/KM. In several studies, the kinetic parameters of SUMO-SENP pairs have been determined by various methods, including polyacrylamide gel-based western-blot, radioactive-labeled substrate, fluorescent compound or protein labeled substrate 8-13. However, the polyacrylamide-gel-based techniques, which used the "native" proteins but are laborious and technically demanding, that do not readily lend themselves to detailed quantitative analysis. The obtained kcat/KM from studies using tetrapeptides or proteins with an ACC (7-amino-4-carbamoylmetylcoumarin) or AMC (7-amino-4-methylcoumarin) fluorophore were either up to two orders of magnitude lower than the natural substrates or cannot clearly differentiate the iso- and endopeptidase activities of SENPs.
Recently, FRET-based protease assays were used to study the deubiquitinating enzymes (DUBs) or SENPs with the FRET pair of cyan fluorescent protein (CFP) and yellow fluorescent protein (YFP) 9,10,14,15. The ratio of acceptor emission to donor emission was used as the quantitative parameter for FRET signal monitor for protease activity determination. However, this method ignored signal cross-contaminations at the acceptor and donor emission wavelengths by acceptor and donor self-fluorescence and thus was not accurate.
We developed a novel highly sensitive and quantitative FRET-based protease assay for determining the kinetic parameters of pre-SUMO1 maturation by SENP1. An engineered FRET pair CyPet and YPet with significantly improved FRET efficiency and fluorescence quantum yield, were used to generate the CyPet-(pre-SUMO1)-YPet substrate 16. We differentiated and quantified absolute fluorescence signals contributed by the donor and acceptor and FRET at the acceptor and emission wavelengths, respectively. The value of kcat/KM was obtained as (3.2 ± 0.55) x107 M-1s-1 of SENP1 toward pre-SUMO1, which is in agreement with general enzymatic kinetic parameters. Therefore, this methodology is valid and can be used as a general approach to characterize other proteases as well.
Protocol
1. Plasmid Constructs
- Amplify the open reading frames of the genes by PCR, and clone the PCR products into PCRII-TOPO vector.
- Confirm the products by sequencing, and clone the cDNA encoding CyPet-(pre-SUMO1)-YPet, CyPet-SUMO1, YPet and catalytic domains of SENP1 into the pET28 (b) vector with an N-terminal hexahistidine tag.
2. Protein Expression and Purification
- Transform Escherichia coli cells of strain BL21 (DE3) with pET28 (b) vectors encoding CyPet-(pre-SUMO1)-YPet, CyPet-SUMO1, YPet and the catalytic domains of SENP1.
- Grown the transformed bacteria in 2xYT medium for 3 hr at 37 °C (shaking at 250 rpm) to reach an optical density of 0.5 at 600 nm.
- Add 100 μM isopropyl-β-D-thiogalactoside (IPTG) (final concentration) to induce protein expression and shake for 16 hr at 25 °C at 200 rpm.
- Harvest the bacteria by centrifugation at 10,000 rpm at 4 °C for 5 min and resuspend them in a buffer of 20 mM Tris-HCl (pH 7.4), 50 mM NaCl, and 5 mM imidazole.
- Sonicate the cells for 10 min in 5-sec intervals at a power setting of 25 W using MiSonics 4,000 sonicator and collect them by centrifugation at 35,000 x g at 4 °C for 30 min.
- Set up the column with 500 ml Ni-NTA beads for 1 L culture and transfer the supernatant into the column.
- Wash the resin with buffer of 20 mM Tris-HCl (pH 7.4), 500 mM NaCl, and 10 mM imidazole twice.
- Elute protein with buffer of 20 mM Tris-HCl (pH 7.4), 500 mM NaCl, and 500 mM imidazole and dialysis into a buffer of 20 mM Tris-HCl (pH 7.4), 50 mM NaCl and 1 mM dithiothreitol (DTT) at 4 °C overnight.
- Determine the concentrations of the purified proteins by the Bradford assay. Alternative method for protein concentration measurements will be SDS-PAGE gel electrophoresis and then stained with Coomassie blue followed with imaging quantitative.
3. Quantitative FRET Spectrum Analysis
- The general strategy for the assay was based on FRET signaling (Figure 1). The FRET pair, CyPet and YPet, was tagged to the N- and C-termini, respectively, of pre-SUMO1. SENP1 cleaves the fusion protein CyPet-(pre-SUMO1)-YPet at the Gly-Gly site in SUMO1's C-terminus and, thus, releases the SUMO tail with YPet. The FRET signal is disrupted, resulting in an increase of the emission from CyPet and a dramatic decrease of YPet's emission at the CyPet excitation wavelength.
- When excited by light of wavelength 414 nm, the total fluorescence emission of CyPet-(pre-SUMO1)-YPet at 530 nm can be derived from three sources: the absolute FRET-induced YPet's emission, CyPet direct emission and YPet direct emission (Figure 2).

where FL530/414 is the total fluorescence emission at 530 nm when excited at 414 nm, FLFRET is the absolute FRET signal, FLCyPet(cont) is the CyPet direct emission when excited at 414 nm, and FLYPet (cont) is the YPet direct emission when excited at 414 nm. The subscript of (cont) stands for contribution.
- The direct emission of CyPet at 530 nm was proportional to its emission at 475 nm when excited at 414 nm with a constant ratio of α. CyPet-SUMO1 was prepared at concentrations of 50, 100, 200, 500, and 750 nM and 1 mM, and emissions at 475 and 530 nm were measured after excitation at 414 nm to determine α (Figure 3-1).
- The direct emission of YPet at 530 nm under excitation at 414 nm was proportional to its emission at 530 nm when excited at 475 nm with a constant ratio of β. YPet was prepared at concentrations of 50, 100, 200, 500, 750 and 1,000 nM, and the emission at 530 nm was measured when the samples were excited by wavelengths of 414 and 475 nm to determine β (Figure 3-2).
- When CyPet-(pre-SUMO1)-YPet was digested by SENP1, the cleavage released CyPet-SUMO1 and the SUMO1 tail with YPet. When the compound was excited at 414 nm, the fluorescence emission at 530 nm (FL'530/414) was decreased but can still be divided into three parts as:

where FL'530/414 is the total fluorescence emission at 530 nm after digestion when excited at 414 nm, FL'FRET is the remaining absolute FRET signal, FL'CyPet(475/414)is the CyPet emission at 475 nm after digestion when excited at 414 nm (here the CyPet emission is from two parts: undigested CyPet-(pre-SUMO1)-YPet and digested CyPet-SUMO1), and FLYPet (530/475) is the YPet emission when excited at 475 nm, which is constant whether CyPet-(pre-SUMO1)-YPet is digested or not.
- After digestion by SENP1, the remaining FRET emission (FL'FRET) is:

where C is the total concentration of CyPet-(pre-SUMO1)-YPet and x is the concentration of digested CyPet-(pre-SUMO1)-YPet.
- By combining all of the items, the detected fluorescence emission at 530 nm under excitation of 414 nm (FL'530/414) is:

4. FRET-based Protease Assay for Enzyme Kinetic Study
- CyPet-(pre-SUMO1)-YPet was incubated with the catalytic domain of SENP1 at 37 °C in a buffer of 20 mM Tris-HCl (pH 7.4), 50 mM NaCl, 0.1% (v/v) Tween-20 and 1 mM DTT to a total volume of 80 ml and transferred into 384-well plate.
- Runs were conducted by measuring the fluorescence emission at 475 and 530 nm after an excitation at 414 nm in a fluorescence multiwell plate reader for 5 min with 15-sec intervals.
- The reaction rate (v) was correlated with the change in the amount of substrate (S) as:
![Reaction rate formula; enzyme kinetics equation; v = -d[S]/dt = d[P]/dt; chemical process.](/files/ftp_upload/4430/4430eq5.jpg "figure-protocol-5")
- The concentration of product increased exponentially from 0 as [S]0 (original substrate concentration) when t=0:
![Chemical kinetics formula, [P]=[S]₀(1-e⁻ᵏᵗ), reaction rate expression, equation.](/files/ftp_upload/4430/4430eq6.jpg "figure-protocol-6")
- When t=0, the original velocity (V0) is:
![Enzyme kinetics equation V0=d[P]/dt=k[S]0, depicting reaction rate in biochemical analysis.](/files/ftp_upload/4430/4430eq7.jpg "figure-protocol-7")
- The concentration of SENP1 was fixed, and the concentration of CyPet-(pre-SUMO1)-YPet was increased from 100 times more than the concentration of enzyme, which is required by Michaelis-Menten equation.
- All of the fluorescent readings were analyzed by the quantitative FRET analysis method and plotted in GraphPad Prism V Software to fit the Michaelis-Menten equation. The nonlinear regression can also be performed with the aid of more common software packages like spreadsheet programs (such as Microsoft Excel).
5. Representative Results
Maturation of pre-SUMO1 by SENP1 can be determined by monitoring the changes in the fluorescence signal at 475 and 530 nm during the process. The result showed that the velocity of pre-SUMO1 digestion by SENP1 in a substrate-dose dependent manner (Figure 4). This suggests that the catalytic domain of SENP1 exhibits excellent activity for pre-SUMO1's maturation. The initial reaction velocities were calculated by the above analysis with different substrate concentrations (Table 1).
The kcat/KM ratio is generally used to compare the efficiencies of different enzymes with one substrate or a particular enzyme with different substrates. KM and Vmax can be obtained from the Michaelis-Menten equation by plotting the various initial velocities, corresponding to the different concentrations of CyPet-(pre-SUMO1)-YPet (Figure 5). kcat was obtained as:
![Catalytic efficiency equation \(k_{cat}=\frac{V_{max}}{[E]}\); formula for enzyme kinetics.](/files/ftp_upload/4430/4430eq8.jpg "figure-protocol-8")
According to the above analysis, the calculated KM was 0.21 ± 0.04 μM, the kcat was 6.90 ± 0.28 s-1, and the kcat/KM ratio was (3.2 ± 0.55) x107 M-1s-1.
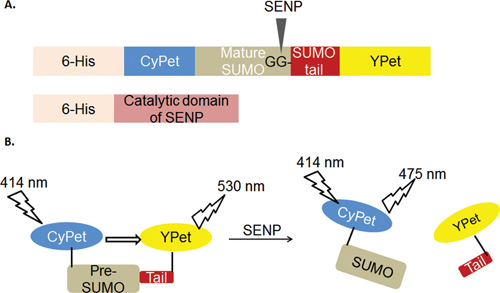
Figure 1. Graph of FRET-based protease assay for SENP's pre-SUMOs maturation.
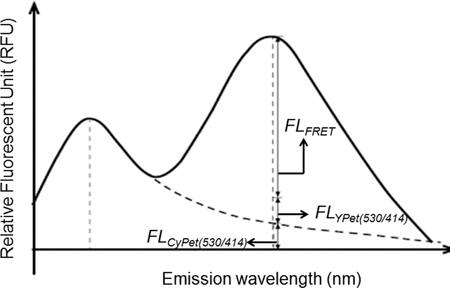
Figure 2. Quantitative analysis of fluorescent signal as contributions by the donor, acceptor and FRET. Dissection of emission spectra from CyPet-(pre-SUMO1)-YPet under excitation at 414 nm. FLCyPet(530/414) is CyPet's emission at 530 nm under excitation of 414 nm, FLFRET is the FRET-induced YPet emission at 530 nm under excitation of 414 nm, and FLYPet(530/414) is YPet's emission at 530 nm under excitation of 414 nm.
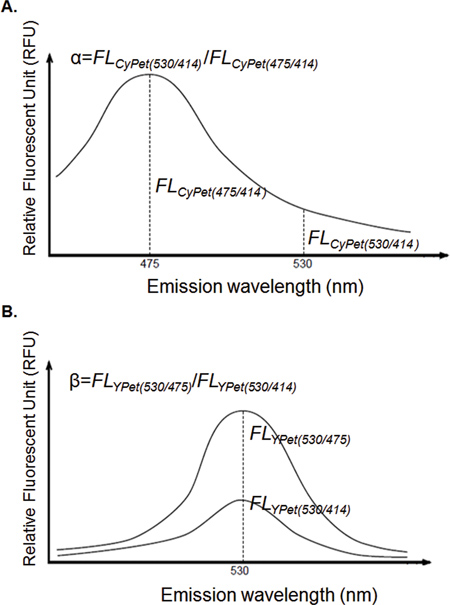
Figure 3. Calculation of direction emission factor α and β.
![Quantitative FRET analysis graph; digested substrate vs. time for substrate concentrations [S1-S8].](/files/ftp_upload/4430/4430fig4.jpg "figure-protocol-12")
Figure 4. Quantitative analysis of CyPet-(pre-SUMO1)-YPet digested by different ratios of the catalytic domain of SENP1. Reactions were monitored within the first 5 min.
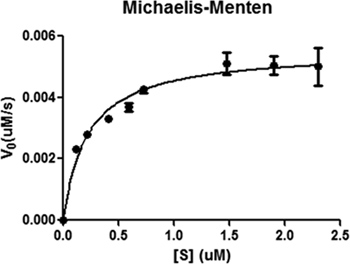
Figure 5. Michaelis-Menten graphical analysis of CyPet-(pre-SUMO1)-YPet's digestion by SENP1. Data were plotted and analyzed by GraphPad Prism V and nonlinear regression.
| [S](μM) | V0(μM/s) |
| 0.115 | 0.0023±0.00005 |
| 0.214 | 0.0028±0.00004 |
| 0.407 | 0.0033±0.00007 |
| 0.594 | 0.0037±0.00013 |
| 0.725 | 0.0043±0.00012 |
| 1.471 | 0.0051±0.00036 |
| 1.899 | 0.0050±0.00031 |
| 2.300 | 0.0050±0.00062 |
Table 1. Initial velocities determination of pre-SUMO1's maturation by SENP1. In each substrate concentration, four samples were used to measure the digestion. The standard deviation came from the variations of these four samples.
| KM(μM) | kcat(s-1) | kcat/kM(M-1•s-1) |
| 0.21±0.04 | 6.90±0.28 | 3.2±0.55×10⁷ |
Table 2. Kinetic parameters of pre-SUMO1's maturation by SENP1 by quantitative FRET analysis. The standard deviation came from the four samples in each substrate concentration.
Access restricted. Please log in or start a trial to view this content.
Discussion
FRET technology has been used to study pre-SUMO1's maturation by SENP19. CFP-YFP was used as the FRET pair and ratiometric analysis, which is the ratio of acceptor to donor emissions, was used to characterize the kinetic properties. However, there is no consideration of donor and acceptor self-fluorescence in the traditional ratiometric FRET analysis. The ratio does not directly correlate with the amount of digested substrate.
Here we report a developed highly sensitive FRET-based p...
Access restricted. Please log in or start a trial to view this content.
Disclosures
No conflicts of interest declared.
Acknowledgements
We are very grateful to Victor G.J. Rodgers for valuable advice. We thank all of the members of the Liao group for very close collaborative work and for help with this study. This study was supported by the National Institutes of Health (Grant AI076504 to J.L.).
Access restricted. Please log in or start a trial to view this content.
Materials
| Name | Company | Catalog Number | Comments |
|---|---|---|---|
| PCR II TOPO Kit | Invitrogen | K466040 | |
| 2xYT | Research Products Internationa.l Corp. | X15600 | |
| Ni-NTA Agrose | Thermo Scientific | 88222 | |
| Coomassie plus (Bradford) Assay Regent | Thermo Scientific | 23238 | |
| 384-well plate (glass bottom) | Greiner | 781892 | |
| FlexStation II 384 plate reader | Molecular Device |
References
- Johnson, E. S. Protein modification By SUMO. Annual Review of Biochemistry. 73, 355-382 (2004).
- Gill, G. SUMO and ubiquitin in the nucleus: different functions, similar mechanisms. Genes & Development. 18, 2046-2059 (2004).
- Hay, R. T. SUMO: a history of modification. Molecular Cell. 18, 1-12 (2005).
- Müller, S., Hoege, C., Pyrowolakis, G., Jentsch, S. SUMO, ubiquitin's mysterious cousin. Nature. , 202-210 (2001).
- Hochstrasser, M. SP-RING for SUMO: new functions bloom for a ubiquitin-like protein. Cell. , 5-8 (2001).
- Drag, M., Salvesen, G. S. DeSUMOylating enzymes-SENPs. IUBMB Life. 60, 734-742 (2008).
- Mukhopadhyay, D., Dasso, M. Modification in reverse: the SUMO proteases. Trends in Biochemical Sciences. 32, 286-295 (2007).
- Reverter, D., Lima, C. D. Structural basis for SENP2 protease interactions with SUMO precursors and conjugated substrates. Nature Structural & Molecular Biology. 13, 1060-1068 (2006).
- Shen, L., et al. SUMO protease SENP1 induces isomerization of the scissile peptide bond. Nature Structural & Molecular Biology. 13, 1069-1077 (2006).
- Horton, R., Strachan, E., Vogel, K., Riddle, S. A substrate for deubiquitinating enzymes based on time-resolved fluorescence resonance energy transfer between terbium and yellow fluorescent protein. Analytical Biochemistry. 360, 138-143 (2007).
- Mikolajczyk, J., et al. Small Ubiquitin-related Modifier (SUMO)-specific Proteases: PROFILING THE SPECIFICITIES AND ACTIVITIES OF HUMAN SENPs. Journal of Biological Chemistry. 282, 26217-26224 (2007).
- Kolli, N., Mikolajczyk, J., Drag, M., Mukhopadhyay, D., Moffatt, N., Dasso, M., Salvesen, G., Wilkinson, K. D. Distrubition and paralogue specificity of mammalian deSUMOylating enzymes. Biochem. J. , 335-344 (2010).
- Drag, M., Mikolajczyk, J., Krishnakumar, I. M., Huang, Z., Salvesen, G. S. Activity profiling of human deSUMOylating enzymes (SENPs) with synthetic substrates suggests an unexpected specificity of two newly characterized members of the family. Biochemical Journal. 409, 461(2008).
- Engels, I. H., et al. A time-resolved fluorescence resonance energy transfer-based assay for DEN1 peptidase activity. Analytical Biochemistry. 390, 85-87 (2009).
- Martin, S., Hattersley, N., Samuel, I., Hay, R., Tatham, M. A fluorescence-resonance-energy-transfer-based protease activity assay and its use to monitor paralog-specific small ubiquitin-like modifier processing. Analytical Biochemistry. 363, 83-90 (2007).
- Nguyen, A. W., Daugherty, P. S. Evolutionary optimization of fluorescent proteins for intracellular FRET. Nature Biotechnology. 23, 355-360 (2005).
Access restricted. Please log in or start a trial to view this content.
Reprints and Permissions
