A method to prepare epitaxial layers of ordered alloys by sputtering is described. The B2-ordered FeRh compound is used as an example, as it displays a metamagnetic transition that depends sensitively on the degree of chemical order and the exact composition of the alloy.
Method Article
Sputter Growth and Characterization of Metamagnetic B2-ordered FeRh Epilayers
Opens in a new tab
In This Article
Summary
Loading...
$$\rightleftharpoonup{xx}$$
$$\longleftharp{xx}$$,
$$\longrightharp{xx}$$,
Abstract
Loading...
$$\rightleftharpoonup{xx}$$
$$\longleftharp{xx}$$,
$$\longrightharp{xx}$$,
Chemically ordered alloys are useful in a variety of magnetic nanotechnologies. They are most conveniently prepared at an industrial scale using sputtering techniques. Here we describe a method for preparing epitaxial thin films of B2-ordered FeRh by sputter deposition onto single crystal MgO substrates. Deposition at a slow rate onto a heated substrate allows time for the adatoms to both settle into a lattice with a well-defined epitaxial relationship with the substrate and also to find their proper places in the Fe and Rh sublattices of the B2 structure. The structure is conveniently characterized with X-ray reflectometry and diffraction and can be visualised directly using transmission electron micrograph cross-sections. B2-ordered FeRh exhibits an unusual metamagnetic phase transition: the ground state is antiferromagnetic but the alloy transforms into a ferromagnet on heating with a typical transition temperature of about 380 K. This is accompanied by a 1% volume expansion of the unit cell: isotropic in bulk, but laterally clamped in an epilayer. The presence of the antiferromagnetic ground state and the associated first order phase transition is very sensitive to the correct equiatomic stoichiometry and proper B2 ordering, and so is a convenient means to demonstrate the quality of the layers that can be deposited with this approach. We also give some examples of the various techniques by which the change in phase can be detected.
Introduction
Loading...
$$\rightleftharpoonup{xx}$$
$$\longleftharp{xx}$$,
$$\longrightharp{xx}$$,
The central paradigm of the microelectronics industry is the method of planar processing: the sequential deposition and patterning of thin films on the surface of a wafer of substrate material. Very often, the substrate is a single crystal, and the films need to be epitaxial, that is to say in crystal register with the underlying substrate. With semiconductor materials, this is typically achieved either using molecular beam epitaxy (MBE) in a laboratory setting1 or metalorganic vapor phase epitaxy (MOVPE) in manufacturing2.
Whilst the epitaxial growth of metals by MBE is possible, they are easily deposited by sputtering, and this is the most common method for the deposition of thin magnetic films in both research and industrial settings. Whilst this method is commonly associated with the growth of polycrystalline films, epitaxial growth on a single crystal substrate is possible under certain conditions3. These generally include a raised substrate temperature (at least for the initial layers), a slow deposition rate, and a low vacuum chamber base pressure. This approach has been used to prepare giant magnetoresistance multilayer materials4, 5, for instance.
In our own laboratory, we have used epitaxial sputtering to prepare a variety of magnetic materials on single crystal substrates. It has been possible to grow CoFe alloy epilayers on GaAs(001), for instance, by selecting the lattice-matched Co70Fe30 composition6. This material is a solid solution, where the Co and Fe atoms randomly populate the bcc lattice sites. We have also grown chemically ordered magnetic alloys, where the different atomic species are required to take up particular lattice sites. The growth protocol we shall describe here was initially developed for the growth of L10-ordered FePd and FePt alloys, which are of interest since they possess a very high magnetocrystalline anisotropy7. We have studied the relationship between ballistic and diffusive spin-polarized transport8, 9 and the anomalous Hall effect10 in these materials, which are of comparable quality to layers grown by MBE11.
Here we will illustrate our epitaxial growth method using the example of B2-ordered FeRh epilayers. Fe and Rh will form alloys at any composition, however a B2-ordered compound is the equilibrium state for stoichiometries in the near-equiatomic range 49-53% atomic Fe12. This so-called α”-phase is an antiferromagnet (AF) that exhibits a first-order phase transition on heating, becoming an α'-phase ferromagnet (FM) around TT = 350→400K13, 14, 15. This metamagnetic transition between the two different but both fully ordered magnetic states (type II AF 16 and FM) is accompanied by an isotropic 1% volume expansion in the B2 lattice17, 18, a large entropy release19, a large drop in the resistivity14, and a large increase in the carrier concentration20. Neutron diffraction21, 16 and more recently XMCD measurements22 indicate that part of the 3.3 μB magnetic moment centered on the Fe in the AF phase is transferred to the Rh in the FM phase, with μFe ~2.2 μB and μRh ~0.6 μB. The Curie temperature for the FM α' phase is ~670 K14, comparable to the Curie temperature of alloys with x>0.5323. The metamagnetic transition temperature TT is highly sensitive to the composition × in Fe×Rh1-×23, 24, and is suppressed by ~8 K/T of applied magnetic field25, 15. This rich array of physical behavior depends critically on achieving the proper B2-ordered structure and so permits a wide variety of measurement techniques to be deployed to detect proper chemical ordering in a specimen, making it a convenient example to demonstrate a method of growing high-quality ordered alloy epilayers.
Protocol
Loading...
$$\rightleftharpoonup{xx}$$
$$\longleftharp{xx}$$,
$$\longrightharp{xx}$$,
In this protocol, thin films of the ordered FeRh alloy are made with dc-magnetron sputtering on MgO (001) substrates. The samples are grown in a magnetic field of about 200 Oe provided by a permanent magnet array, which is used to set an in-plane magnetic anisotropy. The target diameter is 50 mm and the distance between the target and substrates is about 10 cm. To grow FeRh, a dc-magnetic Torus magnetron gun suitable for magnetic materials is used. The heaters are bulbs positioned 2 cm above the substrates and surrounded by a metal cylinder to keep the heated volume small. The maximum temperature possible in this system is ~1,050 K. This system is capable of holding 24 different substrates; however, we typically grow fewer than 10 when making epitaxial samples due to time constraints. The details presented here for this sample preparation protocol are known to work well in our vacuum system. As there are many equivalent vacuum systems that differ in their details, the requirements for the quantitative parameters such as temperature, time, etc. may well take different optimal values in other systems. Nevertheless, the description below will prove a useful guide to the reader.
In the detailed protocol below, it is assumed that the reader is familiar with the basics of good vacuum practice, such as the use of gloves to handle all components that will enter the vacuum chamber [see, for instance, reference 26].
1. Substrate and Target Preparation
This section describes the preparation of the sputter deposition chamber and the single crystal MgO substrates.
- Rinse the (001) MgO substrates in isopropanol and mount them in the substrate holders. Load these into the vacuum chamber.
- Mount the FeRh target in the magnetron gun and reassemble the gun. For a sample with an equiatomic composition, we have found that a target with Fe47Rh53 is most suitable, yielding the clearest magnetostructural phase transition. Test that there is no short circuit between the magnetron and the surrounding shield. Similarly, prepare any target(s) to be used for capping layers.
- Close the vacuum chamber and pump it down.
- Once the vacuum is better than 1 x 10⁻⁶ Torr, heat the substrates to 870 K. Monitor the vacuum level and heating rate to ensure that the pressure does not rise above this level. Hold at this temperature overnight.
- One hour before commencing growth, begin to flow liquid nitrogen through the Meissner trap. The vacuum should improve to better than 4 x 10⁻⁷ Torr.
- Set the mass flow controller to 65 sccm of working gas flow. The sputter gas is Ar with 4% hydrogen to avoid sample oxidation during growth. Open the gas flow valve. The pressure in the chamber should rise to the low mTorr range.
- Before the growth, pre-sputter the FeRh target for 1,200 sec at 30 W.
2. Epilayer Deposition
This section describes the deposition of the FeRh layer by dc-magnetron sputtering.
- Adjust the set point of the mass flow controller to give a chamber pressure of 4 x 10⁻³ Torr. Allow the pressure to settle to a stable value.
- Check that the substrate temperature remains at 870 K and is stable.
- Apply power to the magnetron to yield an overall deposition rate of 0.4 Å/sec. In chambers equipped with a quartz crystal monitor, this can be done using that monitor, if suitably calibrated. If the chamber does not have a quartz crystal monitor, post-growth thickness measurements can be helpful, as well as a high level of reproducibility between runs.
- Open the shutter and deposit FeRh on the heated substrate for a length of time suitable to give the desired thickness. For instance, a 500 sec deposition will yield a sample 20 nm thick.
- Close the shutter.
- Shut off power to the magnetron.
- Close the gas valve.
- Increase the sample temperature to 970 K. Hold the samples at this temperature for one hour. The pressure should remain better than 1 x 10⁻⁶ Torr throughout. The effects of varying this anneal temperature can be found in de Vries et al.20
- Shut off heater power and cool the samples to room temperature. In this system, this takes at least three hours.
- Deposit any capping layer required, using steps similar to steps 2.1-2.7. Depositing the capping layer at a temperature below ~370 K is essential to prevent interdiffusion into the FeRh layer27.
- Vent the chamber with dry nitrogen, open it, and remove the samples. They should appear bright and shiny.
3. Routine Post-growth Characterization
This section provides an overview of the basic characterization steps carried out on the majority of our FeRh samples. As there are many possible equivalent methods for making these measurements, the nature of the descriptions here are less detailed and prescriptive, and rather concentrate on the essential features of any such measurements.
- Perform a low angle Χ-ray reflectivity scan to determine the sample thickness. Mount the sample in the diffractometer and align it in ω with the detector angle 2θ ≈ 1°. If available, χ should also be aligned. Run a standard θ-2θ scan with θ running from 0° until the noise floor of the instrument is reached, typically once θ≥6° for a good quality sample. Clear Kiessig (thin-film interference) fringes should be visible, from which the epilayer thickness can be determined.
- Perform a high-angle Χ-ray diffraction scan to determine the degree of chemical order. This can be carried out with the sample still mounted in the diffractometer from step 3.1. The MgO substrate peak should be found (at 2θ = 42.9° if Cu Kα radiation is used) and the sample aligned again in ω. Again, run a θ-2θ, covering at least the range 12.5°<θ<62.5° (again assuming Cu Kα radiation) so that both the FeRh (001) and (002) peaks, as well as the substrate peak, are captured.
- Perform a measurement of the temperature dependence of the sample resistivity to determine the transition temperature. Make electrical contacts to the sample such that a standard 4-point measurement can be made to avoid contact resistance problems. If a dc method is being used, make measurements for forward and reverse current directions and the resistances averaged in order to null off any thermal e.m.f. generated at elevated temperatures. Then place the sample on a temperature controlled hot stage (in this set-up the stage is in a small turbo-pumped high vacuum chamber to be sure of avoiding any oxidation), and measure the resistance as a function of temperature on both heating and cooling sweeps so that any hysteresis in the first order magnetostructural phase transition can be determined.
Results
Loading...
$$\rightleftharpoonup{xx}$$
$$\longleftharp{xx}$$,
$$\longrightharp{xx}$$,
We have prepared many FeRh samples according to this protocol. In this section we show typical results obtained using the most common characterization procedures for a selection of representative samples. Results such as these are expected for samples in the thickness range 20-50 nm. Other methods we have used to characterize our material in more depth include X-ray magnetic circular dichroism28, grazing incidence X-ray scattering29, and polarized neutron reflectometry30. We have also studied the effects of doping the alloy with Au27. Further data on the properties that can be expected from this material can be found in those reports, and the references contained therein.
The structure of one of our epilayers is shown in detail in the transmission electron micrographs shown in Figure 1. The sample cross-section was prepared by the conventional dimpling and ion polishing technique- a standard specimen preparation method (see, for instance Williams and Carter31)- and observed using a 200 kV electron beam. The overall layer structure can be seen in Figure 1(a). In this case, a 30 nm FeRh film was epitaxially grown onto an MgO substrate, followed by a ~4 nm Cr layer and a ~1 nm thick Al layer. (The Cr layer was included here for a particular experiment and is not needed in general). The roughness of the FeRh/MgO and FeRh/Cr interfaces are 0.6 nm and 2.8 nm, respectively, as measured from the image. In Figure 1(b) a high resolution micrograph of the MgO/FeRh interface is shown. The epitaxial relationship as confirmed from selected area diffraction is FeRh[100](001)||MgO[110](001). The lattice matching across the interface demonstrates the high quality of the epitaxial growth. We do not show the data here but have used energy dispersive X-ray spectroscopy in the TEM to check the composition on a selection of samples: it has always been equiatomic to within the uncertainty of the measurement.
Χ-ray reflectometry data are shown in Figure 2 for a nominally 25 nm thick FeRh epilayer capped with a thin, polycrystalline layer of Al. The measurement was performed in a standard two-circle diffractometer in the Bragg-Brentano geometry, using Cu Kα radiation (λ = 0.1541 nm), with a Ni filter to attenuate the Kα radiation. The pronounced Kiessig fringes, which arise from the interference of X-ray beams that reflect from the various interfaces in the layer stack, indicate that those interfaces are smooth and well-correlated. The solid red line shows a fit to the data that has been performed using the GenX software32. The best fit parameters for the multilayer structure are shown in Table 1. The fact that a portion of the Al layer will have oxidized and self-passivated once the sample is exposed to the air is accounted for in the model.
Χ-ray diffraction data for the same sample are shown in Figure 3, collected on the same instrument. The (002) reflection of the MgO substrate is strong and sharp enough to just resolve the Cu Kα1and Kα2 lines. The FeRh layers shows both (001) and (002) reflections. There is some broadening due to the finite thickness of the epilayer and strain gradients. The (002) FeRh B2 peak is centered at 2θ = 61.3°±0.02, yielding an average out-of-plane lattice constant of 3.02±0.05 Å. It is possible to determine the chemical order parameter S of the FeRh B2 structure from the relative integrated intensities of these two peaks. This quantity is defined as S = rFe+rRh -1, where is the fraction of Fe(Rh) sites occupied by Fe(Rh) atoms33. A brief inspection of the formula shows that when rFe = rRh = 1 and the structure is perfect, S = 1, whereas when rFe = rRh = 0.5, so that all the lattice sites are randomly occupied, S = 0. The reason is that when S = 0 the site-averaged structure is bcc, for which the structure factor forbids the (001) reflection, whereas when S = 1 the structure is primitive cubic, for which the (001) reflection is allowed. This means that in practical terms,  , where
  and
and  are the experimental and theoretical intensities of the (00I) Bragg reflection, respectively33. For the calculation of the theoretical intensities the Debye-Waller factors from EXAFS measurements on FeRh were used34. In this case, S = 0.855±0.001, typical for a sputtered thin film of this material.
The metamagnetic phase transition can be detected in several ways. Its presence indicates the correct equiatomic stoichiometry and B2-ordering of the lattice. The lattice expansion that accompanies the metamagnetic transition may be detected by the shift in the position of the Bragg peaks27; however, this requires a diffractometer with a heater stage.
Perhaps the most obvious method is to detect the appearance of the ferromagnetic moment as the sample is heated through TT. This can be done using any temperature dependent magnetometer with sufficient sensitivity, for instance using the magneto-optical Kerr effect or a vibrating sample magnetometer. In Figure 4 we show the temperature dependence of the magnetization M, measured using a superconducting quantum interference device (SQUID) magnetometer. Measurements were made in the temperature range of 275-400 K with a temperature sweep rate of 2 K/min. The curve shown displays the anticipated AF → FM transition (heating) and FM → AF transition (cooling) with a 15 K thermal hysteresis. This measurement was made at high field (50 kOe) and yielded a transition temperature TT ≈ 365 K. The transition temperature is field-dependent, as a higher magnetic field reduces the free energy of the FM phase with respect to the AF phase. Typically dTT/dH ≈ 0.8 mK/Oe14,15, 27. Note that the magnetic moment in the AF phase is not quite zero, but is a few tens of emu/cm3 when averaged over the volume of the entire sample. This moment resides in the near-interface regions of the FeRh epilayer, which remain ferromagnetic (albeit with a reduced magnetization) when the bulk of the sample transforms into the AF phase28, 30.
A way to detect the transition that uses simpler equipment and is often used in our laboratory is to make an electron transport measurement. The simplest measurement is of the resistivity ρ of the film, since ρ in the FM phase is much less than in the AF phase35, 36, 20. The temperature dependence of ρ for the same 25 nm FeRh epilayer for which X-ray data were shown is plotted in Figure 5, measured using a standard four-point probe method: spring-loaded, gold-plated pins were pressed on to the sample surface to make contact to the sample, which was mounted on a heater stage in a small custom vacuum chamber to prevent any sample oxidation when hot. A linear, metallic ρ(T) dependence is seen in both the AF and FM phases, but there is a marked drop in resistivity between the two. The hysteresis seen in Figure 5 is a clear fingerprint of the magnetostructural phase transition taking place and is a convenient method to measure the transition temperature, which is given by the minimum point in dρ/dT (shown in the inset of Figure 5). Another easily measured transport property, the Hall effect, can also be used to confirm the presence of the transition, as there is a large difference in the Hall coefficient between the two phases20.

Figure 1. Transmission electron micrographs of an FeRh epilayer on an MgO substrate. (a) Image demonstrating the structure of the layer. The FeRh is 30 nm thick with a further ~4 nm Cr layer and ~1 nm Al cap deposited on top. The amorphous region at the top of the image is an epoxy resin used during cross-section sample preparation. (b) A high resolution image of the MgO FeRh interface. The epitaxial matching across the interface is seen here, and the associated relationship, as confirmed from selected area diffraction, is FeRh[100](001)||MgO[110](001). Click here to view larger figure
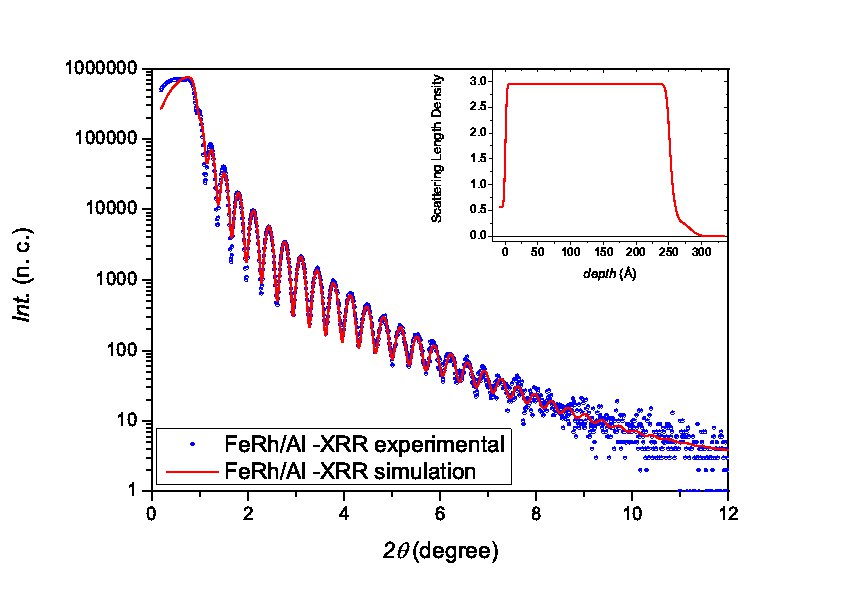
Figure 2. X-ray reflectometry spectrum from a 25 nm thick FeRh epilayer capped with polycrystalline Al. The solid line is a fit as described in the text, using the parameters given in Table 1. The inset shows the scattering length density profile associated with that set of fitting parameters. Click here to view larger figure
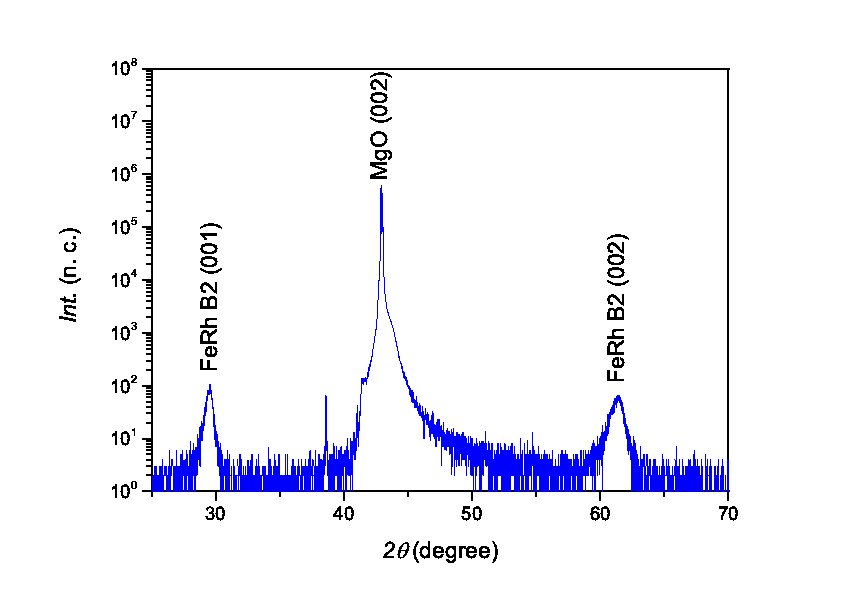
Figure 3. X-ray diffraction spectrum from a 25 nm thick FeRh epilayer capped with polycrystalline Al. The presence of the (001) FeRh peak indicates that B2 ordering has taken place. The chemical order parameter is S = 0.855±0.001, as determined using the method described in the text. Click here to view larger figure
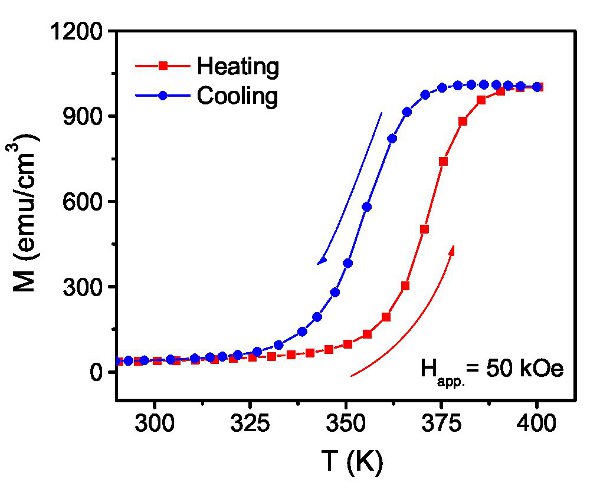
Figure 4. Temperature dependence of magnetization M of a 50 nm thick FeRh epilayer capped with polycrystalline Al. These data were taken with a 50 kOe field applied in the film plane. The transition temperature TT is seen to be ~365 K with a hysteresis width of about 15 K. Click here to view larger figure
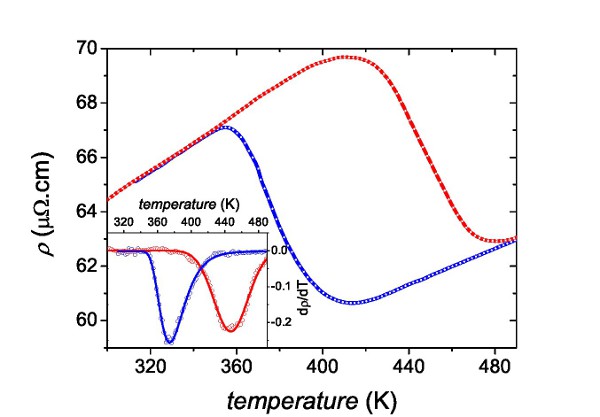
Figure 5. Temperature dependence of the resistivity ρ of a 25 nm thick FeRh layer capped with Al. Inset is the derivative of ρ with respect to temperature T. The transition temperature TT is seen to be 447 K on warming into the FM phase and 375 K on cooling into the AF phase. Click here to view larger figure
| Layer | Density (atoms/nm3) | Thickness (nm) | Roughness (nm) |
| Al2O3 passivation layer | 25.5±0.9 | 2.18±0.08 | 1.0±0.1 |
| Al cap | 60.6±0.6 | 0.91±0.02 | 0.6±0.2 |
| FeRh epilayer | 38.7±0.3 | 25.09±0.06 | 0.400±0.002 |
| MgO substrate | 53.4±1.3 | ∞ | 0.1761±0.0003 |
Table 1. Fitting parameters for the X-ray reflectivity spectrum shown in Figure 2, leading to the scattering length density profile shown in the inset of that Figure.
Discussion
Loading...
$$\rightleftharpoonup{xx}$$
$$\longleftharp{xx}$$,
$$\longrightharp{xx}$$,
Here we have demonstrated that this method can be used to prepare epilayer samples of FeRh of good crystallographic quality and a high degree of B2 chemical ordering. The method is suited to the preparation of a wide variety of epitaxial metallic layers, including ordered alloys. Whilst we have used the B2-ordered FeRh alloy as an example here, as it shows a dramatic phase transition when the stoichiometry is correct and chemical ordering is present, this method can also be used for other materials. For instance, both FePd and FePt have L10 phases, which leads to a very strong uniaxial magnetocrystalline anisotropy. We have successfully grown this material in the past, showing domain wall resistance in FePt8, and large anomalous Hall effects in both FePd and FePt10. With an appropriate adjustment of growth temperatures and rates and a suitable choice of substrate, this method ought to be useful for preparing a wide variety of different magnetic and non-magnetic metal epilayers displaying chemical order.
Nevertheless, a limitation of this approach is the need for a single crystal substrate to achieve epitaxy. This means difficulties will be encountered in performing experiments such as plan-view transmission electron or X-ray microscopy or integration into a technology built on another substrate wafer such as the near-ubiquitous Si. A possible means to get around this problem is to grow a thin MgO layer on which the FeRh can then be deposited. This can yield out-of-plane texture that nucleates local epitaxial growth on top of each MgO grain37. Remarkably, it is possible to grow a thin MgO layer that has both (001) texture and in-plane crystallographic alignment on an amorphous surface using a method with an ion-beam assist gun that is oriented at 45° to the substrate normal 38. This could permit growth of B2-ordered FeRh on e.g. electron or X-ray transparent Si3N4 membranes, which are capable of surviving the high growth temperatures required in our protocol, or on the native oxide layer of a Si wafer.
Further refinements of the method include the use of B2-ordered underlayers, such as NiAl39, to promote B2-ordering in the FeRh epilayer when it is ultrathin, or its use to build heterostructures involving multiple chemically-ordered layers37. Since FeRh can be doped on the Rh site to adjust the transition temperature TT up (for example using Ir40, 41 or Pt40, 42) or down (e.g. using Au40, 27 or Pd40, 43), the creation of doping profiles in FeRh layers can lead to designed-in magnetic profiles as the sample is heated and cooled. This opens up a route to generating purely magnetic stratification of an epilayer in a controllable way44.
Disclosures
Loading...
$$\rightleftharpoonup{xx}$$
$$\longleftharp{xx}$$,
$$\longrightharp{xx}$$,
The authors declare that they have no competing financial interests.
Acknowledgements
Loading...
$$\rightleftharpoonup{xx}$$
$$\longleftharp{xx}$$,
$$\longrightharp{xx}$$,
This work was supported by the UK Engineering and Physical Sciences Research Council under grant number EP/G065640/1 and by the US National Science Foundation under grant number DMR-0908767 [M.L. and L.H.L.] and grant number DMR-0907007 [D.H.].
Materials
| Name | Company | Catalog Number | Comments |
|---|---|---|---|
| Sputter Deposition System | Kurt J. Lesker Company | Bespoke | |
| MgO Single Crystal Substrate | Pi-Kem | Single-sided epi-polished | (001) orientation |
| FeRh sputtering target | Pi-Kem | Bespoke | 50 mm diameter |
| Transmission Electron Microscope | FEI | Tecnai TF20 | |
| X-ray Diffractometer | Brüker | D8 Discover | |
| SQUID Magnetometer | Quantum Design | MPMS-XL 5 |
References
Loading...
$$\rightleftharpoonup{xx}$$
$$\longleftharp{xx}$$,
$$\longrightharp{xx}$$,
- Cho, A. Y., Arthur, J. R. Molecular beam epitaxy. Progress in Solid State Chemistry. 10 (Part 3), 157(1975).
- Stringfellow, G. B. Organometallic Vapor-Phase Epitaxy: Theory and Practice. , Academic Press. San Diego. (1998).
- Harp, G. R., Parkin, S. S. P. Epitaxial growth of metals by sputter deposition. Thin Solid Films. (1-2), 288-281 (1996).
- Conover, M. J., Fullerton, E. E., Mattson, J. E., Sowers, C. H., Bader, S. D. Giant magetoresistance in epitaxial sputtered Fe/Cr(211) superlattices (abstract). Journal of Appied Physics. 75 (211), 7080-7080 (1994).
- Kuch, W., Marley, A. C., Parkin, S. S. P. Seeded epitaxy of Co90Fe10/Cu multilayers on MgO(001): Influence of Fe seed layer thickness. Journal of Applied Physics. 83 (001), 4709-4713 (1998).
- Hindmarch, A. T., Arena, D. A., Dempsey, K. J., Henini, M., Marrows, C. H. Influence of deposition field on the magnetic anisotropy in epitaxial Co70Fe30 films on GaAs(001). Physical Review B. 81, 100407(2010).
- Weller, D., et al. High Ku materials approach to 100 Gbits/in2. IEEE Transactions on Magnetics. 36 (1), 1015(2000).
- Seemann, K. M., Baltz, V., MacKenzie, M., Chapman, J. N., Hickey, B. J., Marrows, C. H. Diffusive and ballistic current spin polarization in magnetron-sputtered L10-ordered epitaxial FePt. Physical Review B. 76, 174435(2007).
- Seemann, K. M., Hickey, M. C., Baltz, V., Hickey, B. J., Marrows, C. H. Spin-dependent scattering and the spin polarization of a diffusive current in partly disordered L10 epitaxial FePd. New Journal of Physics. 12 (3), 033033(2010).
- Seemann, K. M., et al. Spin-orbit strength driven crossover between intrinsic and extrinsic mechanisms of the anomalous hall effect in the epitaxial L10-ordered ferromagnets FePd and FePt. Physical Review Letters. , 104-076402 (2010).
- Marrows, C. H., Dalton, B. C. Spin mixing and spin-current asymmetry measured by domain wall magnetoresistance. Physical Review Letters. 92, 097206(2004).
- Swartzendruber, L. J. The Fe-Rh (iron-rhodium) system. Bulletin of Alloy Phase Diagrams. 5, 456-462 (1984).
- Fallot, M. Les alliages du fer avec les métaux de la famille du platine. Annals of Physics. 10, 291(1938).
- Kouvel, J. S. Unusual nature of the abrupt magnetic transition in FeRh and its pseudobinary variants. Journal of Applied Physics. 37, 1257(1966).
- Maat, S., Thiele, J. -U., Fullerton, E. E. Temperature and field hysteresis of the antiferromagnetic-to-ferromagnetic phase transition in epitaxial FeRh films. Physical Review B. 72, 214432(2005).
- Shirane, G., Nathans, R., Chen, C. W. Magnetic moments and unpaired spin densities in the Fe-Rh alloys. Physical Review. 134, A1547(1964).
- Muldawer, L., de Bergevin, F. Antiferromagnetic-ferromagnetic transitio in FeRh. Journal of Chemical Physics. 35, 1904(1904).
- Zakharov, A. I., Kadomtseva, A. M., Levitin, R. Z., Ponyatovskii, eg Magnetic and magnetoelastic properties of a metamagnetic Fe-Rh alloy. Journal of Experimental and Theoretical Physics (USSR). 46, 1348(1964).
- Annaorazov, M. P., Nikitin, S. A., Tyurin, A. L., Asatryan, K. A., Dovletov Kh, A. Anomalously high entropy change in FeRh alloy. Journal of Applied Physics. 79 (3), 1689(1996).
- de Vries, M. A., Loving, M., Mihai, A. P., Lewis, L. H., Heiman, D., Marrows, C. H. Hall effect characterisation of electronic transition behind the metamagnetic transition in FeRh. New Journal of Physics. 15, 013008(2013).
- Bertaut, E. F., Delapalme, A., Forrat, F., Roult, G. Magnetic structure work at the nuclear centre in Grenoble. Journal of Applied Physics. 33 (3), 1123(1962).
- Stamm, C., et al. Antiferromagnetic-ferromagnetic phase transition in FeRh probed by X-ray magnetic circular dichroism. Physical Review B. 77, 184401(2008).
- Shirane, G., Chen, C. W., Flinn, P. A., Nathans, R. Mössbauer study of hyperfine fields and isomer shifts in the Fe-Rh alloys. Physical Review. 131, 183(1963).
- van Driel, J., Coehoorn, R., Strijkers, G. J., Bruck, E., de Boer, F. R. Compositional dependence of the giant magnetoresistance in FexRh1-x thin films. Journal of Applied Physics. 85, 1026(1999).
- Baranov, N. V., Barabanova, E. A. Electrical resistivity and magnetic phase transitions in modified FeRh compounds. Journal of Alloys and Compounds. 219, (1995).
- Varian Associates. Basic Vacuum Practice. , 3rd edition, Varian Associates Inc. (1992).
- Loving, M., et al. Tailoring the FeRh magnetostructural response with Au diffusion. Journal of Applied Physics. 112, 043512(2012).
- Ding, Y., et al. Bulk and near-surface magnetic properties of FeRh thin films. Journal of Applied Physics. 103, 07B515(2008).
- Kim, J. W., et al. Surface influenced magnetostructural transition in FeRh films. Applied Physics Letters. 95, 222515(2009).
- Fan, R., et al. Ferromagnetism at the interfaces of antiferromagnetic FeRh epilayers. Physical Review B. 82, 184418(2010).
- Williams, D. B., Carter, C. B. Transmission Electron Microscopy: A Textbook for Materials Science. , 2nd edition, Springer. Berlin. (2009).
- Björck, M., Andersson, G. GenX: an extensible X-ray reflectivity refinement program utilizing differential evolution. Journal of Applied Crystallography. 40 (6), 1174-1178 (2007).
- Warren, B. E. X-Ray Diffraction. , Addison-Wesley. Reading, Mass. (1969).
- Miyanaga, T., Itoga, T., Okazaki, T., Nitta, K. Local structural change under antiferro- and ferromagnetic transition in FeRh alloy. Journal of Physics: Conference. 190, 012097(2009).
- Kouvel, J. S., Hartelius, C. C. Anomalous magnetic moments and transformations in the ordered alloy FeRh. Journal of Applied Physics. 33, 1343(1962).
- Sharma, M., Aarbogh, H. M., Thiele, J. -U., Maat, S., Fullerton, E. E., Leighton, C. Magnetotransport properties of epitaxial MgO(001)/FeRh films across the antiferromagnet to ferromagnet transition. Journal of Applied Physics. 109, 083913(2011).
- Thiele, J. -U., Maat, S., Fullerton, E. E. FeRh/FePt exchange spring films for thermally assisted magnetic recording media. Applied Physics Letters. 82, 2859(2003).
- Wang, C. P., Do, K. B., Beasley, M. R., Geballe, T. H., Hammond, R. H. Deposition of in-plane textured MgO on amorphous Si3N4substrates by ion-beam-assisted deposition and comparisons with ion-beam-assisted deposited yttria-stabilized-zirconia. Applied Physics Letters. 71, 2955(1997).
- Kande, D., Pisana, S., Weller, D., Laughlin, D. E., Zhu, J. -G. Enhanced B2 ordering of FeRh thin films using B2 NiAl underlayers. IEEE Transactions on Magnetics. 47 (10), 3296(2011).
- Walter, P. H. L. Exchange inversion in ternary modifications of iron rhodium. Journal of Applied Physics. 35 (3), 938(1964).
- Yuasa, S., et al. First-order magnetic phase transition in bcc FeRh-Ir alloy under high pressures up to 6.2 GPa. Journal of the Physical Society of Japan. 63 (3), 855(1994).
- Lu, W., Nam, N. T., Suzuki, T. Effect of Pt doping on the structure, magnetic, and magneto-optical properties of ordered FeRh-Pt thin films. IEEE Transactions on Magnetics. 45 (6), 2716(2009).
- Kushwaha, P., Lakhani, A., Rawat, R., Chaddah, P. Low-temperature study of field-induced antiferromagnetic-ferromagnetic transition in Pd-doped FeRh. Phys Rev. B. 80, 174413(2009).
- Saerbeck, T., et al. Artificially modulated chemical order in thin films: A different approach to create ferro/antiferromagnetic interfaces. Phys. Rev. B. 82, 134409(2010).
Reprints and Permissions
Request permission to reuse the text or figures of this JoVE article
Request Permission