Dual-phase cone-beam computed tomography (DP-CBCT) is a useful intraprocedural imaging technique for transarterial chemo-embolization treatment with drug-eluting beads of hepatocellular carcinoma. DP-CBCT has been used to perform three major steps in oncologic interventional radiology: tumor localization (see), navigation and intraprocedural catheter guidance (reach), and intraprocedural evaluation of treatment success (treat).
Method Article
Dual-phase Cone-beam Computed Tomography to See, Reach, and Treat Hepatocellular Carcinoma during Drug-eluting Beads Transarterial Chemo-embolization
In This Article
Summary
Abstract
The advent of cone-beam computed tomography (CBCT) in the angiography suite has been revolutionary in interventional radiology. CBCT offers 3 dimensional (3D) diagnostic imaging in the interventional suite and can enhance minimally-invasive therapy beyond the limitations of 2D angiography alone. The role of CBCT has been recognized in transarterial chemo-embolization (TACE) treatment of hepatocellular carcinoma (HCC). The recent introduction of a CBCT technique: dual-phase CBCT (DP-CBCT) improves intra-arterial HCC treatment with drug-eluting beads (DEB-TACE). DP-CBCT can be used to localize liver tumors with the diagnostic accuracy of multi-phasic multidetector computed tomography (M-MDCT) and contrast enhanced magnetic resonance imaging (CE-MRI) (See the tumor), to guide intra-arterially guidewire and microcatheter to the desired location for selective therapy (Reach the tumor), and to evaluate treatment success during the procedure (Treat the tumor). The purpose of this manuscript is to illustrate how DP-CBCT is used in DEB-TACE to see, reach, and treat HCC.
Introduction
Image guidance is the backbone of interventional radiology. Two relatively recent capabilities of the X-ray angiography equipment are three-dimensional (3D) rotational angiography, and C-arm cone-beam computed tomography (CBCT). CBCT has enabled the acquisition of 3D volumetric imaging in the angiography suite with the advent of the C-arm, the flat panel detector and the Feldkamp back projection algorithm1,2. These newer image acquisition capabilities have enabled clinicians to perform procedures not feasible with traditional fluoroscopy or digital subtraction angiography alone3-7. Recent improvements in image quality allow the comparison of CBCT images being with diagnostic imaging8,9. Moreover these recent tools can improve accuracy of a growing variety of interventions5,7.
Transarterial chemoembolization (TACE) is a therapeutic option for hepatocellular carcinoma (HCC) per Barcelona Clinic Liver Cancer staging and treatment algorithm10. Intraprocedural imaging directly guides this interventional oncology procedure. The intervention planning is a key step to optimize devices needed for procedure, determination of the best view to reach the tumor(s), potentially improving drug delivery to targeted tumor(s), and theoretically reducing potential complications. Tools for image acquisition, intraprocedural guidance, and therapeutic response assessment have been developed for use during TACE, to optimize TACE. The use of dual-phase CBCT (DP-CBCT) especially during TACE with drug-eluting beads (DEB-TACE) provides more information than traditional fluoroscopy, CBCT without contrast injection, or single phase enhanced CBCT11. Indeed, DP-CBCT is two five-seconds CBCT scans (early arterial and delayed venous phases) done intraprocedurally during one single intra-arterial injection17,21-23. DP-CBCT could be described as an essential tool in the armamentarium of the interventional oncologist to standardize TACE approach on a daily basis.
Firstly, DP-CBCT imaging is highly sensitive and specific for detecting HCC. It compares favorably to the existing gold standard, contrast-enhanced magnetic resonance imaging (CE-MRI) and multiphasic-multidetector computed tomography (M-MDCT)8,9,12. Accurate detection and tumor volume segmentation can be obtained from CBCT images often the delayed venous phase scan unless better visualization is achieved on arterial phase8,13,14. Secondly. DP-CBCT can generate a roadmap for the hyperselective catheterization and identification and embolization of feeding vessels. Recent data demonstrates that hyperselective chemotherapy delivery is associated with lower complications and improved results 15-17. Finally, DP-CBCT provides an intraprocedural predictive assessment of liver tumor (HCC) response after intra-arterial therapy and may augment or predict six-weeks follow-up CE-MRI18. The use of CBCT imaging during TACE has been shown to increase survival19.
The purpose of this manuscript is to describe the use of CBCT to execute the steps of DEB-TACE: seeing, reaching, and treating liver tumors. Modification of the DEB-TACE based upon DP-CBCT information is a common clinical scenario.
Protocol
1. Patient Selection
- Select patient eligible for drug eluding beads loaded with Adriamycin (DEB-TACE) with primary hepatic tumors such as HCC at a multidisciplinary gastro-intestinal oncology team conference and with primary teams (i.e. surgical oncology, radiology, interventional radiology, medical oncology).
- Place the patient into the supine position on the angiography table and sedate him.
- Premedicate the patient to reduce systemic effects of inflammatory response and nausea (Diphenhydramine intravenous (IV), Dexamethasone IV and Ondansetron IV).
- Prepare patient's right groin and drape in the usual sterile fashion.
2. "See" the Tumor
- Catheterization of the common hepatic artery
- Access the right common femoral artery with a micro-puncture needle using Seldinger's technique, insert a sheath and attach to saline flush.
- Catheterize sequentially the superior mesenteric artery (SMA) and the celiac axis with an angiographic catheter.
- Perform an angiogram of the SMA to ensure standard anatomy, lack of replaced hepatic arterial supply and to confirm portal vein patency.
- Perform a celiac artery angiogram to determine anatomy and hepatic arterial blood supply.
- Advance coaxially a microcatheter through the catheter into the right or left hepatic artery depending on tumor location.
- Perform a repeat right or left superselective hepatic arteriogram to confirm the location of the tumor(s).
- Correlate tumor(s) seen on the intraprocedural imaging to preprocedural cross sectional imaging findings (MRI or MDCT).
- Intraprocedural pretreatment Dual Phase cone-beam computed tomography
- Instruct the sedated patient to be at end-expiration apnea during each of the CBCT scans with free breathing between the early arterial and delayed venous phase scans. If necessary, administer oxygen to the patients during the CBCT acquisition to minimize the discomfort of breath holding.
- Coordinate with anesthesiologist for timing and to minimize overlying artifact-inducing equipment.
- Place for each CBCT scan the area of interest (liver) roughly in the system isocenter. Trigger the first scan three seconds after power contrast injection (amount, 18 ml; rate 2 ml/sec; 300 mg/ml) through the catheter in the common hepatic.
- Perform a DP-CBCT: two 5 sec CBCT scans (early arterial and late venous phases) were acquired during a single contrast media injection with a 3 sec delay before the first scan. At the conclusion of the 1st scan, the patient is instructed to breathe 1-2x and then continue to hold breath at end-expiration apnea during the second scan starts.
3. Intervention Planning: Tumor Detection, Tumor Segmentation, 3D Roadmap
- Analyze the two scans (early arterial and late venous phases) automatically codisplayed in the workstation.
- Control the automatic registration and overlay of the two scans and if necessary adjust manually, and validate the two CBCT acquisitions to make them match to each other in all three planes (axial, coronal, and sagittal planes)
- Correlate the targeted tumor(s) defined by CBCT with other preprocedural imaging. Select the prototype software to plan access to the targeted lesions and generate a 3D roadmap to guide device navigation.
- Segment the targeted tumor(s) from where best visualized; often the delayed venous phase scan unless better visualization is achieved on arterial phase. Atypical HCC (hypo-vascular) can also be easily segmented. A few seconds after the DP CBCT is completed, the reconstruction is ready (this rapid reconstruction is enabled by a fiber optic link between the image acquisition and the reconstruction computers).
- Verify the vessel path on CBCT images automatically detected from the early arterial phase CBCT and extracted by the software in sagittal, coronal and axial planes to ensure that the vessel chosen and path mapped do supply the desired tumor(s).
- Overlay and confirm segmented tumor(s) and tumor(s) feeding arteries, and the 3D roadmap on fluoroscopy.
4. Reach the Tumor
- Plan the intervention to target the tumor(s), like internet-based highway maps.
- Use the 3D overlayed roadmap synchronized on live fluoroscopy to C-arm and table movement to catheterize targeted tumor(s) feeding arteries.
- Choose the best C-arm/table position, angle, and magnification that best facilitates catheterization to minimize vessel overlap and foreshortening to easily target tumor(s).
- If needed, adjust the 3D roadmap to better match on the fluoroscopy in case of patient movement to mitigate the need for creating a new roadmap and minimize the need for additional contrast injection and X-ray exposure.
- Reach each tumor(s) feeding artery using the 3D navigation guidance, to minimizing delivery of chemo-embolizing material to healthy tissue and maximizing the selective drug dose to the tumor(s).
5. Treat the Tumor - Measurement of Treatment Success
- Embolize the targeted tumor(s) with drug eluding beads thought the microcatheter to the contrast stasis into the tumor before detection of any backflow.
- Perform a post-TACE DP-CBCT (as described above) to assess the treatment success.
- Assess a defect of contrast enhancement in the target tumor(s) (due to blood vessel embolization) after a DEB-TACE
- In case of minimal decrease of tumor enhancement and/or there is not enhancement defect, look for aberrant vessels feeding the tumor, complete embolization with additional drug eluding beads agent volume or treat extra-hepatic vessels in the same or future TACE session. Perform additional selective CBCT during selective hepatic arteriography within collateralized or parasitized vasculature to define alternate tumor supplies if necessary.
- At the end of the procedure, remove the microcatheter, the catheter, and the sheath and make homeostasis.
Results
The use of intraprocedural C-arm CBCT images allowed acquisition of 3D volume image sets for the 3 major steps of HCC DEB-TACE treatment: see, reach, and treat HCC. CBCT images were obtained with a plat panel detector fixed on a C-arm CT (Figure 1).
We illustrated representative results by a case of a 64 year old man with a unresectable HCC of 8.9 cm located in the segment 7 of liver. First, to see the targeted tumor(s), an intraprocedural pretreatment DPCBCT was performed while the catheter was placed in the selective right hepatic artery, two CBCT scans (early arterial and delayed venous phases), were acquired after a single intra-arterial contrast injection through the microcatheter. The two scans were reconstructed on a workstation less than one minute after the CBCT scans (Figure 2). The registration and the overlay of the two CBCT scans were automatically performed unless a physician decided to manually register, overlay, and validate the two CBCT acquisitions to make them match to each other in three planes (axial, coronal, and sagittal planes) (Figure 3).
The physician defined the target tumor(s) to be treated using preprocedural diagnostic imaging (CE-MRI or M-MDCT) and correlated images to intraprocedural pre-TACE DPCBCT scans. The physician segmented in 3D the target tumor (blue colored spheres) on the venous phase CBCT phase, which best demonstrated the lesions (Figure 4). The feeding arteries (colored lines) were automatically detected and colored by the software (Figure 5).The physician controlled the automatic tumor feeding arteries detection before validating and starting the catheter navigation. Tumor segmentation and tumor feeding arteries were overlayed on real-time fluoroscopy (Figure 6). The physician controlled the automatic detection. The 3D roadmap could specifically display any opacified vessel, which isolated the tumoral vascular supply of all segmented tumor.
As soon as the 3D roadmap was overlayed on the live fluoroscopy (Figure 6), the catheterization of the targeted tumor(s) could have started. If necessary, the 3D roadmap was intraprocedurally adjusted manually in case of patient motion during the procedure. The catheterization was done using a 3D roadmap overlayed on the 2D live fluoroscopy. The operator was able to move the table and the C-arm positions for a better visualization of potential tortuous vessels with 3D roadmap synchronization.
When the microcatheter was located in an appropriate place to treat, the drug-eluding beads agents were injected until stasis was seen on 2D fluoroscopy and before any back flow detection.
After DEB-TACE embolization into the targeted tumor, another DP-CBCT was performed to assess treatment completeness. In this HCC DEB-TACE case, a contrast enhancement defect was detected in the delayed venous phase of the post-TACE DP-CBCT compared to the delayed venous phase of the pre-TACE DP-CBCT (Figure 7).
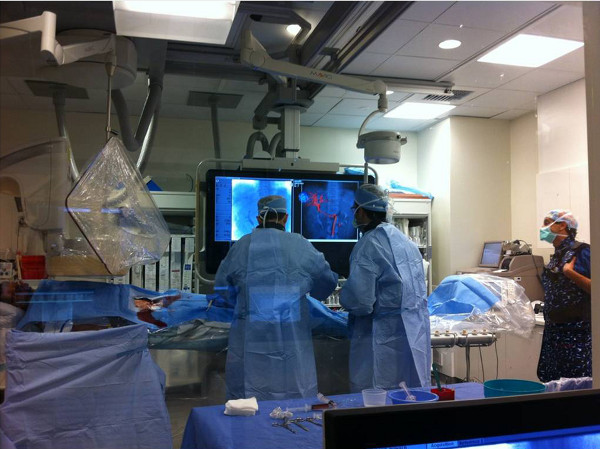
Figure 1. Angiography suite with physicians performing a TACE. The 3D roadmap on the right monitor is being used to guide catheter placement.
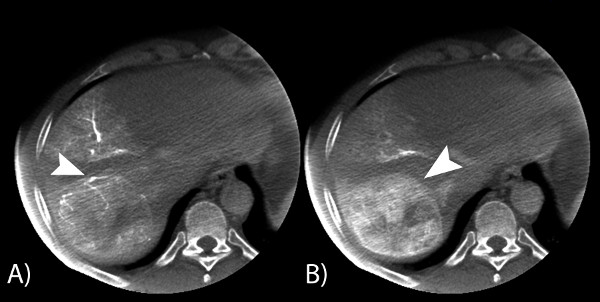
Figure 2. Representative axial images of two phases of one DP-CBCT obtained intraprocedurally, before the embolization. (A) represents the arterial phase and image (B) depicts the venous phase. The first phase shows opacification of the arterial tree of the liver and feeding arteries of the single hepatocellular carcinoma (white arrow) and the second phase shows liver tumor margins (white arrow).
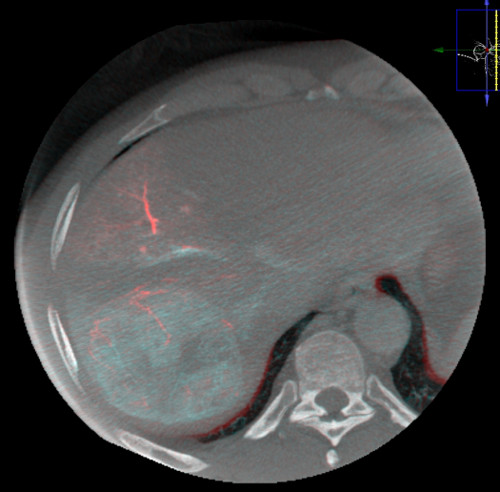
Figure 3. The registration of the two scans can be done in the coronal, sagittal, and axial planes. The red shade represents the primary volume (early phase) and the grey scale image represents the secondary volume (delayed phase) shown in the axial plane. The portal venous phase is not yet well blended or windowed for ideal tumor visualization.
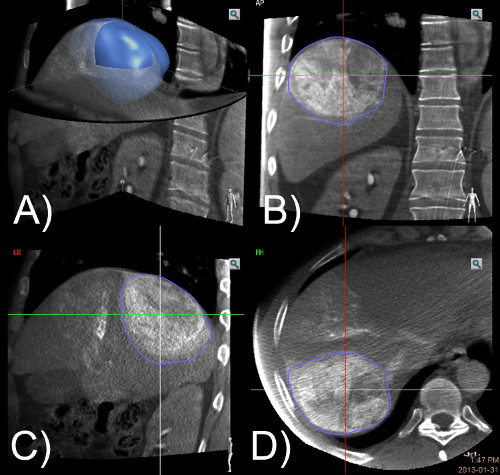
Figure 4. The delayed venous phase CBCT scans is shown on the workstation in three planes and allows for more precise 3D tumor segmentation (A). The tumor volume is represented in blue colored circle in three planes. The segmentation can be done in any of the three axes: coronal (B), sagittal (C), and axial (D).
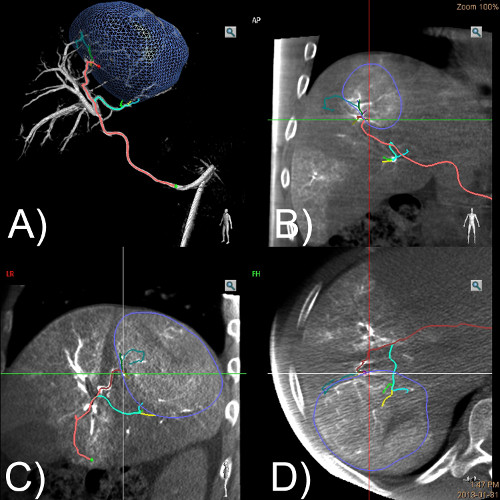
Figure 5. The early arterial phase scan is shown in three planes: coronal (B), sagittal (C), and axial (D). The arterial tree and tumor feeding arteries are visualized on all planes. Feeding arteries may be represented by different color and be shown on all views as above. The segmented tumor is automatically overlayed on all these images. The tumor segmentation and the extracted colored vessels are represented on the first image (A).
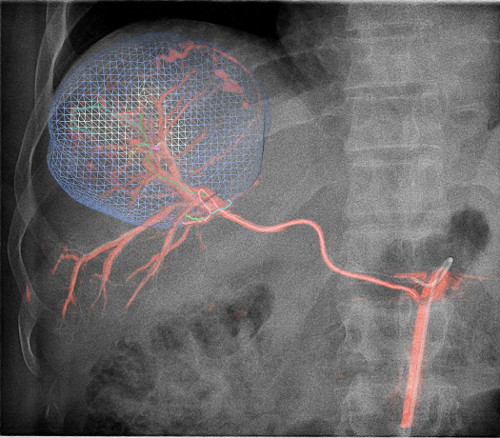
Figure 6. After the overlay is completed on the two data sets, the 3D roadmap is superimposed on the live fluoroscopy. The gray scale background is the fluoroscopy, the red colored overlay is the arterial tree and the blue colored overlay represents the targeted liver tumor. This 3D roadmap is used to reach tumor before the drug delivery. This case shows a target tumor in segment 7 colored in blue. The catheter is in the common hepatic artery and the microcatheter in the segment 7 hepatic artery.
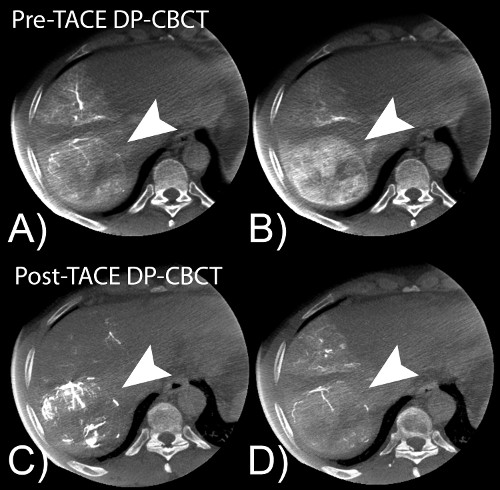
Figure 7. This is an illustration of a case showing the variation of tumor enhancement on DP-CBCT images before and after embolization on the first (A) and second (B) scan phase. No Lipiodol was used.
Discussion
DP-CBCT is a useful tool to facilitate the three main steps in intra-arterial liver therapy: tumor localization (see), navigation planning and intraprocedural guidance for catheterization (reach), and intraprocedural evaluation of treatment goals and success (treat).
Firstly, DP-CBCT is as equally sensitive and specific for detecting HCC as current gold standard imaging techniques including, contrast-enhanced MRI and MDCT8. In addition, tumor segmentation and volume calculations on DP-CBCT are precise and reproducible13. Furthermore, the volume and the spatial localization of target lesions on CBCT and on MRI are strongly correlated13. Most importantly, this information is available during the procedure, when it is most needed.
Secondly, DP-CBCT can be used to generate a navigation "map" in order to reach difficult lesions and improving tumor targeting results in decreased nontarget embolization, increased tumor coverage and preservation of normal hepatic tissue.
Thirdly, the use of DP-CBCT immediately following therapy is predictive of treatment success, and may be used instead of a six weeks MRI or MDCT to assess treatment completeness18.
While respiratory motion can induce misalignment in image registration, the 3D roadmap can be adjusted visually by the operator using the catheter's position on fluoroscopy as a reference. Moreover more significant patient motion can be corrected manually by shifting the 3D roadmap on real-time fluoroscopy using bony landmarks or the catheter as a reference. Visual gating can be performed in this way, waiting for matched respiratory cycles to make catheter manipulations. Patient comfort is essential and an 8 sec breath-hold is needed to avoid significant motion artifact and significant image quality degradation. If necessary, oxygen can be administered to the patient during the acquisition to minimize the discomfort of breath holding.
The limitations of the CBCT include imaging artifacts and X-ray exposure. CBCT images present artifacts due to multiple sources such as noise, scatter, partial volume effects, beam hardening, ringing, and motion. Several algorithms have been developed to reduce noise during reconstruction, modify the X-ray spectrum or to reduce motion artifacts20-26. The direct impact of these artifacts during the DEB-TACE has not been, described to the author's knowledge. CBCT X-ray exposure is generally less than MDCT of similar protocol. In cases of diffuse liver disease, embolization can be performed from a proximal location. A 3D roadmap may not be necessary in those instances. Then, MDCT or MRI preprocedural images can be used to generate a 3D roadmap for proper hepatic artery catheterization. An intraprocedural DP-CBCT post therapy can still be used to predict treatment success when drug eluding beads are used
DP-CBCT is a useful tool in interventional oncology which can be used to standardize DEB-TACE procedures. DP-CBCT provides information that improves the three major steps of TACE procedures: see, reach and treat liver tumor.
Disclosures
M. Lin, A. Radaelli, B. Carelsen, and N. Noordhoek: Philips employee. J.F. Geschwind: Financial activities related to the present article: Philips Healthcare. Financial activities not related to the present article: J.F. Geschwind is a paid consultant for Biocompatibles, Bayer Healthcare, Guerbet, Nordion, Merit, Abbott, and Jennerex; institution has grants or grants pending from Biocompatibles, Genentech, Bayer Healthcare, Nordion, Context Vision, and CeloNova. BJW has a cooperative research and development agreement with Philips Healthcare and Biocompatibles, and is supported by NIH Intramural Research Program and NIH Grant Z1A BC-011242-04. The other authors have disclosed no relevant financial relationships.
Open access fees supported by Philips Healthcare
Acknowledgements
The authors wish to acknowledge the financial support of NIH/NCI R01 CA160771, P30 CA006973, Philips Research North America, Briarcliff Manor, NY, USA and the French Society of Radiology (SFR).
Materials
| Name | Company | Catalog Number | Comments |
|---|---|---|---|
| Angiographic system (Allura Xper FD20) | Philips Healthcare, Best, The Netherlands | Angiographic system made of a C-arm computed tomography (CBCT) and a flat panel detector | |
| Workstation (XtraVision 8) | Philips Healthcare, Best, The Netherlands | Workstation for CBCT images reconstruction and postprocessing | |
| Contrast agent: Oxilan 300 (Ioxilan) | Guerbet LLC, Bloomington, IN, USA | Contrast agent used for acquiring DP-CBCT images | |
| Sheath | (5Fr) | ||
| Catheter | Terumo Medical, Somerset, NJ, USA | Glide Simmons 1 (5Fr) | |
| Microcatheter | Boston Scientific, Natick, MA, USA | Renegade Hi-Flow (3Fr) | |
| Steerable guidewire | Boston Scientific, Natick, MA, USA | Fathom wire (0.018 in) |
References
- Feldkamp, L. A., Davis, L. C., Kress, J. W. Practical cone-beam algorithm. J. Opt. Soc. Am. 1, (1984).
- Abi-Jaoudeh, N., et al. Multimodality image fusion-guided procedures: technique, accuracy, and applications. Cardiovasc. Intervent. Radiol. 35, 986-998 (2012).
- Mistretta, C. A., Grist, T. M. X-ray digital subtraction angiography to magnetic resonance-digital subtraction angiography using three-dimensional TRICKS. Historical perspective and computer simulations: a review. Invest Radiol. 33, 496-505 (1998).
- Hirota, S., et al. Cone-beam CT with flat-panel-detector digital angiography system: early experience in abdominal interventional procedures. Cardiovasc. Intervent. Radiol. 29, 1034-1038 (2006).
- Wallace, M. J., et al. Three-dimensional C-arm cone-beam CT: applications in the interventional suite. J. Vasc. Interv. Radiol. 20, 523-537 (2009).
- Richter, G., et al. Flat panel detector angiographic CT for stent-assisted coil embolization of broad-based cerebral aneurysms. AJNR Am. J. Neuroradiol. 28, 1902-1908 (2007).
- Racadio, J. M., et al. Live 3D guidance in the interventional radiology suite. Am. J. Roentgenol. 189, 357-364 (2007).
- Loffroy, R., et al. Comparing the detectability of hepatocellular carcinoma by C-arm dual-phase cone-beam computed tomography during hepatic arteriography with conventional contrast-enhanced magnetic resonance imaging. Cardiovasc. Intervent. Radiol. 35, 97-104 (2012).
- Higashihara, H., et al. Diagnostic accuracy of C-arm CT during selective transcatheter angiography for hepatocellular carcinoma: comparison with intravenous contrast-enhanced, biphasic, dynamic MDCT. Eur. Radiol. 22, 872-879 (2012).
- Sunshine, J. H. Utilization of interventional oncology treatments in the United States. J. Vasc. Interv. Radiol. 21, 1054-1060 (2010).
- Lin, M., et al. Evaluating tumors in transcatheter arterial chemoembolization (TACE) using dual-phase cone-beam CT. Minim. Invasive Ther. Allied Technol. 20, 276-281 (2011).
- Miyayama, S., et al. Detection of corona enhancement of hypervascular hepatocellular carcinoma by C-arm dual-phase cone-beam CT during hepatic arteriography. Cardiovasc. Intervent. Radiol. 34, 81-86 (2011).
- Tacher, V., et al. Semi-automatic volumetric tumor segmentation for hepatocellular carcinoma: Comparison between C-arm Cone Beam Computed Tomography and MRI. Acad. Radiol. 20, 446-452 (2013).
- Pellerin, O., et al. Comparison of Semi-automatic Volumetric VX2 Hepatic Tumor Segmentation from Cone Beam CT and Multi-detector CT with Histology in Rabbit Models. Acad Radiol. 20, 115-121 (2013).
- Deschamps, F., et al. Computed Analysis of Three-Dimensional Cone-Beam Computed Tomography Angiography for Determination of Tumor-Feeding Vessels During Chemoembolization of Liver Tumor: A Pilot Study. Cardiovasc. Intervent. Radiol. , (2010).
- Miyayama, S., et al. Usefulness of cone-beam computed tomography during ultraselective transcatheter arterial chemoembolization for small hepatocellular carcinomas that cannot be demonstrated on angiography. Cardiovasc. Intervent. Radiol. 32, 255-264 (2009).
- Takayasu, K., et al. Superselective transarterial chemoembolization for hepatocellular carcinoma. Validation of treatment algorithm proposed by Japanese guidelines. J. Hepatol. 56, 886-892 (2012).
- Loffroy, R., et al. Intra-Procedural C-Arm Dual-Phase Cone Beam CT Imaging to predict Response to Drug-Eluting Beads Transcatheter Arterial Chemoembolization in Patients with Hepatocellular Carcinoma? Radiol. , 266-636 (2013).
- Iwazawa, J., Ohue, S., Hashimoto, N., Muramoto, O., Mitani, T. Survival after C-arm CT-assisted chemoembolization of unresectable hepatocellular carcinoma. Eur. J. rad. , (2012).
- Grass, M., Guillemaud, R., Rasche, V. Tomogr. , ISTE. 287-306 (2010).
- Lin, M., et al. RSNA. , Lakeside Learning Center. (2011).
- Schäfer, D., Ahrens, M., Eshuis, P., Grass, M. International Society for Optical Engineering, , Phys. Med. Imaging. 83132V(2011).
- Schäfer, D., Borgert, J., Rasche, V., Grass, M. Motion-compensated and gated cone beam filtered back-projection for 3-D rotational X-ray angiography. IEEE Trans. Med. Imaging. 25, 898-906 (2006).
- Schäfer, D., et al. Breathing motion compensated reconstruction for C-arm cone beam CT imaging: initial experience based on animal data. Phys. Med. Imaging. , 83131D(2012).
- Rao, P., et al. RSNA 2011. , E353B(2011).
- Tacher, V., et al. Image quality improvements in C-Arm CT (CACT) for liver oncology applications: Preliminary study in rabbits. Minim. Invasive Ther. Allied Technol. , (2013).
Reprints and Permissions
