Polymerization of FtsZ is essential for bacterial cell division. In this report, we detail simple protocols to monitor FtsZ polymerization activity and discuss the influence of buffer composition. The protocols can be used to study the interaction of FtsZ with regulatory proteins or antibacterial drugs that affect FtsZ polymerization.
Method Article
FtsZ Polymerization Assays: Simple Protocols and Considerations
In This Article
Summary
Abstract
During bacterial cell division, the essential protein FtsZ assembles in the middle of the cell to form the so-called Z-ring. FtsZ polymerizes into long filaments in the presence of GTP in vitro, and polymerization is regulated by several accessory proteins. FtsZ polymerization has been extensively studied in vitro using basic methods including light scattering, sedimentation, GTP hydrolysis assays and electron microscopy. Buffer conditions influence both the polymerization properties of FtsZ, and the ability of FtsZ to interact with regulatory proteins. Here, we describe protocols for FtsZ polymerization studies and validate conditions and controls using Escherichia coli and Bacillus subtilis FtsZ as model proteins. A low speed sedimentation assay is introduced that allows the study of the interaction of FtsZ with proteins that bundle or tubulate FtsZ polymers. An improved GTPase assay protocol is described that allows testing of GTP hydrolysis over time using various conditions in a 96-well plate setup, with standardized incubation times that abolish variation in color development in the phosphate detection reaction. The preparation of samples for light scattering studies and electron microscopy is described. Several buffers are used to establish suitable buffer pH and salt concentration for FtsZ polymerization studies. A high concentration of KCl is the best for most of the experiments. Our methods provide a starting point for the in vitro characterization of FtsZ, not only from E. coli and B. subtilis but from any other bacterium. As such, the methods can be used for studies of the interaction of FtsZ with regulatory proteins or the testing of antibacterial drugs which may affect FtsZ polymerization.
Introduction
The essential bacterial protein FtsZ is the best characterized protein of the bacterial cell division machinery. FtsZ is the prokaryotic homolog of tubulin and polymerizes in vitro in a GTP dependent manner. FtsZ is a very attractive target for new antibiotics due to its conserved nature and uniqueness to bacteria1,2. At the beginning of cell division, FtsZ forms a cytokinetic ring at midcell, which serves as a scaffold for the assembly of other cell division proteins. Formation of the Z-ring is crucial for correct localization of the division plane. The assembly dynamics of FtsZ are regulated by several accessory proteins, such as (depending on the bacterial species) MinC, SepF, ZapA, UgtP, and EzrA2. FtsZ polymerization has been intensively studied in vitro and many different structures including straight protofilaments, curved protofilaments, sheets of filaments, bundles of filaments and tubes of filaments have been described depending on the assembly buffer, nucleotide, and additional proteins included in the assay3. The architecture of FtsZ protofilaments in vivo is not yet fully understood, although electron cryotomography experiments in Caulobacter crescentus suggest that the Z-ring is assembled from relatively short, noncontinuous single protofilaments without extensive bundling4.
In vitro, the polymerization properties of FtsZ and the interaction of FtsZ with regulatory proteins are sensitive to the composition of the reaction buffer. For example, we recently described the interaction site for SepF on the FtsZ C-terminus and showed that a FtsZBs∆16 C-terminal truncate no longer binds to SepF5. In a previous study on the SepF-FtsZBs interaction, a similar FtsZBs∆16 truncate still cosedimented with SepF, which suggested that SepF binds to a secondary site on FtsZ6. The difference between these studies was the composition of reaction buffers- at pH 7.5 there was no cosedimentation of SepF with the FtsZ truncate, whereas at pH 6.5 there was cosedimentation. Gündoğdu et al. noted that SepF is not functional and precipitates at pH 6.57, showing that the observed cosedimentation at pH 6.5 is likely to be caused by precipitation of SepF rather than interaction with the FtsZBs∆16 C-terminal truncate. The influence of pH and KCl concentration on the polymerization of FtsZ has been previously examined. Polymers of E. coli FtsZ (FtsZEc) at pH 6.5 are longer and more abundant than those formed at neutral pH8,9. Tadros et al. have studied the polymerization of FtsZEc in the presence of monovalent cations noting that K+ binding is linked to FtsZEc polymerization and is crucial for FtsZ activity10. The pH is more critical when the interaction of FtsZ with other proteins is studied, as shown by the previous example of SepF, and the pH dependency of the inhibitory effect of MinC on FtsZ11. As both pH and salt concentration may influence the interaction of FtsZ with other proteins, it is important to choose the right conditions and controls for the FtsZ polymerization studies.
Here we describe protocols to study FtsZ polymerization and GTPase activity by light scattering, electron microscopy, sedimentation, and GTPase assays. Right angle light scattering is a standard method to study FtsZ polymerization in real time12. We introduced a few improvements to the sedimentation and GTPase assay. We present in detail how to prepare samples for light scattering and electron microscopy. Several buffers used in the literature to study FtsZ polymerization were tested and we describe the best conditions for each experiment. We also show which controls should be introduced to obtain the best data.
These methods allow a quick study of FtsZ polymerization, activity and interaction with other proteins using simple methods and equipment which is available in most laboratories. More sophisticated methods to study FtsZ polymerization exist but often require access to more specialized equipment, and/or modification of FtsZ with fluorescent labels8,13,14. The simple methods described in this paper are illustrated using FtsZ from B. subtilis and E. coli, the most common Gram+ and Gram- model organisms. The protocols can be adapted to any other FtsZ protein. Based on preliminary assays with these novel FtsZs, slight changes regarding time, buffer or temperature of incubation may be necessary for an optimal result. The experiments described here should aid in finding these optimal conditions.
Protocol
Untagged FtsZ proteins were purified as described earlier11,15, dialyzed against 20 mM Tris/ HCl (pH 7.9), 50 mM KCl, 1 mM EGTA, 2.5 mM MgAc and 10% glycerol and stored at -80 °C. Under those conditions the protein may be stored for over 2 years without significant loss of activity. The protein should be stored in 100 µl aliquots to avoid thawing and freezing the sample. After thawing, the sample can be kept at 4 °C for maximum one week. FtsZ is soluble at high concentrations and may be stored at 7-10 mg/ml. It is important to keep the protein concentration high to avoid unwanted effects of storage buffer components in later experiments. Thus, storage concentration should allow for a dilution of FtsZ of at least 10x to bring glycerol concentration below 1% and to minimize the concentration of the other components of the dialysis buffer in the reaction mix. FtsZ polymerization may also be affected by the presence of high sodium9 or imidazole concentrations thus these components must be removed from the polymerization buffer. SepF was purified as described7 and stored in elution buffer at -80 °C. Alternative published procedures for purification of FtsZ from E. coli and B. subtilis as well as references to the procedures for purification of FtsZ from different sources are summarized in Table 1 (see representative results section).
1. Sample Preparation
- Prepare polymerization buffers:
1 50 mM Hepes/ NaOH, pH 7.5 2 25 mM PIPES/ NaOH, pH 6.8 3 50 mM MES/ NaOH, pH 6.5 4 50 mM Hepes/ NaOH, pH 7.5; 50 mM KCl 5 25 mM PIPES/ NaOH, pH 6.8; 50 mM KCl 6 50 mM MES/ NaOH, pH 6.5; 50 mM KCl 7 50 mM Hepes/ NaOH, pH 7.5; 300 mM KCl 8 25 mM PIPES/ NaOH, pH 6.8; 300 mM KCl 9 50 mM MES/ NaOH, pH 6.5; 300 mM KCl - Filter sterilize all buffers using a 22 µm membrane filter.
- Prepare 100 mM GTP, GDP and MgCl2 stock solutions in each polymerization buffer from (1).
- Preclear the proteins by spinning at 100,000 x g for 20 min at 4 °C for all of the experiments.
2. FtsZ Sedimentation Assay
- Prepare the reaction mix by addition of MgCl2 and FtsZ to one of the polymerization buffers (see sample preparation point 1) in tubes compatible with high-speed centrifugation. Total volume should be 49 µl, with MgCl2 at 10 mM and FtsZ at 12 µM at 50 µl final volume.
- Place the tube in an incubator with shaking function, incubate for 2 min at 30 °C at 300 rpm (alternatively the sample may be gently flicked and briefly microfuged followed by prewarming at 30 °C).
- Start polymerization by adding 1 µl of GTP or GDP stock solution in the same buffer as used in the experiment (final concentration of 2 mM). Incubate for 10 or 2 min (for buffers with 50 mM KCl and 300 mM KCl, respectively) at 30 °C at 300 rpm (or in an incubator with shaking function).
- Transfer the tubes to an ultracentrifuge rotor and spin down for 10 min at 350,000 x g (89,700 rpm for TLA 120.1 rotor) at 25 °C.
- After spinning, carefully remove the tubes from the rotor and immediately transfer the supernatant into a clean tube. Prepare samples for SDS-PAGE by adding 20 µl of supernatant to 20 µl of 2x sample buffer. Boil for 10 min at 98 °C.
- Add 50 µl of 2x sample buffer to the pellet fraction containing FtsZ polymers. Place the ultracentrifuge tube in a 2 ml tube. Resuspend the pellet by boiling for 10 min at 98 °C, then add 50 µl of demineralized H2O to make the sample the same 2x dilution as the supernatant sample.
- Turn the ultracentrifuge tube upside down in the 2 ml tube and spin down for 5 minutes in an Eppendorf centrifuge at 18,000 x g. Remove the ultracentrifuge tube from the 2 ml tube.
- Load 10 µl of each supernatant and pellet sample side by side on a 10% SDS-PAGE gel. Run the gel at 150 V.
- Stain the gel with Coomassie Brilliant Blue G-250 and keep for quantification.
3. FtsZ Sedimentation Assay at Slow Spin
- Prepare polymerization solution as in step 2, add SepF and/or FtsZ (final concentration 12 µM). These experiments can be performed in Beckman disposable 1.5 ml tubes in combination with a TLA-55 rotor.
- Place the tube in an incubator with shaking function and incubate for 2 min at 30 °C at 300 rpm.
- Start polymerization by the adding 1 µl of GTP or GDP from a stock solution (final concentration 2 mM), incubate for 20 min at 30 °C at 300 rpm.
- Spin down for 15 min at 24,600 x g (20,000 rpm for TLA 55 rotor) at 25 °C.
- Remove the supernatant and transfer into a clean tube, take 20 µl and transfer into 20 µl of 2x sample buffer. Boil for 10 min at 98 °C.
- Add 50 µl of 2x sample buffer to pellet fraction containing polymers and resuspend by boiling for 10 min at 98 °C, add 50 µl of demineralized H2O.
- Load 10 µl of each supernatant and pellet sample side by side on a 10% SDS-PAGE gel. Run the gel at 150 V.
- Stain the gel with Coomassie Brilliant Blue G-250 and keep for quantification.
4. Quantification of the FtsZ Sedimentation Assays
- Take a picture of the Coomassie stained gel using a gel documentation system (e.g. LAS-4000, Fujifilm).
- Open the gel image in a program suitable for densitometric analysis of gels (e.g. AIDA image analyzer program (Raytest)) and describe analysis in this program below.
- Click the "Evaluation" button in the toolbar.
- Select the "2D Densitometry" from the list and click ok.
- On the main menu, click "Evaluation" and choose the "Region Determination" entry.
- To create a region on the gel, click on the symbol of Auto-contour tool in the Region Determination toolbox.
- Click at the upper left corner of the protein band on the gel, hold down the mouse button and drag it to the desired lower right end of the band and release the mouse button.
- Mark each FtsZ/SepF band in the same way.
- All the information about the evaluation of the assigned regions can be found in the Region Report. To obtain the Region Report, click the "Show region Report" button in the Region Determination toolbox.
- To export the report, on the main menu, click File and choose "Export à 2D Region Report" entry.
- In the region report, the intensity of every created region should be found. Calculate the percentage of protein (FtsZ, regulatory protein) in the pellet using the intensity values from the report.
5. 90° Light Scattering
- Turn on a fluorescence spectrometer (e.g. AMINCO-Bowman Series 2), allow the lamp to warm up for several minutes to avoid thermal fluctuations and turn on a circulating water bath to maintain the cuvette chamber temperature at 30 °C.
- Define the operating parameters of the spectrometer: detector high voltage 300 V, emission and excitation wavelength: 350 nm, slit width: 4 nm. Note that many spectrometers automatically adjust the signal at the start of an experiment to a certain percentage (e.g. 60%) of the maximum. This causes a scatter signal to go out of range as soon as GTP is added to polymerize FtsZ. It is wise to first establish the right signal amplification- detector high voltage- for maximal polymerization before starting a series of experiments.
- Program a data-acquisition protocol. Choose time-based acquisition, with a duration of 3,600 sec.
- Carefully clean a fluorescence cuvette with water and ethanol, if necessary- sonicate in water bath at room temperature for 5 min. In this protocol, cuvettes with a 1 cm path length and a 200 μl volume were used and stored in storage solution (0.5-1% Hellmanex). As an alternative, single use UV-compatible plastic cuvettes (UVette, Eppendorf) can be used.
- Prepare 294 µl of a master mix of the polymerization buffer (see sample preparation point 1) with 10 mM MgCl2 and 12 µM FtsZ as final concentration calculated for 300 µl, and vortex.
- Transfer 196 µl of the polymerization buffer to the cuvette and place it in spectrometer. Incubate for 2 min at 30 °C.
- Start the data acquisition and wait for 90 sec to verify that the signal is stable.
- Add 4 µl of 100 mM GTP or GDP (final concentration: 2 mM) to achieve a final reaction volume of 200 µl, pipette up and down with a larger volume pipette to mix and resume acquisition.
6. Transmission Electron Microscopy
- Prepare samples as for the FtsZ sedimentation assay (the volume can be reduced to 10 μl final volume to save material).
- After the incubation time, apply 2 µl of the sample onto a glow-discharged 400 mesh carbon-coated copper grid, incubate for 15 sec.
- Blot the grid dry by gently touching or dragging the grid parallel or perpendicular to a piece of filter paper.
- Stain the grid using 4 µl of a 2% uranyl-acetate solution. Blot the grid dry as described in step 6.3.
- View the grid in a Philips CM120 electron microscope operating at 120 kV at 39,200X magnification.
7. GTP Hydrolysis Assay
The setup of the experiment is designed in such a way that GTP hydrolysis of FtsZ is stopped after various reaction times by mixing the reaction with malachite green. In this way, the time of the color development of malachite green is the same for each sample.
- Prepare 1.5 ml 2 mM GTP in one of the polymerization buffers (see sample preparation, point 1).
Prepare a 0-40 µM phosphate standard dilution in a polymerization buffer, and prepare malachite green working reagent as described in the POMG-25H (Bio assays) kit. Alternatively, working reagents can be prepared in-house according to protocols described by Lanzetta et al.16 - Prepare master mixes in a total volume 360 µl:
I 24 µM FtsZBs, 20 mM MgCl2, polymerization buffer II 12 µM FtsZEc, 20 mM MgCl2, polymerization buffer III (control 1) 24 µM FtsZBs, 2 mM EDTA, polymerization buffer IV (control 2) 12 µM FtsZEc, 2 mM EDTA, polymerization buffer - Pipette 20 µl aliquots of the master mixes, 100 µl phosphate standards and 180 µl of 2 mM GTP in a qPCR 96-well plate in the following order:
A B C D E F G H 1 III III I I IV IV II II 2 III III I I IV IV II II 3 III III I I IV IV II II 4 III III I I IV IV II II 5 III III I I IV IV II II 6 III III I I IV IV II II 7 III III I I IV IV II II 8 III III I I IV IV II II 9 PS PS PS PS PS PS PS PS 10 PS PS PS PS PS PS PS PS 11 12 GTP GTP GTP GTP GTP GTP GTP GTP
PS - phosphate standard - Place the qPCR plate in a PCR machine with the program set to 40 min cycle at 30 °C.
- Prepare 20 µl aliquots of malachite green working reagent in a 96-well plate. Add 60 µl of the polymerization buffer from the experiment to lanes 1'-8'. The sample will be diluted 4x compared to the phosphate standard, please consider this fact during final calculations.
A B C D E F G H 1' III III I I IV IV II II 2' III III I I IV IV II II 3' III III I I IV IV II II 4' III III I I IV IV II II 5' III III I I IV IV II II 6' III III I I IV IV II II 7' III III I I IV IV II II 8' III III I I IV IV II II 9' PS PS PS PS PS PS PS PS 10' PS PS PS PS PS PS PS PS - Add 20 µl of GTP to lane 1, pipette up and down to mix, start timer (this is the starting time point for the 30 min reaction).
- After 10 min, 30 sec add GTP to lane 2, pipette up and down to mix (20 min reaction).
- After 16 min add GTP to lane 3, pipette up and down to mix (15 min reaction).
- After 21 min, 30 sec add GTP to lane 4, pipette up and down to mix (10 min reaction).
- After 25 min add GTP to lane 5, pipette up and down to mix (7 min reaction).
- After 27 min, 30 sec add GTP to lane 6, pipette up and down to mix (5 min reaction).
- After 29 min add GTP to lane 7, pipette up and down to mix (4 min reaction)..
- After 30 min transfer 20 µl from lane 1 into lane 1', pipette up and down to mix (starting point of malachite green color development for the 30 min reaction).
- After 30 min, 30 sec transfer 20 µl from lane 2 to 2', pipette up and down to mix (starting point of malachite green color development for the 20 min reaction).
- Repeat the step for lanes 3-7 every 30 sec.
- After 33 min, 30 sec add 20 µl of GTP to lane 8, pipette up and down to mix and transfer 20 µl to lane 8', pipette up and down to mix (0 min reaction and starting time point for malachite green color development for the reaction).
- After 34 min add 80 µl from lane 9 to 9', pipette up and down to mix (the starting time point for malachite green color development for the phosphate standard 1).
- After 34 min 30 sec transfer 80 µl from lane 10 to 10', pipette up and down to mix (the starting time point for malachite green color development for the phosphate standard 2).
- Remove all the air bubbles from the samples and incubate the plate at room temperature for another 25 min 30 sec.
- Place the plate in 96-well plate reader.
- After 60 min measure the plate 10x every 30 sec at wavelength 630 nm (malachite green color development is now 30 min for the first reaction). Every measurement corresponds to every time point from steps 7.6-7.12 and 7.16 and must be calculated separately during a data analysis.
- Calculate the free phosphate in every sample using the phosphate standard calibration curve.
- Plot the data as Phosphate release over time, and calculate the FtsZ GTP hydrolysis activity from the linear range of the curve.
Results
Purification of FtsZ from different bacterial sources has been described in the literature and is summarized in Table 1.
| Source | Method | Modification | Yield obtained [mg/L of culture]> | References |
| B. subtilis | 1) Ammonium sulfate precipitation/ion exchange chromatography | no | 40 | This work, 11,15 |
| 2) Affinity chromatography | His-tag | ND | 17 | |
| E. coli | 1) Ammonium sulfate precipitation/ion exchange chromatography | no | 35 | This work, 11,15 |
| 2) Calcium precipitation, ion exchange chromatography | no | 40 | 18 | |
| Methanococcus jannaschii | 1) Affinity chromatography under denaturing conditions/refolding/ammonium sulfate precipitation/gel filtration | His-tag | 1.3 | 19 |
| 2) Affinity chromatography/ gel filtration | His-tag | ND | 20 | |
| Thermotoga maritima | Ion exchange chromatography/gel filtration | no | 6.7 | 19 |
| Pseudomonas aeruginosa | Affinity chromatography/gel filtration | Strep-tag, His-tag | ND | 21 |
| Mycobacterium tuberculosis | 1) Affinity/ion exchange chromatography | no | ND | 22 |
| 2) Affinity chromatography/ gel filtration | no | 30 | 23 | |
| Aquifex aeolicus | Affinity chromatography/gel filtration | His-tag, C-terminal truncation (331-367) | ND | 24 |
| Caulobacter crescentus | Ion exchange chromatography/ammonium sulfate precipitation/gel filtration | no | ND | 25 |
Table 1. FtsZ purification protocols described. ND: not determined.
Sedimentation of FtsZ polymers
Initially, we used two different velocities to spin down FtsZ polymers. We found that only at a velocity of 350,000 x g single polymers of FtsZEc are spun down (Figure 1) whereas at 190,000 x g only bundles of FtsZBs are present in the pellet fraction (data not shown). Therefore 350,000 x g was used in our further experiments. The percentage of polymerized FtsZEc and FtsZBs is similar at 50 mM KCl even though the light scattering experiments revealed a much higher scattering signal for FtsZBs. This is due to bundles formed by FtsZBs which scatter more light than single polymers of FtsZEc. It was not possible to obtain high amount of FtsZ polymers in the pellet fraction in the experiment with 300 mM KCl for both FtsZEc and FtsZBs (Figure 1). We attribute this to a combination of quick disassembly of the FtsZ structures and decreased bundling of the filaments.
Sedimentation of FtsZ-SepF tubules
To analyze the interaction of FtsZ with certain activators sedimentation assays can be performed at lower centrifugation speeds. At this velocity only large structures of FtsZ may be pelleted, e.g. the large tubules formed by SepF rings and FtsZBs filaments5, or the bundles formed by FtsZ and ZapA. We used lower centrifugation (24,600 x g) to demonstrate the feasibility of this approach for the tubules formed by FtsZ and SepF. FtsZ was recovered in the pellet above background levels only when both SepF and GTP were present in the sample (Figure 2), and the presence of SepF does not influence FtsZ GTPase activity7 showing that FtsZ is fully active in the presence of SepF. Specific sedimentation of SepF and FtsZ is roughly 45% of total SepF and 15% of total FtsZ (compared to material sedimenting when GDP is added). This shows that the SepF-FtsZ tubules contain more SepF than FtsZ. This may be because many SepF rings organize the FtsZ-SepF tubules5,7. The exact stoichiometry of SepF-FtsZ in these tubules is not known but our results suggest that there is more SepF present than FtsZ.
FtsZEc and FtsZBs polymerization and bundling properties
To characterize the polymerization efficiency of FtsZBs and FtsZEc in different buffers we analyzed both proteins by 90° angle light scattering. At 50 mM KCl, FtsZBs gives a 20-40-fold higher light scattering signal than FtsZEc depending on buffer pH (Figures 3A and B) confirming results of Buske et al.26 Increasing the KCl concentration in the buffer did not significantly influence the light scattering signal of FtsZEc (Figure 3D) but the signal of FtsZBs decreased ~80-fold at pH 7.5, ~30-fold at pH 6.8 and ~45-fold at pH 6.5 in 300 mM KCl (Figure 3C) compared to buffers with 50 mM KCl (Figure 3A). Disassembly of FtsZ polymers is faster at higher KCl concentration for both proteins (Figures 3C and D). Studies of Pacheco-Gómez et al. show that E. coli FtsZ polymerization and bundling is pH dependent. These authors found that in a buffer with 50 mM KCl the light scattering signal of FtsZ polymerization was higher, and disassembly of FtsZ took longer at pH 6.0 compared to pH 7.0 8. These results are not in agreement with our data from polymerization of FtsZEc at 50 mM KCl (Figure 3B), but it has to be noted that we have used three different buffers (HEPES, MES and PIPES) where Pacheco-Gómez et al. only used MES. Thus, not only the pH, but also buffer composition (ionic strength) affects the kinetics of FtsZ polymers at 50 mM KCl. However, at 300 mM KCl neither buffer composition nor pH influenced FtsZEc assembly in a detectable manner.
A light scattering experiment of FtsZBs in buffers without KCl was not possible due to precipitation of the protein under these conditions. When the concentration of FtsZBs was lowered to 3 µM, precipitation did not occur. However, 3 µM is not the physiological concentration of FtsZ in the cell. In plastic cuvettes, FtsZBs did not precipitate at 12 µM at pH 7.5, but at pH 6.8 and 6.5 FtsZ still precipitated in the absence of KCl.
Morphologies of FtsZ structures from E. coli and B. subtilis
The structures formed by FtsZ were inspected by TEM. FtsZBs assembled into closely compacted polymers that covered the whole grid in all buffers at low salt (Figures 4A-C). FtsZEc formed long filaments, cables and bundles in all buffers at low salt (Figures 4D-F). However, the observable amount of polymers formed by FtsZEc was lower than the amount formed by FtsZBs. In high salt buffers FtsZBs formed longer single-stranded protofilaments which did not associate into bundles (Figures 4G-I). While FtsZBs protofilaments changed structure at higher salt concentration, FtsZEc formed structures indistinguishable from those of low salt buffer (Figures 4J-L). There was no observable pH influence on polymerization of FtsZEc but FtsZBs forms more bundles at pH 6.5 which are visible as closely compacted polymers and sheets (Figure 4B). These results are in accord with our light scattering experiments and previously published TEM work8,11,26.
The GTPase activity of FtsZ at high and low KCl concentrations
The GTP hydrolysis activity of FtsZ was measured under different conditions using a colorimetric assay for free phosphate. As reported previously15 the GTPase activity of FtsZ increased with increasing KCl concentration: depending on the buffer used FtsZBs. showed a 3-7 fold increase, and FtsZEc showed a 1.5-2.5 fold increase in GTPase activity at 300 mM KCl compared to 50 mM KCl. The reduced GTPase activity at 50 mM KCl is due to bundling of FtsZBs filaments. At 50 mM KCl FtsZEc had a 3-6 fold higher GTPase activity than FtsZBs due to quicker disassembly of the FtsZEc polymers. The difference in GTP hydrolysis activity between FtsZBs and FtsZEc was reduced at 300 mM KCl, possibly because of reduced bundling of FtsZBs filaments (Figure 5).
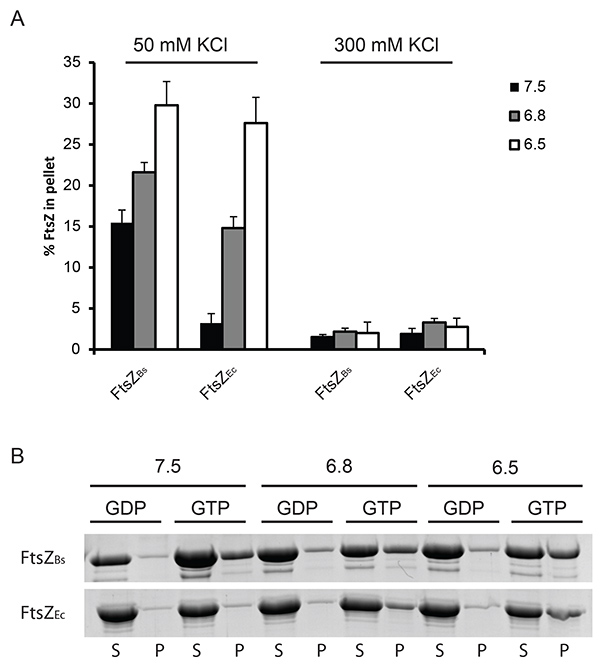
Figure 1. Quantification of FtsZ polymerization by sedimentation. (A) 12 µM FtsZ was polymerized in the presence of 2 mM GTP or GDP at pH 7.5 (black bars), 6.8 (grey bars) or 6.5 (white bars). The amount of protein pelleted was determined by densitometric analysis of Coomassie stained gels. GDP served as a control for a specific sedimentation and the percentage of FtsZ sedimented with GDP was subtracted from the percentage of FtsZ sedimented with GTP to obtain the values plotted in the graph. On the left: FtsZ sedimented at 50 mM KCl, on the right: FtsZ sedimented at 300 mM KCl. (B) Representative results from Coomassie stained gels. Polymerization of FtsZBs (upper gel) and FtsZEc (lower gel) at 50 mM KCl. (S) supernatant, (P) pellet fractions from the experiment. Click here to view larger image.
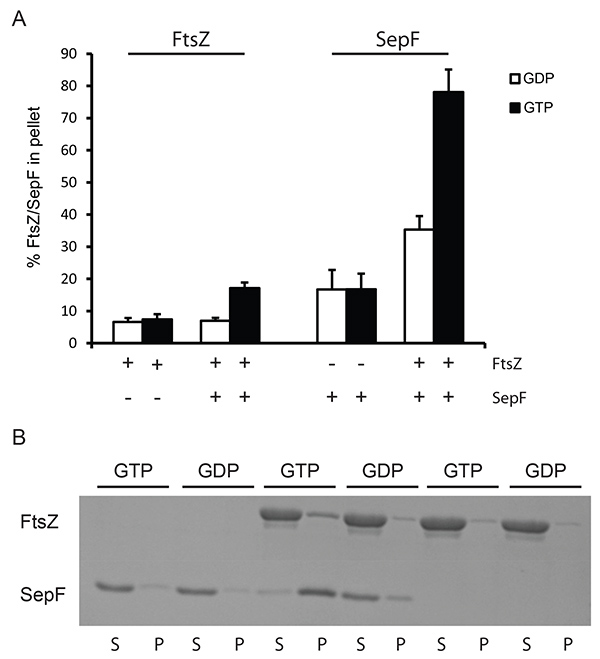
Figure 2. Sedimentation of SepF/FtsZ tubules at low speed. (A) 12 µM FtsZBs was polymerized with 2 mM GDP (white bars) or GTP (black bars). The amount of protein pelleted was determined by densitometric analysis of Coomassie stained gels. The + and - signs under the x-axis indicate the presence or absence of FtsZ and SepF in the reaction. (B) Representative results from a Coomassie stained gel. Polymerization of FtsZBs in the presence and absence of SepF. As a control SepF without FtsZ was used. Polymerization was carried out with GTP and GDP. (S) supernatant, (P) pellet fractions from the experiment. Click here to view larger image.
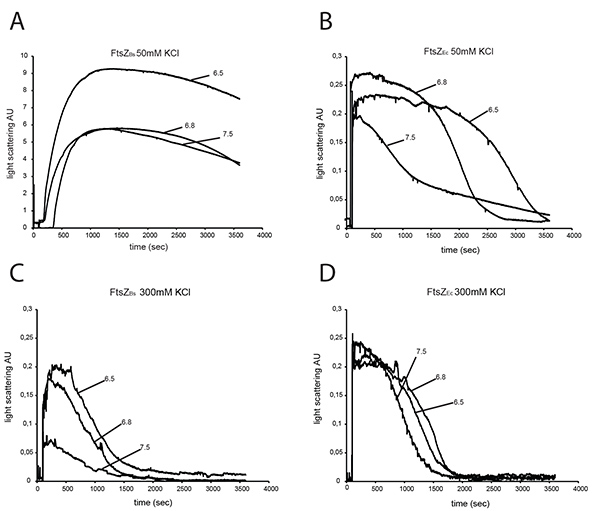
Figure 3. Light scattering of 12 μM FtsZEc and 12 μM FtsZBs. FtsZs were assembled in the presence of 2 mM GTP and polymerization was monitored by 90° angle light scattering. Polymerization of FtsZBs (A) and FtsZEc (B) at 50 mM KCl at pH 7.5, pH 6.8, pH 6.5. Polymerization of FtsZBs (C) and FtsZEc (D) at 300 mM KCl at pH 7.5, pH 6.8 and pH 6.5. Click here to view larger image.

Figure 4. Structures of FtsZBs and FtsZEc polymers visualized by electron microscopy. (A-L) Images of 12 µM FtsZBs (A-C and G-I) and FtsZEc (D-F) and (J-L) polymerized with 2 mM GTP. (A-C) FtsZBs in buffer with 50 mM KCl and pH 7.5, 6.8, and 6.5 respectively. (D-F) FtsZEc in buffer with 50 mM KCl and pH 7.5, 6.8, and 6.5 respectively. (G-I) FtsZBs in buffer with 300 mM KCl and pH 7.5, 6.8, and 6.5 respectively. (J-L) FtsZEc in buffer with 300 mM KCl and pH 7.5, 6.8, and 6.5 respectively. Scale bar: 100 nm. Click here to view larger image.
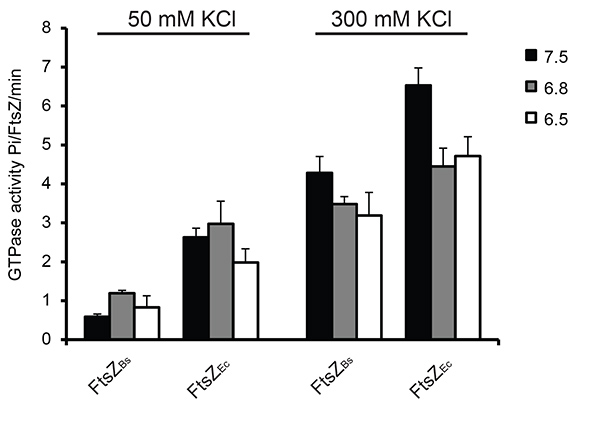
Figure 5. GTP hydrolysis during FtsZ polymerization in 6 different buffers. In all experiments 2 mM GTP was used. As a control sample with no MgCl2 was used. Activity of FtsZ without MgCl2 was subtracted from the activity of FtsZ in the presence of MgCl2. On the left: GTPase activity of FtsZ at 50 mM KCl, on the right: GTPase activity of FtsZ at 300 mM KCl. Click here to view larger image.
Discussion
We describe a set of methods that allows a quick analysis of FtsZ activity and its interaction with other proteins. Light scattering, sedimentation and GTPase assays as well as electron microscopy have been widely used to study FtsZ polymerization. We have made some improvements to existing protocols, we showed the influence of different conditions on FtsZ assembly, and we propose controls that should be included in FtsZ studies.
We introduce low speed centrifugation to distinguish large structures formed by the association between FtsZ and its interacting proteins from FtsZ polymers. This method shows two advantages over the standard sedimentation assay. First, no background is formed by the FtsZ polymers in the pellet fraction as they are not spun down at 24,600 x g. Second, the amount of FtsZ present in the structure formed with an interacting protein may be calculated from the gel. Two critical steps in this method are the incubation time and the GTP concentration. It is important to centrifuge the large protein structure when it is complete but before it disassembles when all GTP is hydrolyzed. The best control for this study is polymerization of FtsZ with GDP. There is one potential limitation of the assay. FtsZ forms a stable complex with SepF, which can easily be spun down at 24,600 x g. If the sedimentation with another activator or a drug that bundles FtsZ polymers is performed, it may be necessary to adapt the assay. It may be done by changing the incubation time, or increasing the speed of centrifugation.
Proper preparation of the sample is the most important for light scattering experiments. Proteins must be precleared by spinning and all the buffers should be filtered prior to use. If any aggregates are present in the sample, they will disrupt a stable signal obtained from FtsZ polymers. For the analysis of the FtsZ structures by electron microscopy, preparation of a grid is the main step. The time of sample incubation on the grid will have the effect of producing more or less compacted polymers. For bundles of FtsZBs, the time of incubation must be shorter than for FtsZEc and FtsZBs at high KCl concentration. We used a concentration of 12 µM for every sample to be able to compare the results. However, for FtsZBs at 50 mM KCl a lower FtsZ concentration should be used, as 12 µM resulted in a full saturation of the grid. This makes the polymers highly compacted and difficult to detect. Less compacted polymers are better to detect on EM.
The GTPase assay is the only experiment used to study the activity rather than the structures of FtsZ. Mg2+ is necessary for GTP turnover in FtsZ polymers. Thus, in the absence of Mg2+, FtsZ does not hydrolyze GTP. Therefore, a sample with no Mg2+ is the right control in this assay but cations of Mg are present in the FtsZ storage buffer. They may be removed by addition of 1 mM EDTA to the control sample. The critical step in this assay is the incubation time. It is important to stop FtsZ activity after a given time. This is achieved by transferring the FtsZ sample to a malachite green solution in a 96-well plate. However, development of the malachite green color is a continuous process. Thus the measurements must be taken at the same time for every sample. Using a well-planned GTP addition protocol with measurements taken each 30 sec apart in an established order, it is possible to obtain the same incubation and sample handling time for every time point. Another critical step is choosing the concentration of the protein for the experiment. In the experiment we used two different concentrations for FtsZEc and FtsZBs. GTP hydrolysis is much quicker for FtsZEc compared to FtsZBs. The GTPase activity of FtsZEc under chosen conditions and at 12 µM is linear only for maximum 5 min and after that time the hydrolysis rate plateaus. Thus, it is difficult to interpret data from the experiment when performed under these conditions. In this case FtsZEc must be used at lower concentration than FtsZBs to be able to compare activities of both proteins. The GTPase activity of FtsZs from different sources may vary. Thus, the right concentration must be chosen. The concentration for FtsZ polymerization should be well above the critical concentration (in general from 2.5-10 µM). The dynamics of FtsZ assembly and disassembly is also important. Some proteins show a significant lag in polymerization after addition of GTP, as shown for FtsZBs at 50 mM KCl. It is useful to perform the light scattering assay before the GTPase assay to approximate the time of assembly and disassembly of FtsZ polymers. After that, the time of incubation and concentration of protein may be chosen. Since the conditions chosen for FtsZ polymerization are crucial, it is important to use the right pH and KCl concentration in each method. In this work we studied 9 different buffers with pH ranging from 6.5-7.5 and KCl concentrations from 0 M to 300 mM. We noticed that the best condition to analyze FtsZs from B. subtilis and E.coli and their biological activity is at pH that is close to physiological level (7.5) together with a high KCl concentration. At a high KCl concentration, FtsZ has a higher GTPase activity and produces polymers that are better detectable by electron microscopy. We also confirmed that the physiological pH and a high KCl concentration are better for the study of the interaction between FtsZ and regulatory proteins than any other buffers mostly used to study FtsZ assembly. FtsZBs shows a similar activity to FtsZEc when studied at high KCl concentration. In addition, at low salt concentration the influence of pH is more visible than in the buffers with high salt concentration. FtsZ sometimes precipitates when using buffers without KCl, as a result, buffers without salt should be avoided. Sedimentation of FtsZ polymers is low when using buffers with high KCl concentrations. This may be an advantage when studying interactions between FtsZ and proteins that assemble FtsZ filaments such as SepF and ZapA as these higher order structures are easy to detect with centrifugation. In all our experiments we used MgCl2 at a 10 mM concentration. It was shown that a relatively high Mg2+ concentration stabilizes FtsZ polymers and reduces the GTPase activity of FtsZ. In Table 2 results from various studies are summarized describing FtsZ polymerization and GTPase activity at different Mg2+ concentrations using otherwise identical buffer conditions 27. The measured concentration of free cytoplasmic Mg2+ is 0.9 mM3. It should be noticed that GTP will chelate an equivalent amount of Mg2+. Thus, the optimal Mg2+ concentration for GTPase experiments is around 2-2.5 mM, which is close to physiological level3. However, in our experiments we used MgCl2 at a 10 mM concentration to obtain an easily detectable light scattering signal and to stabilize FtsZ polymers during the sedimentation assay.
Although we applied our protocols to FtsZ from the model organisms E. coli and B. subtilis, they can be adapted to FtsZ from any other organism. It has to be noted that the physiological pH, and concentrations of monovalent, and divalent cations differ among organisms. Thus, the optimal conditions for FtsZ polymerization may vary. Differences in doubling time and growth conditions of different bacteria may result in different assembly kinetics of FtsZ and optimal conditions of the experiments. However, our protocol provides a good starting point for the experiments with FtsZs from other organisms. The protocols should be useful for the study of FtsZ with regulatory proteins or the study of effects of small compounds and drugs on FtsZ.
| Source | Polymerization [% of FtsZ sedimented] | GTPase [Pi/FtsZ/min] | Mg2+ concentration [mM] | FtsZ concentration [µM] | References |
| FtsZEc | ~ 28% | ~ 2.1 | 10 | 12 | This work |
| ~ 50% | ~ 2.4 | 10 | 12.5 | 27 | |
| ~ 43% | ~ 3.5 | 5 | 12.5 | 27 | |
| ~ 27% | ~ 4.6 | 2.5 | 12.5 | 27 | |
| ND | ~ 5.4 | 2.5 | 5 | 26 | |
| FtsZBs | ~ 30% | ~ 0.8 | 12 | This work | |
| ~ 52% (with DEAE dextran) | ~ 0.5 | 10 | 10 | 11 | |
| ND | ~ 2.25 | 2.5 | 5 | 26 |
Table 2. Effect on Mg2+ on FtsZ polymerization and GTPase. Results from this work compared to published data. All experiments were carried out in 50 mM MES/ NaOH, pH=6.5, 50 mM KCl.
Disclosures
No conflicts of interest declared.
Acknowledgements
Work in our laboratory is funded by a VIDI grant from the Netherlands Organisation for Scientific research (to DJS). We thank Marc Stuart and the Department of Electron Microscopy at our university, for assistance with and providing access to the transmission electron microscope.
Materials
| Name | Company | Catalog Number | Comments |
|---|---|---|---|
| GTP | Roche | 10106399001 | Part 1, 2, 3, 4, 5, 6, 7 |
| Thickwall Polycarbonate Tubes | Beckman Coulter | 343776 | Part 2 |
| Optima MAX-XP Ultracentrifuge | Beckman Coulter | 393315 | Part 2, 3 |
| Polyallomer Tube with Snap-on Cap | Beckman Coulter | 357448 | Part 3 |
| AIDA Bio-package, 1D, 2D, FL | Raytest Isotopenmessgeräte GmbH | 15000001 | Part 4 |
| Luminescence Image Analyzer LAS-4000 | Fujifilm | Part 4 | |
| Thermo Spectronic AMINCO-Bowman Luminescence Spectrometer | Spectronic Instruments | Part 5 | |
| Fluorescence Cell | Hellma Analytics | 105-250-15-40 | Part 5 |
| Square 400 Mesh, Copper, 100/vial | Electron Microscopy Sciences | G400-Cu | Part 6 |
| CM120 Electron Microscope Operating at 120 kV | Philips | Part 6 | |
| 96 ml x 0.2 ml Plate | BIOplastics | B70501 | Part 7 |
| Malachite Green Phosphate Assay Kit | BioAssay System | POMG-25H | Part 7 |
| PowerWave HT Microplate Spectrophotometer | BioTek | Part 7 |
References
- Haydon, D. J., Stokes, N. R., et al. An inhibitor of FtsZ with potent and selective anti-staphylococcal activity. Science. 321 (5896), 1673-1675 (2008).
- Adams, D. W., Errington, J. Bacterial cell division: assembly, maintenance and disassembly of the Z ring. Nat. Rev. Microbiol. 7 (9), 642-653 (2009).
- Erickson, H. P., Anderson, D. E., Osawa, M. FtsZ in bacterial cytokinesis: cytoskeleton and force generator all in one. Microbiol. Mol. Biol. Rev. 74 (4), 504-528 (2010).
- Li, Z., Trimble, M. J., Brun, Y. V., Jensen, G. J. The structure of FtsZ filaments in vivo suggests a force-generating role in cell division. EMBO J. 26 (22), 4694-4708 (2007).
- Król, E., van Kessel, S. P., van Bezouwen, L. S., Kumar, N., Boekema, E. J., Scheffers, D. J. Bacillus subtilis SepF binds to the C-terminus of FtsZ. PLoS One. 7 (8), e43293(2012).
- Singh, J. K., Makde, R. D., Kumar, V., Panda, D. SepF increases the assembly and bundling of FtsZ polymers and stabilizes FtsZ protofilaments by binding along its length. J. Biol. Chem. 283 (45), 31116-31124 (2008).
- Gündoğdu, M. E., Kawai, Y., et al. Large ring polymers align FtsZ polymers for normal septum formation. EMBO J. 30 (3), 617-626 (2011).
- Pacheco-Gomez, R., Roper, D. I., Dafforn, T. R., Rodger, A. The pH dependence of polymerization and bundling by the essential bacterial cytoskeletal protein FtsZ. PLoS One. 6 (6), e19369(2011).
- Mendieta, J., Rico, A. I., Lopez-Vinas, E., Vicente, M., Mingorance, J., Gomez-Puertas, P. Structural and functional model for ionic (K(+)/Na(+)) and pH dependence of GTPase activity and polymerization of FtsZ, the prokaryotic ortholog of tubulin. J. Mol. Biol. 390 (1), 17-25 (2009).
- Tadros, M., Gonzalez, J. M., Rivas, G., Vicente, M., Mingorance, J. Activation of the Escherichia coli cell division protein FtsZ by a low-affinity interaction with monovalent cations. FEBS Lett. 580 (20), 4941-4946 (2006).
- Scheffers, D. J. The effect of MinC on FtsZ polymerization is pH dependent and can be counteracted by ZapA. FEBS Lett. 582 (17), 2601-2608 (2008).
- Mukherjee, A., Lutkenhaus, J. Analysis of FtsZ assembly by light scattering and determination of the role of divalent metal cations. J. Bacteriol. 181 (3), 823-832 (1999).
- Chen, Y., Erickson, H. P. Rapid in vitro assembly dynamics and subunit turnover of FtsZ demonstrated by fluorescence resonance energy transfer. J. Biol. Chem. 280 (23), 22549-22554 (2005).
- Hou, S., Wieczorek, S. A., et al. Characterization of Caulobacter crescentus FtsZ protein using dynamic light scattering. J. Biol. Chem. 287 (28), 23878-23886 (2012).
- Mukherjee, A., Lutkenhaus, J. Dynamic assembly of FtsZ regulated by GTP hydrolysis. EMBO J. 17 (2), 462-469 (1998).
- Lanzetta, P. A., Alvarez, L. J., Reinach, P. S., Candia, O. A. An improved assay for nanomole amounts of inorganic phosphate. Anal. Biochem. 100 (1), 95-97 (1979).
- Ray, S., Kumar, A., Panda, D. GTP regulates the interaction between MciZ and FtsZ: a possible role of MciZ in bacterial cell division. Biochemistry. 52 (2), 392-401 (2013).
- Rivas, G., Lopez, A., et al. Magnesium-induced linear self-association of the FtsZ bacterial cell division protein monomer. The primary steps for FtsZ assembly. J. Biol. Chem. 275 (16), 11740-11749 (2000).
- Oliva, M. A., Cordell, S. C., Lowe, J. Structural insights into FtsZ protofilament formation. Nat. Struct. Mol. Biol. 11 (12), 1243-1250 (2004).
- Lowe, J., Amos, L. A. Crystal structure of the bacterial cell-division protein FtsZ. Nature. 391 (6663), 203-206 (1998).
- Cordell, S. C., Robinson, E. J., Lowe, J. Crystal structure of the SOS cell division inhibitor SulA and in complex with FtsZ. Proc. Natl. Acad. Sci. U.S.A. 100 (13), 7889-7894 (2003).
- Chen, Y., Anderson, D. E., Rajagopalan, M., Erickson, H. P. Assembly dynamics of Mycobacterium tuberculosis FtsZ. J. Biol. Chem. 282 (38), 27736-27743 (2007).
- White, E. L., Ross, L. J., Reynolds, R. C., Seitz, L. E., Moore, G. D., Borhani, D. W. Slow polymerization of Mycobacterium tuberculosis FtsZ. J. Bacteriol. 182 (14), 4028-4034 (2000).
- Oliva, M. A., Trambaiolo, D., Lowe, J. Structural insights into the conformational variability of FtsZ. J. Mol. Biol. 373 (5), 1229-1242 (2007).
- Thanbichler, M., Shapiro, L. M. ipZ. a spatial regulator coordinating chromosome segregation with cell division in Caulobacter. Cell. 126 (1), 147-162 (2006).
- Buske, P. J., Levin, P. A. Extreme C terminus of bacterial cytoskeletal protein FtsZ plays fundamental role in assembly independent of modulatory proteins. J. Biol. Chem. 287 (14), 10945-10957 (2012).
- Mukherjee, A., Lutkenhaus, J. Analysis of FtsZ assembly by light scattering and determination of the role of divalent metal cations. J. Bacteriol. 181 (3), 823-832 (1999).
Reprints and Permissions
