Levels of the inflammatory cell-signaling molecule nitric oxide (NO) are commonly assayed using Griess reagent. In this protocol, we have created a modified Griess assay utilizing live Drosophila brain tissue in order to detect the secretion of NO in a simple, quantifiable and highly repeatable method.
Method Article
Novel Whole-tissue Quantitative Assay of Nitric Oxide Levels in Drosophila Neuroinflammatory Response
In This Article
Summary
Abstract
Neuroinflammation is a complex innate immune response vital to the healthy function of the central nervous system (CNS). Under normal conditions, an intricate network of inducers, detectors, and activators rapidly responds to neuron damage, infection or other immune infractions. This inflammation of immune cells is intimately associated with the pathology of neurodegenerative disorders, such as Parkinson's disease (PD), Alzheimer's disease and ALS. Under compromised disease states, chronic inflammation, intended to minimize neuron damage, may lead to an over-excitation of the immune cells, ultimately resulting in the exacerbation of disease progression. For example, loss of dopaminergic neurons in the midbrain, a hallmark of PD, is accelerated by the excessive activation of the inflammatory response. Though the cause of PD is largely unknown, exposure to environmental toxins has been implicated in the onset of sporadic cases. The herbicide paraquat, for example, has been shown to induce Parkinsonian-like pathology in several animal models, including Drosophila melanogaster. Here, we have used the conserved innate immune response in Drosophila to develop an assay capable of detecting varying levels of nitric oxide, a cell-signaling molecule critical to the activation of the inflammatory response cascade and targeted neuron death. Using paraquat-induced neuronal damage, we assess the impact of these immune insults on neuroinflammatory stimulation through the use of a novel, quantitative assay. Whole brains are fully extracted from flies either exposed to neurotoxins or of genotypes that elevate susceptibility to neurodegeneration then incubated in cell-culture media. Then, using the principles of the Griess reagent reaction, we are able to detect minor changes in the secretion of nitric oxide into cell-culture media, essentially creating a primary live-tissue model in a simple procedure. The utility of this model is amplified by the robust genetic and molecular complexity of Drosophila melanogaster, and this assay can be modified to be applicable to other Drosophila tissues or even other small, whole-organism inflammation models.
Introduction
Neuroinflammation is an intricate immune response that has been shown to be intimately associated with the pathology of a wide range of diseases, the majority of which are neurodegenerative disorders. Under basal conditions, this multifaceted network of peripatetic immune cells maintains tissue health through its rapid response to infection, plaques, or injury1,2. A neuroinflammatory response by the mammalian central nervous system can be triggered due to minor insults, such as cellular oxidative stress associated with normal aging, or major assaults, such as neuron damage occurring from acute exposure to a chemical toxin. When this induction occurs, phagocytic surveillance cells known as microglia are activated and migrate to the site of neuronal cellular damage. These scavenger-like immune cells, which are similar to macrophage cells that exists in the periphery, then begin a sophisticated signaling cascade with the damaged neuron, as well as with astrocytes, supporting glial cells that act alongside microglia for the typically robust microglial response3-7. Once activated, the microglia begin a process of inflammation to stimulate the immune system and promote tissue repair1,8.
Under conditions of sustained insult, as in neurodegenerative diseases such as Parkinson's disease (PD), Alzheimer's disease and amyotrophic lateral sclerosis, chronic inflammation causes significant damage to healthy tissue as well. Recent studies have shown that this persistent, aggressive response by the immune system may in fact be leading to an over-excitatory reaction that exacerbates the disease state rather than ameliorating the condition9-11.
In Drosophila melanogaster, the innate immune response is genetically well-conserved. Although lacking a true adaptive immune network, Drosophila maintains a sophisticated innate immune system containing a class of phagocytes known as hemocytes. These immune cells have been previously identified as macrophage-like cells that migrate to the site of injury12,13, and undergo phagocytosis during septic shock14, introduction of a parasite15, or viral infection16.
Importantly, like mammalian macrophages, phagocytic hemocytes express nitric oxide synthase (NOS) and produce nitric oxide (NO), a critical signaling component of Drosophila immunity15,16. All of these studies, however, have only been able to demonstrate hemocyte responses during embryonic development and in larva.
Our lab has observed a robust, hemocyte-mediated neuroinflammation in Drosophila adult brains, a previously unknown phenomenon17. This response was induced through exposure to the toxicant paraquat. Epidemiological studies by the National Institutes of Health have identified the widely-used herbicide as a potential risk factor in the onset of PD in humans18. Research investigating paraquat treatment in mammalian models had already validated its neurotoxic properties and had shown the herbicide to result in Parkinsonian symptoms, such as motor abnormalities and selective neuron loss19-21. In Drosophila, treatment of paraquat leads to a wide range of Parkinsonian behavioral phenotypes as well as dopaminergic neuron death consistent with PD pathology22. Though the mechanisms and genetic factors associated with this neuroinflammatory response have not yet been fully elucidated in Drosophila, we have observed a conserved induction of NOS during neurodegeneration.
Using this method, we have additionally detected a similar, albeit less dramatic, neuroinflammatory response using mutant genotypes with known neurotoxic sensitivity. Encoded by the gene Punch, GTP cyclohydrolase is the first and rate-limiting protein in the biosynthesis of BH4, which then acts as a necessary cofactor for NOS23,24. The loss-of-function mutation PuZ22 causes a decline in the inflammatory response and heightened susceptibility to paraquat25. With this protocol, we were able to quantify relatively subtle modifications of nitric oxide levels induced by this genetic variation.
To detect NO in our samples we use Griess reagent, a widely-accepted colorimetric method for measuring NO levels. This reagent indirectly measures relative NO abundance by detecting the presence of nitrites, one of two end products of nitric oxide production. The existing nitrite detection protocols using Griess reagent have been applied primarily for in vitro analyses or in cell culture, where NO diffuses into the culture medium. We initially developed a Griess reagent-based method for detecting NOS in crude Drosophila head homogenates25. We have, however, found that method to be somewhat variable with altered conditions, presumably due to the instability, high reactivity and low relative concentration of NO in whole head tissues. Therefore, we sought to develop a method based on cell culture protocols that would allow for greater sensitivity and reliability in quantifying NOS activity. Here we describe a method conceptually similar to one previously employed to detect NOS in Drosophila larval Malpighian tubules26. In this procedure, we utilize whole brains that were dissected immediately following a toxin treatment to induce the inflammatory response. Then, we incubated these samples in insect culture medium to preserve the integrity of the tissue, and to enhance the sensitivity and reliability of a Griess reagent-based assay.
We anticipate that, with the use of the sophisticated genetic tools available, this model has the capacity to serve as a promising utility for investigating the dynamic inflammation/neurodegeneration network. With the ability to accurately quantify the activation and relative intensity of the neuroinflammatory response, this novel assay creates a primary tissue culture capable of detecting secreted neuroinflammatory markers. This method offers small organism models of inflammation an inexpensive, highly sensitive technique for rapidly assaying whole-organism or live-tissue samples where previously lacking.
Protocol
1. Paraquat Exposure
- Maintain the cultures of the test flies on standard Drosophila culture medium at 25 °C under equivalent culture densities consisting of approximately 35 females and 15 males.
- To prepare feeding chambers, place a small amount of absorbent cotton at the bottom of an empty vial with filter paper directly above the cotton.
- Anesthetize adult male flies 3-5 days posteclosion using cold coma or CO2. For the experiments described here, use males of genotype y w1118.
- For cold coma separation, tap down feeding vials containing flies and then quickly remove stopper and transfer flies directly to a clean, empty vial, making sure to label properly.
- Once flies are successfully transferred to empty food vials, tap down vials then immediately place in ice bucket for 5 min or until flies are knocked out.
Note: Do not completely submerge vial in ice. This can cause water or moisture to get into the vial and drown the flies. As another precaution, use fresh ice rather than melted ice in ice buckets.
Note: Pay close attention to the number of flies needed for each assay and, when possible, add additional flies to each group as a precaution in the event of human error, e.g. flies escaping during feeding or transferring. The nitric oxide detection assay, for example, requires 20 fly brains per sample set, so account for dissection skill-level and efficiency when feeding (i.e. novices should set up more than 20 flies in case of transferring or dissection errors).
- Once flies are anesthetized, transfer each group into corresponding feeding vial as prepared above.
- After the flies are fully awake in feeding vials, starve them for 1.5 hr and meanwhile, prepare solutions described below:
- Prepare a stock solution of 5% sucrose (control solution) by adding 5 g of sucrose into 100 ml of double-distilled water. Stir until completely dissolved and store at 4 °C.
Note: Use 5% sucrose stock solution as the solvent for all subsequent feeding solutions. - Prepare stock 10 mM paraquat stock solution using 5% sucrose as diluent and stored at 4 °C. Prepare all other concentrations using serial dilutions as needed.
CAUTION: PARAQUAT IS EXTREMELY TOXIC. REFER TO MSDS FOR SAFETY GUIDELINES AND PROPER HANDLING/DISPOSAL. - Prepare 10 mM stock solutions of N-Nitro-L-arginine methyl ester hydrochloride (L-NAME), N-nitro-D-arginine methyl ester hydrochloride (D-NAME) using 5% sucrose as diluent and store at 4 °C. For coincubations of L-NAME or D-NAME with paraquat administer each compound at a 1:1 ratio with paraquat concentration. Prepare all other concentrations using serial dilutions as needed.
Note: Filter all solutions directly after preparation. Paraquat, D-NAME, and L-NAME stocks should be used within one week of preparation to ensure experimental consistency. - Pipette 150 μl per day (or less depending on feeding duration) of the feeding solution onto the filter paper, being careful not to drown flies or let any escape.
- Prepare a stock solution of 5% sucrose (control solution) by adding 5 g of sucrose into 100 ml of double-distilled water. Stir until completely dissolved and store at 4 °C.
2. Survival/Mortality Assay
- Set up feeding chambers as previously described.
Note: Use at least 3 layers of filter paper per vial to prevent desiccation. - Place 10 male flies 3-5 days posteclosion in each vial and feed as directed above, being cautious to not let the filter paper dry out overnight.
Note: Maintain vials at room temperature, away from direct sunlight to avoid accelerating evaporation of solutions. - Beginning the following day (designated "Day 1"), record number of flies dead per vial twice a day for 10 consecutive days.
Note: Regulate both scoring and feeding to specific hours each day to decrease variation and provide higher consistency. - Calculate average survival using at least three independent replications of all groups.
3. Dissecting Adult Fly Brains and Incubation
- Prior to dissections, pipette 50 μl of Grace's Insect Medium into the appropriate number of wells (one well for each sample set + one for the "blank"/control) in a 96-well microtiter plate and label suitably. Cover with plate lid until use.
Note: Alternatively, sterile centrifuge tubes may also be used if preferred. - Anesthetize flies of one sample set using cold coma as described in steps 1.3.1-1.3.2.
- Once flies are fully anesthetized, place several flies on a microscope slide
Note: Begin with a small subset of flies if not experienced with dissections. - Decapitate the fly heads under a dissection microscope using forceps and a surgical blade or two forceps, discarding fly bodies when done.
- Use a small amount of PBS as a dissection buffer; desiccation must be avoided.
- Extract the full brain following the method of Williamson & Hiesinger (2010)27, carefully removing cuticle particulates and any non-brain tissue (e.g. eye pigment tissue) (See Figure 1).
- Transfer the dissected brain into the appropriately-labeled well and repeat until there is a minimum of 20 brains per well.
- Keep plates on ice during dissection period and do not exceed longer than 20-30 min total time between the start of dissecting and assay initiation.
Note: More than 20 brains can be used so long as each group has the same number in each well. Minimum number of brains to achieve accurate reading may vary (refer to Discussion section for more detail). - Once working set is complete, allow brains to incubate for 6 hr in 25 °C with light shaking.
- Follow steps 1.2-1.6 for all remaining groups.
Note: Record and adjust end time of incubation depending on differentials between when each sample set was completed.
4. Preparation During Incubation Period
- Prepare the Modified Griess reagent as directed by the manufacturer (see table) and keep in the dark until use. The amount of reagent needed is dependent on the amount of samples. For example, the Griess reagent will be added in a 1:1 ratio to the Grace's Medium (step 5.5). Therefore, 50 μl per sample set + 50 μl for the blank control should be prepared.
- Construct a nitrite standard curve using sodium nitrite in a serial dilution ranging from 0.78125-100 mM nitrite for a total of 8 concentrations.
Note: This should be done for each experiment to ensure consistency and accuracy in sample concentration and Griess Reagent activity. - Additionally, prepare and label sterile 0.5 ml centrifuge tubes, two tubes for each treatment group and two for the control.
5. Detection of Nitrite Levels
- Once the incubation period has ended, transfer the Grace's Medium (at least 45 μl) from the microtiter wells into the first set of centrifuge tubes corresponding to each group.
Note: As previously noted, be sure to account for differences in incubation periods due to time taken between each set of dissections. - Optional Step: Add nitrate reductase and NADPH at this step to convert nitrates to nitrites. (This step was not carried out on the results shown)
Note: A nitrate/nitrite assay may be conducted if desired with an aliquot of sample supernatant as described in assay kits. - Gently centrifuge (around 8,175 x g) for 2 min to pellet any brain or tissue particulates that may have been aspirated from the wells.
- Pipette 30 μl of the supernatant from the first set of centrifuge tubes into the second set of corresponding tubes, making sure not to disrupt the pellet after spinning down the samples.
- Add Griess reagent in a 1:1 ratio, incubate for 5-10 min and assay using NanoDrop spectrophotometer at 548 nm absorbance within 30 min.
Note: Samples can also be assayed using a microplate reader at an absorbance wavelength of 540 nm with 620 nm reference wavelength. - Repeat each reading a minimum of three times and average the readouts.
Note: Be sure to "blank" the machine between every 6-10 readings and before completion, run the blank control (Grace's Medium plus Griess reagent without brains) as a sample to use as a standard deviation. - Use the nitrite standard curve generated in step 4.2 to calculate relative nitrite levels of each sample.
- To calculate unknown concentrations, first plot the values of the known concentrations from the standard curve using absorbance (i.e. optical density) on the y axis and concentration on the x axis.
- Once all standard curve values are graphed, find the slope of the best fit line and solve the equation for x.
Note: If serial dilutions are done properly, the best fit line should be linear or very close to it. If this is not the case, reconstruct standard curve. If problems persist, check all solutions, media and reagents for expiration and be sure equipment is working properly and within its range of detection. - Next, simply substitute the absorbance values for y and solve for x, which represents concentration.
For additional information regarding the use of NanoDrop equipment, refer to Desjardins et al. 2009 and Desjardins & Conklin, 201028,29.
6. Western Blot
- Feed 30 flies per condition as described above and decapitate heads, preferably using liquid nitrogen and vortexing.
- Homogenize whole heads on ice in 60 μl RIPA buffer with 2 mM dithiothreitol (DTT) and 1x protease inhibitor cocktail added just before use.
- Spin down samples for 5 min at 8,175 x g in 4 °C.
- Transfer supernatant to new centrifuge tubes.
- Mix samples gently and pipette 17 μl of supernatant into centrifuge tubes containing 6.5 μl 4x LDS sample buffer and 2.5 μl 500 mM DTT.
Note: Flash frozen remaining sample in liquid nitrogen and stored in -20 °C until use. - Mix samples well and heat at 70 °C for 10 min, mixing once midincubation.
- While heating, assemble polyacrylamide gel electrophoresis (PAGE) running apparatus using precast 4-12% NuPage Bis-Tris minigel, MOPS SDS running buffer with 500 μl antioxidant in inner chamber.
- Quick spin samples and allow to cool.
- Load 25 μl into each lane.
- Run the gel electrophoresis at 200 V on ice or in 4 °C for 45 min or until gel is complete.
- Once electrophoresis is completed, transfer separated proteins from the gel to nitrocellulose membranes using iBlot Transfer Stacks and detect signal using Western Blot Detection Kit.
Note: Antibodies used are as followed: primary antibodies mouse α-nNOS (1:250), mouse α-syntaxin (1:200); secondary antibodies (1:250) provided in Western Blot Detection Kit (mouse). - Detect chemiluminescent signal using western blot imaging system or X-ray film.
Note: Any standard immunoblot detection and quantification methods can be used for blot analysis.
Results
Paraquat has been shown in numerous animal models, such as mice19, rats20 and fruit flies22, to induce neurological degeneration consistent with Parkinsonian-like pathology. We have previously reported that the anti-inflammatory antibiotic minocycline, when cofed with paraquat, results in extended survival, reduced production of reactive oxygen species and rescue of dopaminergic neuron death25. Therefore, as minocycline acts to suppress inflammation, we began investigating NOS, a key protein in the activation of the inflammatory response, and its role in modulating paraquat toxicity.
A paraquat toxicity curve was performed to establish an effective lethal dose and toxic treatment range, using paraquat concentrations between 1.25 and 10 mM (Figure 2A). We also assayed the effects of paraquat concentrations of 20 mM and 40 mM, but found that toxicity was too acute at these higher concentrations to accurately assess cellular responses to this oxidative stressor, and therefore, we have not included the results for these concentrations in this report. Using L-NAME, a competitive NOS inhibitor, and D-NAME, the inactive isomer of NAME, we cotreated adult male flies with paraquat and one of the NAME isomers. Cotreatment of flies with paraquat and L-NAME resulted in a significant rescue of lifespan truncation caused by paraquat ingestion, while flies cotreated with paraquat and D-NAME showed no improvement in survival (Figure 2B), supporting the hypothesis that suppressing inflammation through the inhibition of NOS enhanced survival of paraquat-treated flies.
As further validation of a NOS-mediated paraquat response, we detected changes in NOS protein levels directly after paraquat exposure. NOS protein levels increased in a paraquat concentration-dependent manner (Figure 3A). When treating flies with 10 mM paraquat over exposure durations ranging from 6-30 hr, we observed an initial increase, then a decrease as exposure time increased (Figure 3B), consistent with the patterns of nitrite levels observed in our variant of the Griess assay (Figure 5B). These results are consistent with our reports that paraquat treatment causes induction of NOS and that inhibition of NOS or treatment with L-NAME or minocycline provides partial protection17,25.
Figure 4A demonstrates a linear relationship between the increase in paraquat concentration and the magnitude of the inflammatory response as defined by the secretion and detection of NO. Under basal levels, heterozygous Punch mutants secreted slightly lower levels of NO, a variation too indiscernible to be determined using previous detection methods. When fed paraquat, a pronounced increase in NO levels were observed in the Punch mutant, however, significantly less than the wildtype treated flies (Figure 4B). The relative values of the wildtype and Punch flies can be accurately and reproducibly quantified, though the variation at untreated levels were extraordinarily subtle.
When working with toxins or chemicals, it is vital to establish both a time-of-exposure curve as well as a concentration-based toxicity curve, since these conditions can dramatically alter the sensitivity of the assay. For example, treatment with 5 mM paraquat results in maximum NO detection after 24 hr of exposure (Figure 5A), while exposure to 10 mM paraquat resulted in more rapid induction (maximum levels at 12 hr), but also more rapid decay of activity during extended exposures (Figure 5B). Although a higher concentration with quick induction might seem preferable, a maximized response accelerates death of both neurons and possibly hemocytes to the point that reproducibility may become difficult.
NO molecules are unstable and highly reactive. A successful assay must therefore include incubation conditions that provide an optimal balance between continued induction of NOS and rapid turnover of NO. In order to define optimal incubation conditions, we assessed the effect of the time that dissected brains were incubated in the culture medium prior to adding the Griess reagent. We found that a 6 hr incubation at room temperature produced maximum nitrite levels in the subsequent Griess reaction (Figure 5C) .We expect that variations in the incubation period may be needed to optimize detection for various models of inflammation. Careful establishment of all optimal parameters for the particular organism, genotype, and tissue being assayed, will be essential to achieve reliable and accurate results since the process is highly dynamic. In particular, genetic variants and transgene expression models are expected to require substantial optimization, particularly with respect to developmental stage or age of adults.
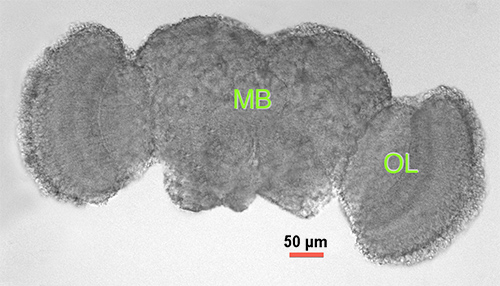
Figure 1. Drosophila adult brain. Light microscopy of dissected adult male brain 2-3 days posteclosion. MB = midbrain (central cortex), OL = optic lobe.
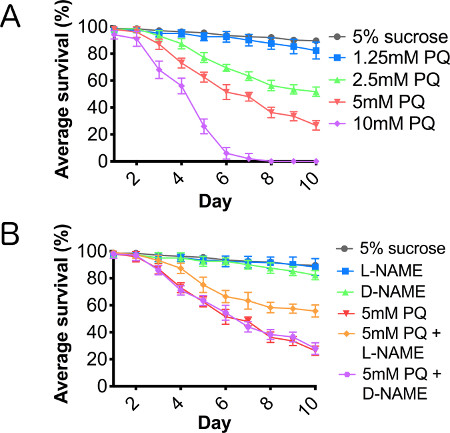
Figure 2. Paraquat results in a dose-dependent reduction in lifespan, mediated through nitric oxide synthase. Wild type male flies fed (A) 5% sucrose (control), and serial dilution of paraquat ranging from 1.25-10 mM concentration in 5% sucrose and (B) cofed paraquat with L-NAME or D-NAME for 10 consecutive days. N = 3 groups of 10. Error bars = SEM.
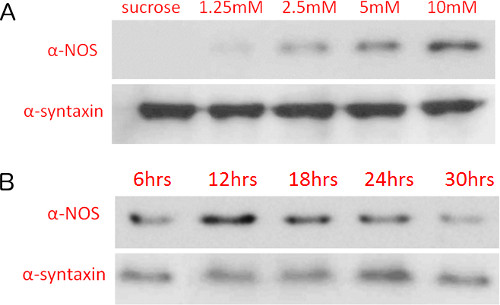
Figure 3. Nitric oxide synthase protein levels increase with paraquat concentration and length of exposure. Immunoblot detection of nitric oxide synthase levels of flies treated with varying (A) paraquat concentrations (12 hr exposure) and (B) 10 mM paraquat with varying exposure durations. Protein levels were detected on nitrocellulose membranes using chemiluminescence and X-ray film exposure.
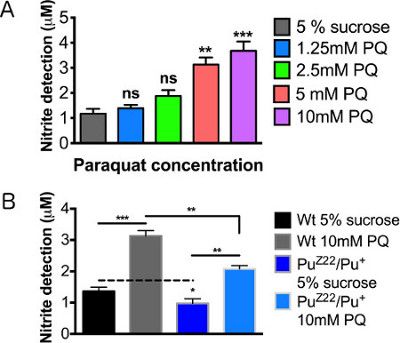
Figure 4. Nitric oxide detection levels after paraquat exposure. Male wild type (WT) flies 2-3 days posteclosion were assayed following 12 hr feeding. (A) Concentration curve of paraquat concentrations. (B) Male Punch heterozygous mutants fed sucrose control and 10mM paraquat. N = 20 brains/group. Results represent 3 replications per group. Error bars = SEM. Statistical analyses were performed using one-way ANOVA with Dunnett's Multiple Comparison posttest (*, p < 0.05, **, p < 0.01, ***, p < 0.001).

Figure 5. Optimizing the detection of nitric oxide production by altering the length of paraquat exposure and time of tissue incubation. Relative nitric oxide levels on male brains 2-3 days posteclosion following 12 hr treatment of (A) 5 mM paraquat and (B) 10 mM paraquat. (C) NO curve using varying tissue incubations periods following 12 hr, 10 mM paraquat feeding. Significance values were calculated relative to the following: (A, B) 5% sucrose controls for each exposure time (not shown in graph), (C) 5% sucrose controls for each incubation time (not shown in graph). N = 20 brains/group. Results represent 3 replications per group. Error bars = SEM. Statistical analyses were performed using one-way ANOVA with Dunnett's Multiple Comparison posttest (*, p<0.05, **, p<0.01, ***, p<0.001).
Discussion
This method, though simple in approach, provides a cost-efficient, highly repeatable and exceedingly sensitive method for quantifying levels of NOS-mediated neuroinflammation. As shown in the Results section, there are many variables that can be adjusted to enhance or optimize the response in different induction models or organisms. Because this is a highly sensitive system, however, these variables may also result in highly variable outcomes if all aspects of the protocol are not handled carefully. When first testing using any model, we recommend setting up the parameters by testing variables, which include chemical concentration (Figure 4A), length of exposure (Figures 5A and 5B), and incubation duration (Figure 5C). Be mindful of other variables, such as the number of brains/tissue samples needed to achieve detection threshold and consistency, even when applying this method to similar Drosophila models. Additionally, in age-dependent genetic models of inflammation, extended time point optimization will be needed.
As mentioned above, due to the sensitive nature of the assay, inconsistencies in the protocol can yield unreliable results. With this in mind, all equipment and materials were sterilized prior to use. Due to the short incubation time, no antibiotics were added to the culture media in these experiments. However, if the protocol is adapted for longer incubation times or if bacterial growth is observed in cultures or media, typical culture antibiotics such as penicillin-streptomycin should be added and equipment should be re-sterilized. As in any chemical treatment experiments caution should be used to ensure that all groups are reared under well-controlled conditions, gender and age matched, and all groups receive exactly the same feeding conditions. Some example feeding conditions to consider include variations in concentrations, availability and access to feeding source, duration of feeding and the time of the day that the feeding is administered. Detailed records for all experimental conditions and close attention to the natural feeding patterns of your model will help minimize variability. If mutant or transgenic strains that affect neural circuitry or behavioral patterns are employed an important control would include monitoring of feeding behavior.
Once again, while similar protocols are available in cell culture and lysates, one major advantage of this method is that the integrity of the tissue is maintained, therefore allowing virtually all cellular relationships within the brain to remain intact. This system represents a relatively natural, in vivo state of neuroinflammatory signaling and cellular secretion. Established in Drosophila, this technique can be easily tailored to other small model organisms, and is not limited to the central nervous system, as demonstrated by a similar application for NO signaling in a Malpighian tubule model for kidney function26. The most significant advantage by far of this protocol is the ability to manipulate and adapt this assay to fit the needs and interests of the researcher or model system.
Through the use of combination chemical-genetic approaches, this assay has the potential to significantly enhance the ability of small model systems to investigate the mechanisms, genetic components and chemical modulators of inflammation.
Disclosures
The authors declare no competing financial interests.
Acknowledgements
We thank Dr. Guy and Dr. Kim Caldwell for the use of their NanoDrop spectrophotometer during the development of this assay and J. Gavin Daigle for his critical comments and suggestions. The development of this method was funded by a grant from the National Institutes of Health (NS-078728) to J.M.O.
Materials
| Name | Company | Catalog Number | Comments |
|---|---|---|---|
| Feeding Chambers | |||
| Empty Drosophila vial | Genesee Scientific | #32-116 | |
| Absorbent cotton | Any standard product can be used. | ||
| Filter paper | Fisher | #09-802-1B | |
| Paraquat exposure | |||
| Sucrose | Sigma-Aldrich | #S0389 | |
| Paraquat (methyl viologen dichloride hydrate) | Sigma-Aldrich | #856177 | Toxic. Handle with Care and within MSDS guidelines |
| L-NAME (N-Nitro-L-arginine methyl ester hydrochloride) | Sigma-Aldrich | #N5751 | |
| D-NAME (N-Nitro-D-arginine methyl ester hydrochloride) | Sigma-Aldrich | #N4770 | |
| Dissecting Adult Fly Brains and Incubation | |||
| Grace's Insect Medium | Invitrogen | #11605-094 | Grace's Medium may also be substituted for Sf-900 II SFM or Sf-900 III SFM Medium for higher lot-to-lot consistency. |
| 96-well plate | Corning | #3596 | Any standard product can be used. |
| Microscope slide | Any standard product can be used. | ||
| Surgical blade | Feather | #0197 | Any standard product can be used. |
| Medical Tweezers 5 | Dumont | EMS #72877-D | Any standard product can be used. |
| 10x PBS buffer | OmniPur | #6508 | |
| Detection of Nitrite Levels | |||
| Modified Griess reagent | Sigma-Aldrich | #4410 | |
| Sodium nitrite | Sigma-Aldrich | #S2252 or #237213 | |
| Protein Assay Kit | Bio-Rad | 500-0001 | |
| Cuvettes | Any standard product can be used. | ||
| Nitrate reductase | optional | ||
| NADPH | optional | ||
| Western Blot Analysis | |||
| RIPA lysis buffer | Amresco | 97063-270 | |
| dithiothreitol (DTT)- Reducing agent | Novex | B0009 | |
| Protease inhibitor cocktail | Amresco | 97063-082 | |
| 4x LDS sample buffer | Novex | B0007 | |
| Precast 4-12% Bis-Tris minigel | Novex | BG04125BOX | |
| MOPS SDS running buffer | Novex | B0001 | |
| Antioxidant | NuPage | NP0005 | |
| iBlot Transfer Stacks (Nitrocellulose) | Invitrogen | IB301002 | |
| Western blot detection kit | Invitrogen | IB711002 | |
| Mouse α-nNOS | BD Biosciences | 611853 | |
| Mouse α-syntaxin | DSHB | 8C3 |
References
- Gehrmann, J., Matsumoto, Y., Kreutzberg, G. W. Microglia: Intrinsic immuneffector cell of the brain. Brain Res. Rev. 20, 269-287 (1995).
- Dissing-Olesen, L., et al. Axonal lesion-induced microglial proliferation and microglial cluster formation in the mouse. Neuroscience. 149, 112-122 (2007).
- Aloisi, F., Penna, G., Cerase, J., Menendez Iglesias, B., Adorini, L. IL-12 production by central nervous system microglia is inhibited by astrocytes. J. Immunol. 159, 1604-1612 (1997).
- Vincent, V. A., Tilders, F. J., Van Dam, A. M. Inhibition of endotoxin-induced nitric oxide synthase production in microglial cells by the presence of astroglial cells: a role for transforming growth factor beta. Glia. 19, 190-198 (1997).
- Rohrenbeck, A. M., et al. Upregulation of COX-2 and CGRP expression in resident cells of the Borna disease virus-infected brain is dependent upon inflammation. Neurobiol. Dis. 6, 15-34 (1999).
- Walsh, D. T., Perry, V. H., Minghetti, L. Cyclooxygenase-2 is highly expressed in microglial-like cells in a murine model of prion disease. Glia. 29, 392-396 (2000).
- Aloisi, F., Serafini, B., Adorini, L. Glia-T cell dialogue. J. Neuroimmunol. 107, 111-117 (2000).
- Minghetti, L., Levi, G. Microglia as effector cells in brain damage and repair: focus on prostanoids and nitric oxide. Prog. Neurobiol. 54, 99-125 (1998).
- Mrak, R. E., Griffin, W. S. T. Glia and their cytokines in progression of neurodegeneration. Neurobiol. Aging. 26, 349-354 (2005).
- Zhang, W., et al. Aggregated alpha-synuclein activates microglia: a process leading to disease progression in Parkinson's disease. FASEB J. 19, 533-542 (2005).
- Beers, D. R., et al. Neuroinflammation modulates distinct regional and temporal clinical responses in ALS mice. Brain Behav. Immun. 25, 1025-1035 (2011).
- Wood, W., Faria, C., Jacinto, A. Distinct mechanisms regulate hemocyte chemotaxis during development and wound healing in Drosophila melanogaster. J. Cell Biol. 173, 405-416 (2006).
- Babcock, D. T., et al. Circulating blood cells function as a surveillance system for damaged tissue in Drosophila larvae. Proc. Natl. Acad. Sci. U.S.A. 105, 10017-10022 (2008).
- Vlisidou, I., et al. Drosophila embryos as model systems for monitoring bacterial infection in real time. PLoS Pathog. 5, e1000518(2009).
- Foley, E., O'Farrell, P. H. Nitric oxide contributes to induction of innate immune responses to gram-negative bacteria in Drosophila. Genes Dev. 17, 115-125 (2003).
- Costa, A., Jan, E., Sarnow, P., Schneider, D. The Imd pathway is involved in antiviral immune responses in Drosophila. PloS One. 4, e7436(2009).
- Daigle, J. G. Integrated microglial-like neuroinflammatory and hypoxia responses in a Drosophila model for Parkinson's disease. , in preparation Forthcoming.
- Tanner, C. M., Kamel, F., Ross, G. W., Hoppin, J. A., Goldman, S. M., Korell, M., Marras, C., Bhudhikanok, G. S., Kasten, M., et al. Rotenone, Paraquat and Parkinson's Disease. Environ. Health Perspect. 119 (6), 866-8672 (2011).
- Manning-Bog, A. B., McCormack, A. L., Li, J., Uversky, V. N., Fink, A. L., Di Monte, D. A. The herbicide paraquat causes up-regulation and aggregation of alpha- synuclein in mice: paraquat and alpha-synuclein. J. Biol. Chem. 277, 1641-1644 (2002).
- Ossowska, K., Wardas, J., Smialowska, M., Kuter, K., Lenda, T., Wieronska, J. M., Zieba, B., Nowak, P., Dabrowska, J., Bortel, A., et al. A slowly developing dysfunction of dopaminergic nigrostriatal neurons induced by long-term paraquat administration in rats: An animal model of preclinical stages of Parkinson's disease. Eur. J. Neurosci. 22, 1294-1304 (2005).
- McCormack, A. L., et al. Role of oxidative stress in paraquat-induced dopaminergic cell degeneration. J. Neurochem. 93, 1030-1037 (2005).
- Chaudhuri, A., et al. Interaction of genetic and environmental factors in a Drosophila parkinsonism model. J. Neurosci. 27, 2457-2467 (2007).
- Krishnakumar, S., Burton, D., Rasco, J., Chen, X., O'Donnell, J. Functional interactions between GTP cyclohy- drolase I and tyrosine hydroxylase in Drosophila. J. Neurogenet. 14 (1), 1-23 (2000).
- Foxton, R. H., Land, J. M., Heales, S. J. R. Tetrahydro- biopterin availability in Parkinson's and Alzheimer's disease; potential pathogenic mechanisms. Neurochem. Res. 32 (4-5), 751-756 (2007).
- Inamdar, A. A., Chaudhuri, A., O'Donnell, J. The Protective Effect of Minocycline in a Paraquat-Induced Parkinson's Disease Model in Drosophila is Modified in Altered Genetic Backgrounds. Parkinson's Disease. 2012, 938528(2012).
- Kean, L., Cazenave, W., Costes, L., Broderick, K. E., Graham, S., Pollock, V. P., Davies, S. A., Veenstra, J. A., Dow, J. A. Two nitridergic peptides are encoded by the gene capability in Drosophila melanogaster. Am. J. Phys. Reg. Integr. Comp. Phys. 282, R1297-R1307 (2002).
- Williamson, W. R., Hiesinger, P. R. Preparation of Developing and Adult Drosophila Brains and Retinae for Live Imaging. J. Vis. Exp. (37), (2010).
- Desjardins, P., Hansen, J. B., Allen, M. Microvolume Protein Concentration Determination using the NanoDrop 2000c Spectrophotometer. J. Vis. Exp. (33), (2009).
- Desjardins, P., Conklin, D. NanoDrop Microvolume Quantitation of Nucleic Acids. J. Vis. Exp. (45), (2010).
Reprints and Permissions
