The established technique to inoculate primary invasive orthotopic bladder cancer xenografts requires laparotomy and mobilization of the bladder. This procedure inflicts significant morbidity on the mice, is technically challenging and time-consuming. We therefore developed a high-precision, percutaneous approach utilizing ultrasound guidance.
Method Article
Minimally Invasive Establishment of Murine Orthotopic Bladder Xenografts
In This Article
Summary
Abstract
Orthotopic bladder cancer xenografts are the gold standard to study molecular cellular manipulations and new therapeutic agents in vivo. Suitable cell lines are inoculated either by intravesical instillation (model of nonmuscle invasive growth) or intramural injection into the bladder wall (model of invasive growth). Both procedures are complex and highly time-consuming. Additionally, the superficial model has its shortcomings due to the lack of cell lines that are tumorigenic following instillation. Intramural injection, on the other hand, is marred by the invasiveness of the procedure and the associated morbidity for the host mouse.
With these shortcomings in mind, we modified previous methods to develop a minimally invasive approach for creating orthotopic bladder cancer xenografts. Using ultrasound guidance we have successfully performed percutaneous inoculation of the bladder cancer cell lines UM-UC1, UM-UC3 and UM-UC13 into 50 athymic nude. We have been able to demonstrate that this approach is time efficient, precise and safe. With this technique, initially a space is created under the bladder mucosa with PBS, and tumor cells are then injected into this space in a second step. Tumor growth is monitored at regular intervals with bioluminescence imaging and ultrasound. The average tumor volumes increased steadily in in all but one of our 50 mice over the study period.
In our institution, this novel approach, which allows bladder cancer xenograft inoculation in a minimally-invasive, rapid and highly precise way, has replaced the traditional model.
Introduction
Cancer research is dependent on animal models of human cancer using cell lines derived from patient tumors in order to deepen our understanding of tumor biology. For in vivo growth analysis under different treatment strategies murine orthotopic bladder cancer models remain the reference standard1,2. The inoculation of human bladder cancer cells in immunocompromised mice (xenograft model) relies on intravesical instillation (“intravesical model”)3,4,5 or direct injection into the bladder wall (“intramural model”)6,7. Both techniques can also be performed in rats8,9.
Intravesical instillation induces the formation of tumors on the urothelial surface of the bladder which then are amenable to subsequent intravesical instillation of novel treatment agents. However, the number of cell lines which are reliably tumorigenic when delivered via this method is limited and one of those cell lines, KU7, has recently been demonstrated to be HeLa4,10. Intravesical instillation is also time consuming due to necessary dwell times, and it frequently induces tumor growth in adjacent elements of the urinary tract, including urethra, ureter, and renal pelvis11. Furthermore, intravesical instillation often leads to tumor growth on the floor of the bladder where the ureters enter the bladder, and this can cause upper tract obstruction and concomitant renal failure.
Primary invasive bladder cancer xenografts which are suitable for systemic treatments are created by direct injection of tumor cells into the bladder wall12. Although numerous cell lines grow adequately in this model, its limitation is the invasiveness of the model related to the need for an abdominal incision13. The model is also challenging to learn due to the technical difficulty of injecting cells precisely into the muscle wall of the bladder.
A novel approach to establish orthotopic primary invasive bladder cancer xenografts in mice has been developed in our department in order to address existing shortcomings of the “intramural model”. We were able to optimize the percutaneous, ultrasound-guided injection of bladder cancer cells into the anterior bladder wall resulting in this novel technique to successfully replace the established invasive model. Moreover we have potentially enhanced the accuracy and reproducibility of the “intramural model”.
Protocol
All animal procedures were performed according to the guidelines of the Canadian Council on Animal Care (CCAC). The protocol was approved by the Animal Care Committee of the University of British Columbia (Protocol Number: A10-0192).
1. Preparation of Cell Lines
- Confirm the identity of the respective human bladder cancer cell lines by DNA fingerprinting7.
- For growth analysis of xenograft tumors by bioluminescence, transfect cell lines with a lentiviral construct carrying the firefly luciferase gene3.
- Thaw and expand the existing cell lines in Dulbecco’s modified Eagle’s medium (DMEM) with 10% fetal bovine serum (FBS) at 37 °C in a humidified 5% CO2 atmosphere. Passage the cells at least 3x but avoid culture times exceeding 3 months.
2. Preparation of Cell Suspension
- Thaw Matrigel. Keep the temperature below 4 °C to avoid increased viscosity of the gel.
- Trypsinize the cells at a confluence of 70% and suspend in normal growth media.
- Count the cell number with a hemocytometer or automatic cell counter.
- Spin the cell suspension for 5 min at 200 x g. Remove the supernatant.
- Add the appropriate volume of DMEM (10% FBS) and Matrigel (1:1 ratio) in order to reach the desired cell concentration which is dependent on the utilized cell line and desired growth kinetics (8-15 x 106/ml). The injected volume of tumor cell suspension will be 40 µl.
- Mix well by pipetting up and down (P1000), avoid creating air bubbles in the suspension.
3. Preparation of Animals
Note: Due to the potential need for transurethral catheterization in step 4.7, female mice are the preferred gender in this animal model.
- House mice according to institutional and national animal care guidelines. Obtain ethics committee approval for all experiments involving mice.
- Anesthetize the mice with 3% isoflurane/oxygen mixture. Confirm proper anesthetization of animals (e.g. unresponsiveness to toe pinches).
4. Experimental Setup
- Cut the bladder stabilization from any kind of flat rigid plastic material [Figure 2 I]. Carefully inspect the strap and remove any sharp edges before application to the mice.
- Mount the animal on the heated imaging table [Figure 1 I] of the small animal imaging platform with continuous monitoring of vital signs. Fix the lower limbs with a rubber band [Figure 1 III].
- Disinfect the abdomen with 2% chlorhexidine gluconate and wipe the skin with a sterile cotton tip.
- Immobilize the bladder with the bladder stabilization strap [Figure 2 II]. Thus, an evasion of the bladder during intramural injection in step 5.6 will be avoided.
- Apply sterile ultrasound gel to the lower abdomen.
- Slowly approach the ultrasound scanhead (frequency 40 MHz) [Figure 1 IV] to the skin (longitudinal with a cranial angle of 45-70°) and visualize the bladder on the ultrasound screen [Figure 3 I].
- If the bladder is empty, fill it with 50 µl sterile, warm phosphate-buffered saline (PBS) through a transurethral 24 G angiocatheter.
5. Separation of Bladder Wall Layers
- Attach a 1.0 ml syringe filled with PBS and connected to a 30 G, ¾ in needle (bevel directed anteriorly) to the syringe clamp.
- Position the needle towards the skin just above the pubic bone in a 30-45° angle (80-90° relative to the longitudinal axis of the ultrasound scanhead [Figure 1]).
- Detect the needle on the ultrasound screen.
- Slowly perforate the skin and the abdominal wall muscles [Figure 3 II].
- Turn the bevel of the needle 180° (now directed posteriorly).
- Insert the tip of the needle into the bladder wall without penetrating the mucosa [Figure 3 III]
- Slowly inject 50 µl of PBS between the muscular layer and the mucosa in order to create an artificial space [Figure 3 IV].
Note: If the mucosa is accidently perforated during step 5.6, slowly pull back the needle and inject 50 µl of PBS after the mucosal layer has flipped back over the needle tip. - Withdraw the needle.
6. Intramural Inoculation of Bladder Cancer Cells
- Attach a second 1.0 ml syringe (filled with cancer cells suspended in Matrigel) with a 30 G, ¾ in needle to the syringe clamp.
- Guide the tip of the needle to the same PBS-filled space which was created in step 5.7.
- Inject 40 µl of the cell suspension into this space [Figures 3 V and VI].
- Withdraw the needle.
7. Post-interventional Supportive Care
- Dismount the mouse from the imaging platform.
- Keep the animal in a warm and comfortable environment under continuous surveillance while recovering from the anesthetic.
- After regaining consciousness and resuming normal ambulation, place the animal back in its home cage.
Results
Intramural injection of three different tumor cell lines (UM-UC1 luc, UM-UC3 luc and UM-UC13 luc) was performed in 50 animals under ultrasound-guidance on three consecutive days. The inoculation was performed efficiently (mean time 5.7 min/animal) and was not associated with any intra- or post-interventional complications.
Monitoring of tumor growth was performed by ultrasound imaging and bioluminescence. On day #3 a tumor could be detected by ultrasound in the anterior bladder of all 50 animals [Figure 4 I]. 98% of mice showed constant tumor growth during the follow-up period [Figures 4 and 5]. Following the inoculation of UM-UC3 luc, one mouse developed intraperitoneal tumor dissemination and the tumor involuted after day #7 in a second animal [Table 1]. This was the first group of mice inoculated with this new technique.
The mice were sacrificed on day #24, #28, and #37 after inoculation of UM-UC3 luc, UM-UC1 luc and UM-UC13 luc, respectively. Xenograft tumors were harvested and examined on hematoxylin and eosin (H&E) sections. All tumors were muscle invasive and some infiltrated into the perivesical fat, but no invasion into adjacent organs was observed [Figure 6 I]. 60% of mice bearing UM-UC13 luc tumors and 20% of mice bearing UM-UC3 luc tumors developed retroperitoneal lymph node metastases which were confirmed by H&E staining [Figure 6 II].

Figure 1. Image and schematic illustration of the experimental setup. The mouse is mounted on the heated operation table (I) and held under anaesthesia (II) with 3% isoflurane/oxygen mixture. The lower limbs are fixed with a rubber band (III). After approaching the ultrasound scanhead (IV) to the skin (longitudinal alignment with a cranial angle of 45-70°) the bladder (V) is visualized on the ultrasound screen. A syringe with a 30 G needle (VI) is guided to the skin in an angle of 30-45° (80-90° relative to the longitudinal axis of the ultrasound scanhead).

Figure 2. Immobilization of the bladder. Dimensions and illustration to construct the bladder stabilization strap (I) The strap is attached to the lower abdomen and immobilizes the bladder (II). Thus an evasion of the bladder during intramural injection is avoided.

Figure 3. Intramural inoculation of tumor cells. Visualization of the bladder on the ultrasound screen (I). Perforation of the skin and abdominal wall muscles (II). Needle insertion into the bladder wall without penetration of the mucosa (III). PBS (50 µl) between the muscular layer and the mucosa after slow injection (IV). Tumor cells suspended in Matrigel in the intramural artificially created space (V, VI).
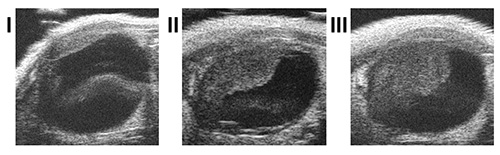
Figure 4. Follow-up by ultrasound. Continuous follow-up by ultrasound showed significant increase in tumor volume (I: day #3, II: day #7, III: day #13).

Figure 5. Follow-up by bioluminescence. Continuous follow-up by bioluminescence showed constant increase in luminescence over the study period.

Figure 6. Histology of xenograft tumor and lymph node metastasis. In toto H&E section of a representative xenograft tumor demonstrating invasive growth into the muscle without invasion into adjacent organs (I). 60% of mice bearing UM-UC13 luc tumors and 20% of mice bearing UM-UC3 luc tumors presented retroperitoneal lymph node metastases (II).
| Inoculated cell line | UM-UC1 luc | UM-UC3 luc | UM-UC13 luc | |
| Number of mice | 20 | 15 | 15 | |
| Volume injected, µL | 40 | 50 | 50 | |
| Cell count, absolute | 3.6 x 10⁵ | 6 x 10⁵ | 5.5 x 10⁵ | |
| Time per animal, min | 3.4 (±1.6) | 7.7 (±3.7) | 6.8 (±2.9) | |
| Tumor incidence | 49 (98%) | |||
| 20 (100%) | 14 (93%) | 15 (100%) | ||
| Lymph node metastasis | 0 | 3 (20%) | 9 (60%) | |
| Follow up (days) | 28 | 22 [before treatment] | 28 [before treatment] | |
| Tumor volume (μL) | day 4 | 11.6 (±1.3) | 12.5 (±1.7) | 14.4 (±1.3) |
| end of | 394.6 (±72.4) | 288.7 (±66.1) | 78.3 (±13.4) | |
| follow-up | ||||
| Tumor luminescence (Photons / sec) | day 4 | 4.6 x 10⁸ | 2.0 x 10⁸ | 5.8 x 10⁸ |
| (±9.4 x 10⁷) | (±3.7 x 10⁷) | (±1.3 x 10⁸) | ||
| end of | 1.9 x 10¹⁰ | 1.4 x 10¹⁰ | 1.5 x 10¹⁰ | |
| follow-up | (±4.0 x 10⁹) | (±2.3 x 10⁹) | (±1.9 x 10⁹) |
Table 1. Ultrasound-guided tumor cell injection - procedure and results.
Discussion
Almost all major advances in cancer therapy will require testing in animal models before initiating clinical trials. Animal models of cancer are essential tools that enable researchers to study tumor biology in vivo. Orthotopic xenograft models remain the gold standard1,2 and continue to offer the most flexibility (in terms of selection of cell lines) and have the most practical utility.
The illustrated procedure is a minimally invasive modification of the orthotopic model previously described by Dinney et al.12 We established xenograft tumors by ultrasound guided percutaneous injection of three different cell lines with a technical success rate of 100%. During continuous follow-up, 98% of mice demonstrated constant increase in tumor volume.
By performing a minimally-invasive technique we were able to address existing limitations of the intramural model. Besides respecting animal welfare, the reduced invasiveness of this procedure also contributes to reproducibility of in vivo experiments by decreasing the number of surgical complications. It is highly time effective to avoid an abdominal laparotomy and associated need for wound closure. We were able to decrease significantly the procedure time per animal to 3.4 min (±1.6). However, the chief advantage of our novel approach is its accuracy. High-resolution ultrasound allows us to visualize the space created by saline injection under the mucosa of the bladder wall. This first step injection facilitates tumor cell injection in a second step and minimizes the risk of tumor cell spillage. This contrasts to the technique of intramural injection after laparotomy, where it is impossible to visualize needle placement and there is always an element of uncertainty regarding the exact depth of injection. Also, as we are inoculating tumor cells strictly into the anterior bladder wall, tumor growth on the posterior bladder wall is avoided. Subsequently the rate of obstructive complications due to tumor growth in proximity of the ureteral orifices is extremely rare. This accompanying effect allows longer growth and treatment periods.
The main limitation of the ultrasound-guided tumor inoculation is the need for adequate technical equipment. Therefore the performance of this procedure will likely be restricted to centers which are specialized in animal models of human cancer. This should encourage collaborations between research groups outside of these institutions and the groups with expertise in such novel animal modeling.
Although dependent on familiarity with ultrasound imaging and some manual dexterity, this model is easy to learn under competent instruction. The key step in the procedure is the creation of an artificial space submucosally in the bladder wall with saline. Once this space is created without perforation of the mucosal layer, it remains stable for several minutes. The guidance of the second needle into this space in order to inoculate the tumor cells is relatively simple. The main complication during the creation of the submucosal space is perforation of the needle into the bladder lumen. The creation of a submucosal space, however, remains feasible. The needle has to be withdrawn slowly into the bladder wall and the saline injected just when the mucosal layer flips over the tip of the needle. After this maneuver the submucosal space is less stable (saline will escape to the bladder lumen within 30-60 sec) and the injection of the tumor cells has to be performed quickly. Spillage of tumor cells into the bladder lumen can occur in these cases with perforation of the mucosa. Although the loss of tumor cells from the intramural space might lead to a decreased tumor volume during follow-up, we have never observed any intravesical tumor uptake.
Another potential complication is the spillage of tumor cells to the peritoneal cavity through the injection channel. We observed only one intraperitoneal tumor cell dissemination in 50 animals, and this occurred in one of our first attempts. We attribute this to the injection of too large a tumor cell suspension volume. This was supported by the fact that reducing the volume from 50-40 µl resulted in no further intraperitoneal spillage.
This minimally invasive inoculation of murine orthotopic bladder cancer xenograft represents an innovative modification of the existing “intramural model”, benefitting both the investigator and the animals equally. The advantages of this model encourage its adaptation to other organs such as kidney, prostate and liver in order to establish orthotopic xenograft tumors in a minimally-invasive fashion.
Disclosures
Open access for this video-article is sponsored by FUJIFILM VisualSonics, Inc.
Acknowledgements
The authors would like to acknowledge Eliana Beraldi for performing viral transduction of tumor cell lines and Ben Deeley for his instruction on use of the small animal ultrasound imaging platform.
This project was supported by the German Foundation System (DFG; JA 2117/1–1:1), the Canadian Cancer Society Research Institute and a Mentored Physician Scientist Award from Vancouver Coastal Health Research Institute. The ultrasound imaging platform was funded by the Canadian Foundation for Innovation.
Materials
| Name | Company | Catalog Number | Comments |
|---|---|---|---|
| Chlorhexidine gluconate (2%) | Aplicare | 82-319 | |
| Dulbecco’s Modified Eagle’s Medium (DMEM) | Thermo Scientific | SH3008101 | |
| Fetal bovine serum (FBS) | Thermo Scientific | SH3007103 | |
| Isoflurane | Baxter Corporation | 402-069-02 | |
| Trypsin (0.25%) | Thermo Scientific | SH3004202 | |
| Syringe (1 ml) | BD Bioscience | 309659 | |
| Hypodermic needle (30 G; ¾ in) | Kendall | 830340 | |
| Angiocatheter (24 G) | BD Bioscience | 381112 | |
| Vevo 770 small animal imaging platform | VisualSonics | ||
| RMV 706 ultrasound scanhead | VisualSonics | ||
| IVIS Lumina III | Caliper Life Science |
References
- Chan, E., Patel, A., Heston, W., Larchian, W. Mouse orthotopic models for bladder cancer research. BJU Int. 104, 1286-1291 (2009).
- Kubota, T. Metastatic models of human cancer xenografted in the nude mouse: the importance of orthotopic transplantation. J. Cell. Biochem. 56, 4-8 (1994).
- Hadaschik, B. A., et al. A validated mouse model for orthotopic bladder cancer using transurethral tumour inoculation and bioluminescence imaging. BJU Int. 100, 1377-1384 (2007).
- Kang, M. R., et al. An Orthotopic Bladder Tumor Model and the Evaluation of Intravesical saRNA Treatment. J. Vis. Exp. (65), (2012).
- Dobek, G. L., Godbey, W. T. An Orthotopic Model of Murine Bladder Cancer. J. Vis. Exp. (48), (2011).
- Dinney, C. P., et al. Isolation and characterization of metastatic variants from human transitional cell carcinoma passaged by orthotopic implantation in athymic nude mice. J. Urol. 154, 1532-1538 (1995).
- Fu, C., Apelo, C. A., Torres, B., Thai, K. H., Hsieh, M. H. Mouse Bladder Wall Injection. J. Vis. Exp. (53), (2011).
- Xiao, Z., et al. Characterization of a novel transplantable orthotopic rat bladder transitional cell tumour model. Br. J. Cancer. 81, 638-646 (1999).
- Iinuma, S., Bachor, R., Flotte, T., Hasan, T. Biodistribution and phototoxicity of 5-aminolevulinic acid-induced PpIX in an orthotopic rat bladder tumor model. J. Urol. 153, 802-806 (1995).
- Jäger, W., et al. Hiding in plain view: Genetic profiling reveals decades old cross-contamination of bladder cancer cell line KU7 with HeLa. J. Urol. (13), (2013).
- Horiguchi, Y., Larchian, W. A., Kaplinsky, R., Fair, W. R., Heston, W. D. Intravesical liposome-mediated interleukin-2 gene therapy in orthotopic murine bladder cancer model. Gene Ther. 7, 844-851 (2000).
- Dinney, C. P., et al. Isolation and characterization of metastatic variants from human transitional cell carcinoma passaged by orthotopic implantation in athymic nude mice. J. Urol. 154, 1532-1538 (1995).
- Black, P. C., et al. Validating bladder cancer xenograft bioluminescence with magnetic resonance imaging: the significance of hypoxia and necrosis. BJU Int. 106, 1799-1804 (2010).
Reprints and Permissions
