The technique presented here measures the path of freely swimming microscopic species using single wavelength exposure. C. elegans are used to demonstrate shadow imaging as an inexpensive alternative to costly microscopes. This technique can be adapted to accommodate various orientations, environments and species to measure direction, speed, acceleration and forces.
Method Article
Single Wavelength Shadow Imaging of Caenorhabditis elegans Locomotion Including Force Estimates
In This Article
Summary
Abstract
This study demonstrates an inexpensive and straightforward technique that allows the measurement of physical properties such as position, velocity, acceleration and forces involved in the locomotory behavior of nematodes suspended in a column of water in response to single wavelengths of light. We demonstrate how to evaluate the locomotion of a microscopic organism using Single Wavelength Shadow Imaging (SWSI) using two different examples.
The first example is a systematic and statistically viable study of the average descent of C. elegans in a column of water. For this study, we used living and dead wildtype C. elegans. When we compared the velocity and direction of nematode active movement with the passive descent of dead worms within the gravitational field, this study showed no difference in descent-times. The average descent was 1.5 mm/sec ± 0.1 mm/sec for both the live and dead worms using 633 nm coherent light.
The second example is a case study of select individual C. elegans changing direction during the descent in a vertical water column. Acceleration and force are analyzed in this example. This case study demonstrates the scope of other physical properties that can be evaluated using SWSI while evaluating the behavior using single wavelengths in an environment that is not accessible with traditional microscopes. Using this analysis we estimated an individual nematode is capable of thrusting with a force in excess of 28 nN.
Our findings indicate that living nematodes exert 28 nN when turning, or moving against the gravitational field. The findings further suggest that nematodes passively descend in a column of water, but can actively resist the force of gravity primarily by turning direction.
Introduction
Caenorhabditis elegans is a free-living beneficial soil nematode that is a powerful model organism for studying mechanisms of gene regulation, development and more recently for understanding sensory biology and behavior. Despite having only 302 neurons, C. elegans are capable of complex locomotory patterns, reproductive behaviors, navigation, chemotaxis and many other behaviors. C. elegans possess mechanoreceptors, chemoreceptors and even detect blue wavelengths of light (Ward et al., 2008)1. While much is known about the neural circuitry of sensorimotor function and general locomotory patterns in C. elegans, less is known about the responses to multiple, concurrent stimuli or more complex environmental conditions than can be modeled under a microscope. A few studies have revealed more complex locomotory patterns that are highly plastic2,3,4. Our methodological approach will enable studies of nematodes in solution in real time where we can readily provide multiple environmental conditions simultaneously. This question is difficult to address using conventional microscope-based imaging techniques. We have developed an imaging technique that allows us to place nematodes within a water column to examine locomotory behaviors, as well as determine the capabilities of nematodes to change locomotion in response to different environmental conditions.
Single Wavelength Shadow Imaging (SWSI) is presented in this paper for the first time to address the shortcomings of traditional microscopes. Traditional microscopes are limited to observe species in a horizontal focal plane a few microns in depth5,6. Regarding single wavelength studies, most traditional microscopes use color filters to filter white light very broadly, typically, 50-100 nm. Using a laser for SWSI narrows the wavelength selection to less than 1 nm while maintaining significant light intensity7. Similarly, single wavelengths have been used to measure swimming frequencies of C. elegans in real time8.
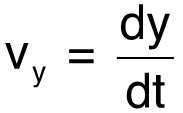
For the first demonstration of our method, we monitor the horizontal position, x, and the vertical position, y, of a freely swimming C. elegans in a water column, over a distance of about a centimeter. In particular, we are interested in the vertical movement since gravity also acts vertically. The slope of a linear fit to the vertical position gives the vertical speed, vy, of the nematode as it descends in the water column:
 (1)
(1)
The root mean square of the error (RMSE)9 indicates the quality of the fit and indicates whether the descending speed is generally constant. The vertical speeds are then averaged for each species and dead worms. Using these results, the drag, which the worms experience can be estimated.
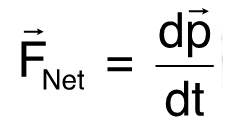
For the second demonstration of our method, we selected C. elegans that did not descend at a constant rate unlike the majority of the worms observed. The selected worms either turned around and swam upwards or hovered for a while before continuing the descent. Physically, this case study shows that the thrust of a swimming microorganism can be calculated. Newton's laws dictate that a body that changes directions accelerates, which implies a net force,  , is acting on that body10:
 (2)
(2)
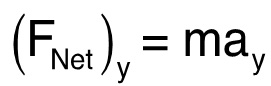
where  is the linear momentum and t is time. The acceleration of the worm is directly proportional to the force acting on the worm since the mass of the worm remains constant. As a result, the vertical net force is:
 (3)
(3)
where m is the mass of a worm and ay represents the vertical acceleration. The net force in the vertical direction represents then the worm thrust in the same direction. The total thrust can be calculated by taking the horizontal component into account.
Protocol
1. C. elegans Preparation
- Prepare petri plates of young adult C. elegans as described in previous experiments involving suspension of C. elegans in a fluid filled cuvette11.
- On the day of the video analysis, pick live young adult nematodes directly into a cuvette filled with deionized, distilled water using a platinum pick as described in step 2.
- Prepare dead C. elegans with chloroform exposure. Continue by following the procedure described for picking live nematodes described in step 2.
2. Optical Setup for the Video Analysis
- Assemble the experimental setup to create shadow images as shown in Figure 1. The camera can be placed at any distance from the screen as long as it is able to capture a frontal view of the screen. A good place is next to the cuvette facing the screen.
- Using at least two mirrors to steer the tunable Helium-Neon laser output into a Galilean beam expander so that the beam is expanded to a diameter of 12 mm.
- Place one or two pinholes in the beam path so that the beam passes through the pinholes without being obstructed. Use the pinholes to assure the alignment is maintained.
- Direct the expanded beam onto a mounted quartz cuvette that is 10 mm wide, 10 mm deep and 4 cm tall.
- Magnify the beam using a plano-convex lens with a positive focal length of 75 mm.
- Place a projection screen approximately 120 cm from the lens. Distances greater than this will yield a greater magnification of the shadow image. However, the quality of the image will decrease with a lower light intensity and an increased noticeability of diffraction interference.
- Place a high-speed camera, which is capable of at least 60 fps, right next to the cuvette facing the screen.
- Place a dissecting microscope near the optical setup for rapid transfer of nematodes into the cuvette.
- Temporarily secure a transparent ruler with mm divisions to the center of the cuvette holder perpendicular to the expanded beam so that the beam projects a magnified image of the ruler onto the screen. Set the length scale for video analysis.
- On the projection screen, mark the scale distance using a transparent ruler off center from the projected image to avoid interfering with the projection. Click here for video.
- Record this image and measure the magnification. Remove the ruler from the setup. Repeat this step for other wavelengths as the angle of refraction of light for each wavelength through the lens will vary due to chromatic aberrations.
- Replace the cuvette and fill it to within 1 mm of the rim with distilled water.
- Begin recording while the room light is on so that the scale distance is included in the same footage as the projected image. Turn the light off.
- Using a thin, flattened platinum wire pick, move individual young adult C. elegans one at a time from the agar plate into the cuvette by touching the pick to the surface of the water. The nematode will become visible in the water column when it enters the beam due to scattered light. Click here for video.
- Film the projected images of the worms as they pass through the expanded laser beam. It is important to note that the projected image is inverted and the worms will appear to move in the opposite direction of their actual motion. Worms that are descending with gravity will appear to move upward on the screen (Figure 2).
3. Video Data Preparation
- Import the video into the video analysis program.
- Set the scale using the magnification factor previously determined.
- Track the linear displacement of the head of the shadowed nematode with at least 10 data points over the entire path taken.
- Find the velocity in the vertical direction by taking derivative ("Y", "Time") and divide this value by the magnification factor determined in step 2.2.
4. Data Analysis
- Analyze the linear descent of a C. elegans:
- Check to ensure that the data points on the vertical position versus time graph generally form a straight line. Some deviations can be ignored due to the head movement of the nematode. If the data points generally form a straight line, continue to step 4.1.2, otherwise the descent is nonlinear and the analysis should be continued using step 5.1 in this protocol.
- Create a linear regression line by fitting a straight line12 to the data from the Analysis menu. The slope of this line is then the vertical speed of the C. elegans. The slope is the change in position divided by the change in time over a particular interval. Determine the descending speed of the live and dead worms in this manner (Figure 3).
- Average the vertical swimming velocities from the nematodes. A sample size of about 50 worms is sufficient. Compare swim velocities in live worms with drift velocities in dead worms.
5. Analyze Nonlinear Motion of C. elegans
- From Section 3, select an analyzed video file, which shows a nonlinear descent within the water column (Figure 4). A nonlinear descent can be identified using step 4.1.1 in this protocol.
- Select 'Curve Fit' from the 'Analysis' menu in the video analysis software. Select a second order (quadratic) polynomial. Fit the curve.
- For a region of interest, adjust the fit on the graph by sliding the brackets on each side of the fit on the graph until the curve is very close to the data points within the fit and/or well within the error bars. The fitting program gives a mathematical expression for the fitted curve, which is vertical position versus time. Consider the fitted curve errors given by the program associated with the physical properties. A relative error of 15% or below is usually acceptable.
- Add more curve fits to cover additional sections of data. Spline13 the functions for optimal coverage: make sure that the curve fits overlap and try to align adjacent curves so that the slopes match in the overlapping regions.
- Obtain the velocity for a region of interest by taking the derivative of the fitted curve using the mathematical expression obtained in step 5.1.3. Velocities may vary in time. Note that the derivative is the slope of a function. The derivative can be obtained mathematically or graphically. In this case it is practical to use the given mathematical expression.
- Take the second derivative of the fitted curves to obtain the acceleration. The acceleration may vary in time.
- Multiply the acceleration by the worm mass to calculate the thrust, which the worm exerts. A reasonable estimated mass is 3 μg assuming that the worm consists mostly of water.
Results
Steady Descent
The first investigation shows no distinguishable difference in the descending rates of the C. elegans during SWSI using 633 nm. The descending rates were found to be constant at 1.5 mm/sec ± 0.1 mm/sec for both the live and the dead C. elegans. A sample size of 50 worms generated a reasonable variance of 7% for both living and dead worms. There is no acceleration acting on the worms since the descending speed is constant, so that the drag force equals the gravitational force minus the buoyancy force. This implies that the density of the worm is slightly larger than that of water; however, for the estimations below it is still practical to assume that the density of a nematode is roughly that of water.
Changing Direction
The second investigation, a case study, demonstrates that nematodes are capable of changing direction and can swim upwards against gravity. Two curves were fitted to the vertical displacement of the nematode so that the second derivatives of those curves could be splined to graph acceleration versus time (Figure 5). It is advisable to keep the polynomial order as low as possible while maintaining a good fit. A lower polynomial order indicates less variation in the acceleration over time. The higher order polynomial terms will be negligible, and therefore unnecessary, if the order of the polynomial is too high. This worm decelerates at a constant rate of 0.110 mm/sec2 ± 0.002 mm/sec2, turns around and accelerates at the same rate 0.110 mm/sec2 ± 0.002 mm/sec2 until shortly after the turnaround point. The C. elegans continues to move upwards with a diminishing acceleration of 1.252 - 0.00708 t in mm/sec2 until the acceleration falls to zero. Keeping in mind Eq. 3, and an estimated worm mass of 3 μg, the worm undergoes a vertical net force, FNy, of 0.33 pN until shortly after the turnaround point.
Descent: There are three types of forces acting on the worm until the worm reaches the turnaround point: gravity, drag, buoyancy and thrust (Figure 6a). The net force equals the vector sum of all three forces. Here we consider the vertical components only:
FNy = FDy+FTy-Fg+FB (4)
where FB is the buoyancy force. Fg is equal in magnitude but opposite in direction to the buoyancy force assuming that the density of the worm is that of water. Eq. 4 can then be written in the following way:
FNy = FDy+FTy (5)
FNy remains constant during the descent. This implies that FDy+FTy remains constant until the nematode reaches the turnaround point. FDy is largest at the top, which is the beginning of the path, and gradually reduces to zero until the speed is zero at the turnaround point while FTy must increase to keep FNy constant.
Turnaround: There is no drag force in the vertical direction at the turnaround point since the vertical speed equals zero at that point. The only forces acting in the vertical direction are gravity, -Fg, buoyancy, FB and the vertical worm thrust, FTy, as depicted in Figure 6b. At this point, the thrust of the C. elegans can be determined:
FTy = FNy (6)
The thrust at the bottom of the trajectory is then roughly equal to 0.33 pN, which is about 0.001% of the worm's weight. Taking into account that the estimated weight, Fg of a C. elegans is 28 nN,
Ascent: Similarly, during the ascent, drag increases but is pointed down (Figure 6c):
FNy = -FDy+FTy(7)
The thrust implemented by the worm must now be even larger and equal the sum of the drag force and the weight. The worm is slowing down after beginning to swim up. To swim up at the same rate as the worm descended, the worm would have to exert an upward thrust of at least twice its weight.
Hovering
An example of a worm that slows its descent for about 3 sec is presented in Figure 7. A 3rd degree polynomial is a reasonable fit for the overall path. The errors in acceleration and velocity from this fit are less than 15%. The worm starts with a significant upward thrust, slows down and starts to turn around at 68 sec; however, the upward acceleration decreases continuously (Figure 8) until the net acceleration equals zero around 68.5 sec. This eventually leads to a net acceleration in the downward direction followed by another zero point in the velocity (Figure 9) and the nematode starts to descend again at 69 sec.
It is interesting that the maximum observed vertical acceleration in this case is 2.7 mm/sec2. The acceleration at the turning points are 0.455 mm/sec2 and - 0.455 mm/sec2 respectively; about four times larger than in the case of the nematode that turns around and swims up. Using Eq. 6, it can be estimated that the upward thrust is about 1.32 pN at the first turning point. At the second turning point, the net acceleration is negative so that the upward thrust is 1.32 pN.
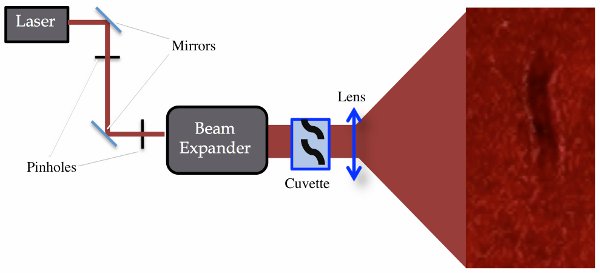
Figure 1. Experimental setup. The laser, beam expander, lens and screen are essential to the experimental setup. The steering mirrors and pinholes may be omitted, but will make the optical alignment less stable.
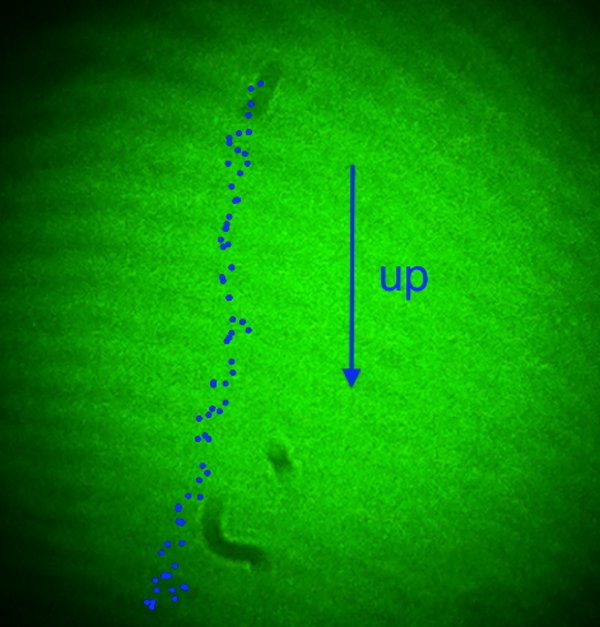
Figure 2. Single Wavelength Shadow Image (SWSI). Using 2 mW of 543 nm laser light the shadow of a worm is projected onto a screen. The image is inverted so that the nematode appears to fall upwards.
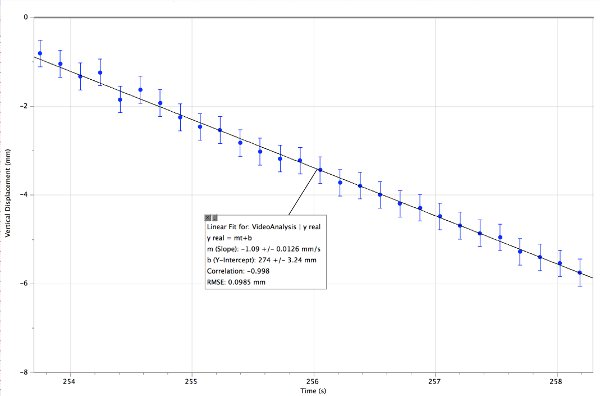
Figure 3. Vertical descent of a single wildtype C. elegans in a water column. This nematode was shadowed by 633 nm coherent light. The slope of the linear fit indicates a downward speed of 1.09 mm/sec ± 0.01 mm/sec. Please click here to view a larger version of this figure.
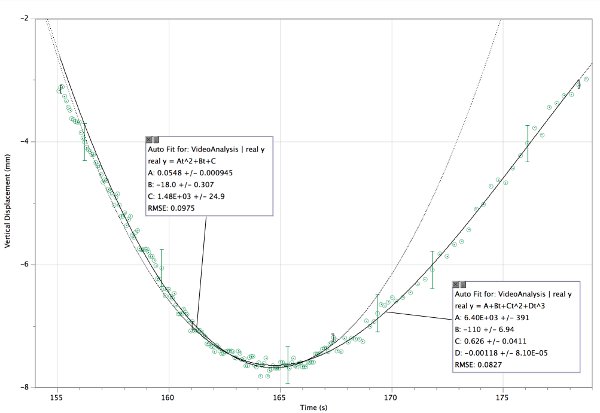
Figure 4. Displacement graph of a single upward swimming wildtype C. elegans. Two splined fits trace the overall path of the nematode. The second derivative of the fit reveals the acceleration. The maximum acceleration is easily determined from the first fit: 0.110 mm/sec2 ± 0.002 mm/sec2. Only a few error bars are shown so that the data points and the fit remain visible. This nematode was shadowed by 633 nm coherent light. Please click here to view a larger version of this figure.
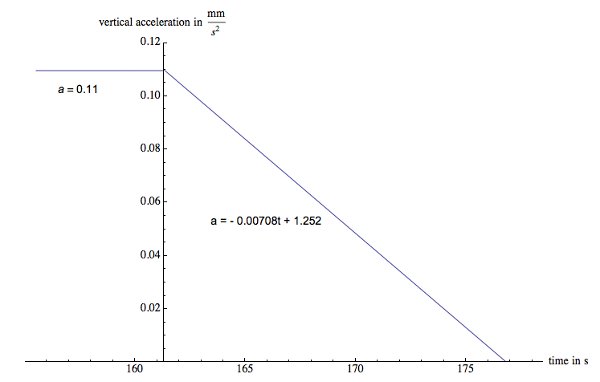
Figure 5. Acceleration graph of a single wildtype C. elegans. This nematode maintains a constant upward acceleration of 0.110 mm/sec2 ± 0.002 mm/sec2 causing it to slow down and then move upwards. Shortly after the turnaround point the acceleration decreases steadily and the net acceleration diminishes to zero. Please click here to view a larger version of this figure.
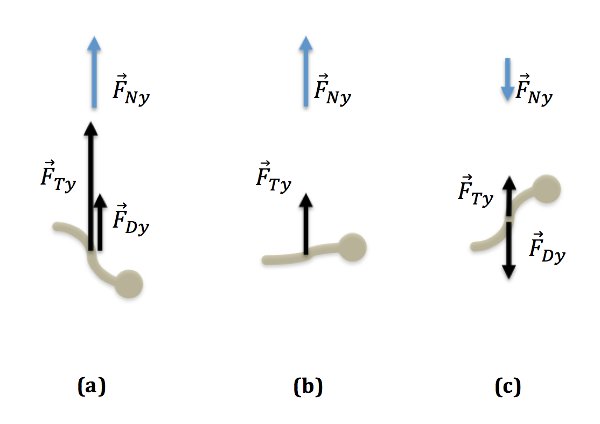
Figure 6. Force diagrams for descent, turning point and ascent. Buoyancy and gravity are equal in magnitude and opposite in direction so that the effect of these forces cancel each other out. They are therefore not shown in these diagrams. (a) The worm is descending with drag and thrust pointing up. (b) The worm is at the low point of the trajectory without drag. Thrust is pointing up. (c) The worm is ascending with drag pointing down while thrust is pointing up.
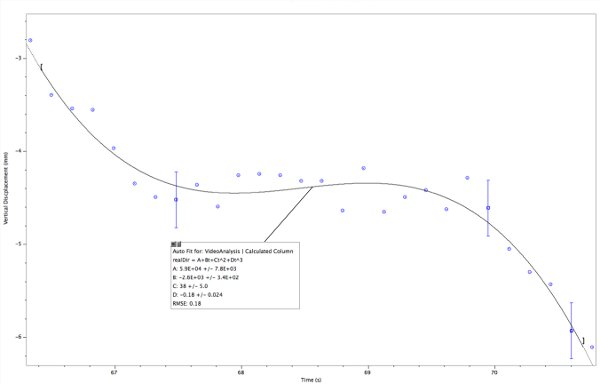
Figure 7. Displacement graph of single hovering nematode. The worm slows down and starts to turn around at about 68 sec but starts descending around 69 sec. Please click here to view a larger version of this figure.
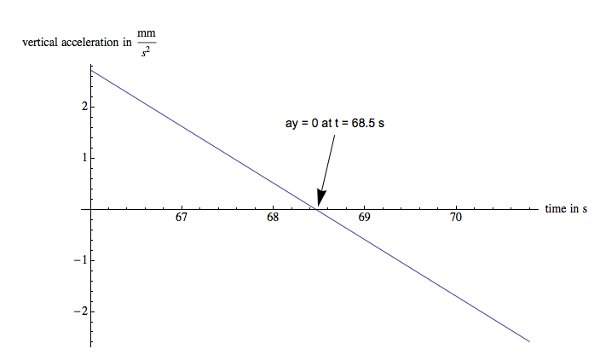
Figure 8. Acceleration graph of a single hovering nematode. This worm starts with an upward acceleration of 2.7 mm/sec2, decreases to zero and eventually has a downward acceleration of -2.6 mm/sec2. Please click here to view a larger version of this figure.
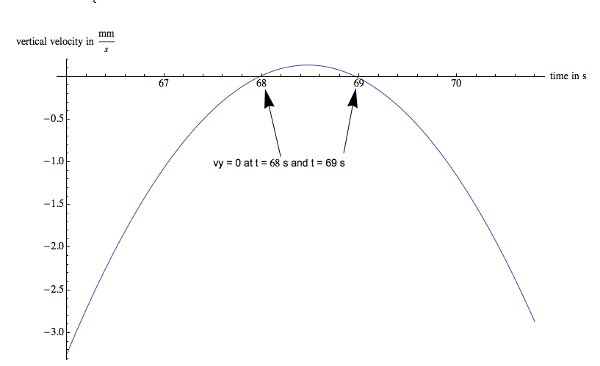
Figure 9. Velocity graph of a single hovering nematode. This worm comes to a stop at 68 sec and starts to head upward, slows down and reaches zero velocity in the vertical direction at 69 sec followed by a descent. Please click here to view a larger version of this figure.
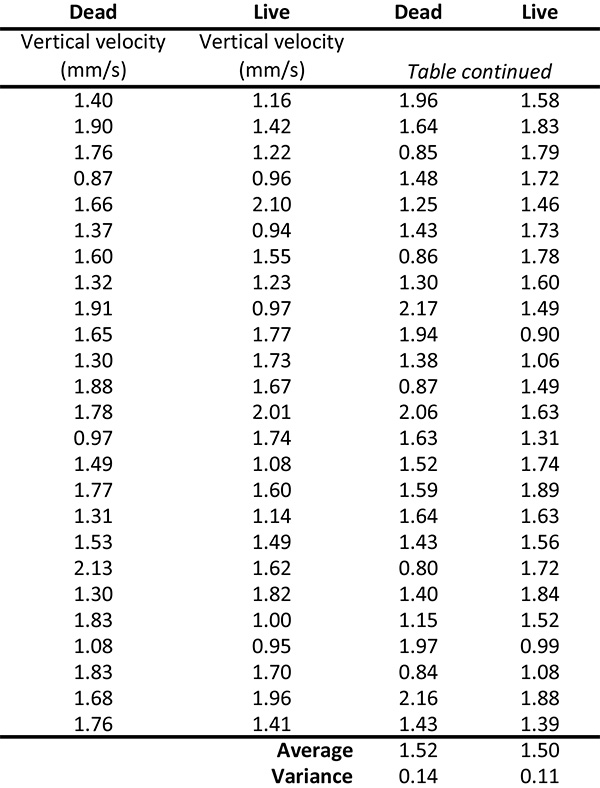
Table 1. Average descent velocities of N2 C. elegans. 50 live and 50 dead nematodes are tracked during their descent. The average velocity for the descents is the same for the live and the dead worms: 1.5 mm/sec ± 0.1 mm/sec.
Discussion
The SWSI technique provides an additional way to understand the locomotory capabilities of microscopic organisms like free-living nematodes. With this technique we have distinguished between active locomotion (swimming) and passive drift due to gravity operating on dead nematodes. In addition, when free-swimming nematodes change direction during locomotion in water, we are able to measure the drag forces and angular forces, which are operating on the nematodes and exerted by the nematodes.
Nematodes encounter different environmental conditions within the soil. There are water pockets within soil, as well as solid particles and biological materials of different shapes and textures. In addition, nematodes exist within a gravitational environment that they respond to14. Further, nematodes near the surface of the soil are exposed to different wavelengths of light, changes in temperature and humidity, as well as biological variables like bacteria, predatory fungi and other soil organisms. Nematodes must respond to all these different variables, swimming and crawling in different media, turning and altering navigational strategies. All of these complex computations are carried out by only 302 neurons, a subset of which are involved in locomotion, and 95 body wall muscle cells. Measurements of the sort described by SWSI technique provide important insight into how nematodes accomplish this navigational complexity.
For the first part, we have measured the overall descending rate of wildtype C. elegans in 633 nm light. Using these measurements, we can estimate the drag force a worm encounters.
For the case study of an accelerating nematode, the forces involved change continuously since the drag force changes with speed. There are some statements that we are able to make about the forces acting on the worm. As the worm slows down and tries to swim upwards the vertical component of the drag force decreases until it reaches zero at the low point of the nematode's trajectory. At this point, the worm must have an upward force to swim up.
This method can be modified in several ways. Any microscopic species that navigates in a clear liquid can be tracked using SWSI. Studies can be conducted with any wavelengths that are accessible to digital cameras. Digital cameras will typically pick up wavelengths ranging from the UV to near IR. In addition, horizontal studies can be conducted by directing the laser vertically upward. The species can then be placed on a horizontal transparent surface, like a microscope slide. Adjusting the beam expander or the magnifying lens after the beam expander can sharpen blurry images. The user should be sure to fasten all components to the table to ensure consistent and easy beam alignment.
The method is limited by available laser wavelengths and resolution. In essence the advantages of this method over existing microscopes, which are the flexibility in directions and wavelengths, are also weaknesses since the setup is simple. The unsophisticated optics and speckles of the laser limit the resolution. Some of these drawbacks can certainly be improved in the future by including spatial filter and projecting the image directly onto a CCD camera.
The most critical steps in the protocol can easily be learned as the experiment is performed for the first time. Placing the nematode in the cuvette without creating turbulence is critical. Also, vibrations may disturb the setup and alter the behavior of the worms. Be sure to limit the power, which is used to shadow image. 2 mW for a laser beam that is 1 mm in diameter should be the maximum to avoid heating effects. The setup should be tested for scattering effects when using liquids other than distilled water.
Currently most microscopes operate on a horizontal plane using white light or color filters, which are still very broad in the wavelength range. Microscopes that truly use single wavelengths and have flexibility in the viewing scenario, i.e. horizontal placement, are usually limited to one advantage or the other. Also, these types of microscopes are usually very expensive and still limited to focal planes unlike our method. Our setup can easily be built with an extremely low budget. This method is ready to be used by schools, environmental companies as well as other entities that operate with little funding. In the future, this method can be used in a very sophisticated setup to study real time effects on locomotion and mechanosensation of microscopic species. This method makes single wavelength studies at a wide range of angles and viewing depths easily available.
Disclosures
The authors have nothing to disclose.
Acknowledgements
We are grateful for the support of the Vassar College Undergraduate Research Summer Institute (URSI), the Lucy Maynard Salmon Research Fund, NASA award No. NX09AU90A, National Science Foundation Center for Research Excellence in Science and Technology (NSF-CREST) award No. 0630388 and the NSF award No. 1058385.
Materials
| Name | Company | Catalog Number | Comments |
|---|---|---|---|
| Tunable Helium-Neon laser | Research Electro-Optics | 30602 | Four wavelengths can be selected between 543 nm and 633 nm. |
| 2 Front Surface Aluminum Mirrors | Thorlabs | PF10-03-F01 | |
| High Speed Exilim Camera | Casio | ||
| Quartz Cuvette | Starna Cells | 21/G/5 | |
| LoggerPro (Software) | Vernier | http://www.vernier.com/products/software/lp/ | |
| Mathematica 8 | Wolfram | http://www.wolfram.com/ | |
| 5x-10x variable zoom Galilean beam expander | Thorlabs | BE05-10-A | |
| Plano-convex lens with a positive focal length of 75 mm | Thorlabs | LA1257 |
References
- Ward, A., Lie, J., Feng, Z., Xu, Z. S. Light-sensitive neurons and channels mediate phototaxis in C. elegans. Nature Neurosci. 11, 916-922 (2008).
- Pierce-Shimomura, J. T., Chen, B. L., Mun, J. J., Ho, R., Sarkis, R., McIntire, S. L. Genetic analysis of crawling and swimming locomotory patterns in C. elegans. Proc. Natl. Acad. Sci. USA. , 105-20987 (2008).
- Vidal-Gadea, A. G., Davis, S., Becker, L., Pierce-Shimomura, J. T. Coordination of behavioral hierarchies during environmental transitions in Caenorhabditis elegans. Worm. 1, 5-11 (2012).
- Berri, S., Boyle, J. H., Tassieri, M., Hope, I. A., Cohen, N. Forward locomotion of the nematode C. elegans is achieved through modulation of a single gait. HFSP Journal. 3, 186-193 (2009).
- Pawley, J. B. Objective Lenses for Confocal Microscopy. Handbook of Biological Confocal Microscopy. , 3rd Edition, Springer. New York. (2006).
- Conrad, J. Depth of Field in Depth. Large Format Page Retrieved. , Available from: http://www.largeformatphotography.info/articles/DoFinDepth.pdf (2011).
- Demtröder, W. Laser Spectroscopy Basic Concepts and Instrumentation. , Springer 3rd Ed. New York. (2003).
- Magnes, J., Raley-Susman, K., Melikechi, N., Sampson, A., Eells, R., Bello, A., Lueckheide, M. Analysis of Freely Swimming C. elegans Using Laser Diffraction. Open J. Biophys. 2 (3), 101-107 (2012).
- Mood, A., Graybill, F., Boes, D. Introduction to the Theory of Statistics. , 3rd edition, McGraw-Hill. (1974).
- Taylor, J. R. Classical Mechanics. , University Science Books. (2005).
- Magnes, J., Susman, K., Eells, R. Quantitative Locomotion Study of Freely Swimming Micro-organisms Using Laser Diffraction. J. Vis. Exp. (68), (2012).
- Bevington, P. R. Data Reduction and Error Analysis for the Physical Sciences. , McGraw-Hill Book Company. New York. (1969).
- Lyche, T., Schumaker, L. L. Local spline approximation methods. Journal of Approximation Theory. 15 (4), 294-325 (1975).
- Kim, N., Dempsey, C. M., Kuan, C. -J., Zoval, J. V., O'Rourke, E., Ruvkun, G., Madou, M. J., Sze, J. Y. Gravity Force Transduced by the MEC-4/MEC-10 DEG/ENaC Channel Modulates DAF-16/FoxO Activity in Caenorhabditis elegans. Genetics. 177, 835-845 (2007).
Reprints and Permissions
Request permission to reuse the text or figures of this JoVE article
Request Permission