Brain damage resulting from cerebral ischemia may be non-invasively imaged and studied in rats using pre-clinical positron emission tomography coupled with the injectable radioactive probe, 18F-fluorodeoxyglucose. Further, the use of modern software tools that include volume of interest (VOI) brain templates dramatically increase the quantitative information gleaned from these studies.
Method Article
Non-invasive Imaging and Analysis of Cerebral Ischemia in Living Rats Using Positron Emission Tomography with 18F-FDG
Rashna D. Balsara1,2 , Sarah E. Chapman3 , Ian M. Sander4 , Deborah L. Donahue1 , Lucas Liepert4 , Francis J. Castellino1,2 , W. Matthew Leevy3,4,5
1W. M. Keck Center for Transgene Research, University of Notre Dame, 2Department of Chemistry and Biochemistry, University of Notre Dame, 3Notre Dame Integrated Imaging Facility, University of Notre Dame, 4Department of Biological Sciences, University of Notre Dame, 5Harper Cancer Research Institute, University of Notre Dame
Opens in a new tab
In This Article
Summary
Loading...
$$\rightleftharpoonup{xx}$$
$$\longleftharp{xx}$$,
$$\longrightharp{xx}$$,
Abstract
Loading...
$$\rightleftharpoonup{xx}$$
$$\longleftharp{xx}$$,
$$\longrightharp{xx}$$,
Stroke is the third leading cause of death among Americans 65 years of age or older1. The quality of life for patients who suffer from a stroke fails to return to normal in a large majority of patients2, which is mainly due to current lack of clinical treatment for acute stroke. This necessitates understanding the physiological effects of cerebral ischemia on brain tissue over time and is a major area of active research. Towards this end, experimental progress has been made using rats as a preclinical model for stroke, particularly, using non-invasive methods such as 18F-fluorodeoxyglucose (FDG) coupled with Positron Emission Tomography (PET) imaging3,10,17. Here we present a strategy for inducing cerebral ischemia in rats by middle cerebral artery occlusion (MCAO) that mimics focal cerebral ischemia in humans, and imaging its effects over 24 hr using FDG-PET coupled with X-ray computed tomography (CT) with an Albira PET-CT instrument. A VOI template atlas was subsequently fused to the cerebral rat data to enable a unbiased analysis of the brain and its sub-regions4. In addition, a method for 3D visualization of the FDG-PET-CT time course is presented. In summary, we present a detailed protocol for initiating, quantifying, and visualizing an induced ischemic stroke event in a living Sprague-Dawley rat in three dimensions using FDG-PET.
Introduction
Loading...
$$\rightleftharpoonup{xx}$$
$$\longleftharp{xx}$$,
$$\longrightharp{xx}$$,
Stroke is one of the leading causes of death in developed countries, and is directly responsible for the death of 1 out of 19 Americans1. It has been estimated that about 795,000 Americans experience stroke every year, out of which 87% of these are ischemic in nature5. During an ischemic event, continuous supply of oxygen and glucose to the cortical neurons is severely impaired inducing a hypoxic environment, which leads to decreased cellular function in the affected brain regions. Depending on the severity of the stroke, cerebral blood flow and glucose uptake varies spatially and temporally.
Damage due to stroke can be identified through non-invasive methods, such as 18F-fluorodeoxyglucose (FDG) Positron Emission Tomography6. FDG is a glucose analogue where the hydroxyl group at the 2’ position has been replaced by the positron emitting 18F isotope. 18F is advantageous due to its long, 110 minute half-life, allowing it to be used to detect glucose consumption in the brain. FDG PET produces a quantitative high resolution map of deoxyglucose consumption within the brain7 as 18F tends to accumulate in regions of high glucose consumption, indicating that such tissues are highly metabolically active8. The 18F nucleus undergoes beta-decay, releasing a positron, which rapidly annihilates with a nearby electron, producing gamma rays, which are detected by the instrument. FDG PET scans can be repeated in the same individual with at least 10 18F half-lives, or about 18 hr, in between scans, thus providing a way to study changes in brain activity over time in the same individual.
Preclinical animal models, such as rats, are often used to evaluate the effects of strokes and the effectiveness of treatments for stroke. Since FDG PET is non-invasive, it can be used to measure the effects of stroke over time without disrupting the physiology of the animal. Depending on the stroke event location, different regions of the brain may be affected. However, with small animals such as rats, manually defining and quantifying activity in specific regions of the rat brain can be challenging. In order to compare glucose metabolic activity in specific regions of the rat brain over time, volumes of interest (VOI) to be quantified must be consistently delineated. A precise atlas of the rat brain has been developed to alleviate this problem9, and has been converted into digital form for use in quantification of preclinical FDG-PET data. Here we present a method to classify stroke tissue damage in a consistent, methodical fashion. The method details the surgical procedure for initiating cerebral ischemia in an animal model, quantifying specific brain sub-regions affected by stroke, and produce a three dimensional visualization of the extent and location of stroke tissue damage using the appropriate techniques and tools. Using the methodology described in this study, researchers can consistently initiate cerebral ischemia in rats, conduct PET imaging, and quantify changes in FDG uptake using defined brain regions in preclinical stroke models over time.
Protocol
Loading...
$$\rightleftharpoonup{xx}$$
$$\longleftharp{xx}$$,
$$\longrightharp{xx}$$,
Animal handling and all experiments with them were strictly performed according to protocols that were approved by the Institutional Animal Care and Use Committee of the University of Notre Dame (Protocol number 14-086).
1. Animals
- Animals and Stroke initiation: Use male Sprague Dawley Rats weighing between 220 and 270 g for all stroke studies.
- Anesthetize rats with 2.5% isofluorane (2 L/min in 100% O2) using a nose cone.
- Place the animal in dorsal recumbency on a heating pad. Tape down the front legs.
- Shave ventralsurface of neck. Prep the shaved area with 70% EtOH followed by 10% providone iodine solution.
- Sterile instruments are used for this procedure; gloves are replaced after the prep of the animal. Sterile tip techniques are employed.
- Using scissors, make a 2-2.5 cm incision parallel to the trachea, 0.5 cm to the right of the trachea. Using blunt dissection locate the carotid artery.
- Use retractors to help visualize the vessel. Place a micro clamp on the common carotid artery (CCA).
- Locate the first branching point which will be the external carotid artery (ECA) and the internal carotid artery (ICA). Cauterize smaller branches attached to the ECA, such as the occipital artery.
- Ligate the ECA near the branch to the thyroid artery with a 4-0 silk suture. The sutures should have extra length to enable hemostats to hold the suture.
- Cauterize the ECA above the suture (cranially). To clamp the suture with the hemostats, pull the ECA caudally and it will be parallel with the CCA.
- Locate the ICA and use another micro clamp to occlude this artery.
- Make a small hole in the ECA using small spring scissors. Insert the occluder into the ECA and tie a suture around the occluder to prevent blood flow.
- Remove the micro clamp on the ICA and advance the occluder till resistance is felt.
NOTE Make sure the occluder advances into the ICA and not the pterygopalatin artery. The occluder should advance smoothly and the white tip should not be seen if the occluder is properly placed. - Remove the micro clamp from the CCA. Cut any excess occluder or suture.
- Place 9 mm Auto Clips to close the skin incision.
- Remove the animal from anesthesia and allow animal to awaken. After 2 hr:
- Anesthetize rat with isoflurane.
- Remove the wound clips.
- Locate the end of the occluder and remove it from the middle cerebral artery by gently pulling on it until the white tip of the occluder comes into contact with the sutures. Do not pull it all the way out, this will cause bleeding.
- Replace the wound clips to the incision.
- Remove the animal from anesthesia and allow animal to awaken.
2. Image Acquisition
Perform three PET and CT scans for each rat. Take a pre scan 1-2 days before inducing stroke, to provide a baseline for 18F-FDG uptake. Scan each rat 1.5 hr after stroke, before reperfusion is performed (image with occluder still in the animal). Scan each rat 26 hr post stroke (24 hr post reperfusion) to quantify brain tissue damage due to stroke injury.
NOTE: The 24 hr time point mentioned in the rest of the manuscript refers to the post reperfusion time when the rats were scanned.
- Anaesthetize rats under 2.5% isofluorane gas in anesthesia chamber.
- Inject approximately 500 µCi of 18F-deoxyglucose (FDG) (200 µl total volume) into tail vein of rat.
- Wait 1 hr.
- Place anaesthetized rat on standard rat bed, under nose cone isofluorane anesthesia. Measure distance in mm between nose of rat and edge of rat bed for horizontal offset.
3. Image Acquisition
- Open Albira Suite software.
- Select Acquirer.
- Name new study.
- Under PET or SPECT click Add > Select PET protocol. Click Add.
- Under CT click Add > Select CT protocol. Click Add.
- Click number under Initial Horizontal Position under PET. Set number to measured distance in mm between nose of rat and front of rat bed. Repeat for CT.
- Set Subject to Rat and enter weight in grams.
- Set Compound to FDG.
- Set Injection Time and Injection Date and Dose.
- Click Start Study button.
NOTE: Upon completion of PET CT scan, data will be saved automatically. - Open Albira Reconstructor.
- Change Pending to Last 10 or All.
- Select scan file name.
- Click Add.
- Click Start Reconstruction. NOTE: File will be saved in MicroPET format.
4. Image Analysis
- Perform image analysis using the PMOD analysis software in conjunction with the W. Schiffer Brain Atlas.
- Open PMOD > Fusion.
- Navigate to the CoRegistration Preprocessing tab at the top of the screen.
- Open the Load Reference drop-down menu at the center of the screen and select NifTI. Navigate to C://PMOD3.2/resources/templates/usertemplates. Select Rat(W.Schiffer)-FDG.nii and click Open.
- Open the Load Input drop-down menu at the right of the screen and select MicroPET. Navigate to the desired MicroPET file. Select it and click Open.
- Navigate to the Manual CoRegistration tab at the top of the screen.
- Select the fourth tab in the middle group of tabs on the right (Reslicing).
NOTE: Two buttons will appear on the MicroPET scans. - Use the open white rectangle to rotate the MicroPET scans and the filled white rectangle to move the MicroPET scans. Align the two scans. To do this, locate landmarks like the harderian glands, and top and rear cerebral features which can be used to match the MicroPET scan with the brain model. Then, adjust the MicroPET scan until it matches up with the brain atlas (W. Schiffer).
NOTE: For example, the harderian glands appear bright on both the MicroPET scans and the brain atlas (W. Schiffer), and can be used as a reference for alignment. - If required, rotate the MicroPET scan 180° in the coronal view and raise the scan significantly in the sagittal view, along with other minor orientation changes.
- Navigate to the Full Screen Fusion (VOIs) tab at the top of the screen.
- Select Source A at the top right of the screen.
- Navigate to Template > Atlas at the bottom of the page.
- Select Rat (W. Schiffer) from the drop-down menu.
NOTE: (Optional) Return to the Manual CoRegistration tab where the atlas should appear overlaid on brain atlas (W. Schiffer). The atlas can be used to help align the MicroPET scan and the brain atlas (W. Schiffer). After alignment, return to the Full Screen Fusion (VOIs) tab. A template will appear on the brain, indicating which sections of the brain will be measured for the VIO Statistics. - Select Source B at the top right of the screen.
- Select the VOI Statistics button at the top right of the screen.
NOTE: A spreadsheet will appear. - Select Save.
NOTE: A Write As [VOI Statistics] window will appear. - Select Save to File System.
NOTE: A PMOD (save): choose components window will appear. - In the file name field, type the desired file name.
- Select Save.
- Perform data analysis using Microsoft Office Excel 2010.
- Open Excel.
- Select File > Open.
- Change the file type from All Excel Files to All Files.
- Navigate to the saved VIOSTAT files. Select the desired file.
NOTE: An import wizard will appear. - Select Finish. If using a Mac, double click on the VOISTAT file and it will directly open as an Excel file.
- Select the column containing the field VoiName(Region). Copy the information and paste it into a new Excel file.
- Select the column containing the fields Averaged and [1/1]. Copy the information and paste it into the new Excel file.
- Repeat this process for all the VOISTAT files.
- Begin a new tab for each data set.
- Return to the first tab. Select a new cell. Calculate the ratio of the right side of a brain section to the left side of a brain section by dividing the value of the right side of the brain by the left side of the brain. The brain section belonging to the right side of the brain is listed before the section belonging to the left side of the brain. Repeat this for all the brain sections.
- Select a new cell. Use the AVERAGE function to calculate the average of each of the previously calculated ratios across all the mice.
- Select a new cell. Calculate the SEM of each brain section by using the STDEV function and dividing it by the square root of the number of mice.
- Repeat this for each data set.
5. Image Visualization
- Convert images into the analyze file format using PMOD analysis software.
- Open PMOD > View.
- Navigate to the View tab at the top of the screen.
- Open the Load drop-down menu at the right of the screen and select MicroPET. Navigate to the desired MicroPET or CT file. Select it and press Open.
- Open the Save drop-down menu at the right of the screen and select Analyze. Navigate to the desired destination. Type the desired name into the File Name field. Select Save.
- Create image sequences using VolView imaging software.
- Open VolView.
- Select Open File at the left of the screen.
- Navigate to the analyze version of the CT data file for the desired scan. Select it and press Open.
NOTE: An Open File Wizard will appear. - Use the default settings by pressing Next in popup window.
- Select the Plugins tab at the left of the screen.
- Open the Plugin drop-down menu and select Utility > Merge Volumes.
- Uncheck Rescale Components.
- Select Assign Second Input.
- Navigate to the analyze version of the MicroPET data file for the same scan. Select it and press Open.
NOTE: An Open File Wizard will appear. - Use the default settings by pressing Next in each screen.
NOTE: The MicroPET scan will appear overlaid on the CT scan. - Select the Color/Opacity Settings tab at the left of the screen.
- Open the Component drop-down menu at the bottom right of the screen. Select 1.
NOTE: This will ensure that the CT scan is the only image affected by the following directions. - In the Scalar Color Mapping section, select the middle point. Remove it by dragging it out of the of the slider area.
- Select the left point.
NOTE: A Color Picker window will appear. - Change the color of the point to black.
- Select the right point.
NOTE: A Color Picker window will appear. - Change the color of the point to white.
- In the Scalar Opacity Mapping section, add a point by clicking anywhere in the box.
- Adjust the section until the CT image only displays the skeleton of the rat.
- Check Enable Shading.
- Select the Review tab at the left of the screen.
- Change Number of Frames to 72.
- Change X rotation to 360.
- Select Create.
- Navigate to the desired destination. Create a new folder to store the images by right clicking on empty space and selecting New > Folder.
- Type the desired name into the File Name field. Select Save.
NOTE: A Frame Size window will appear. - Select OK.
- Volview will generate the images. When it is finished, a window will appear stating “Your movie was created successfully!” Select OK.
- Return to the Color/Opacity Settings tab.
- Under Component Weight(s), adjust the slider for component 1 so it has the value of 0.
NOTE: Only the MicroPET scan will appear. - Repeat steps 5.2.21-28 to create a second image sequence.
- Return to the Color/Opacity Settings tab.
- Under Component Weight(s), adjust the slider for component 2 so it has the value of 0.
NOTE: Only the CT scan will appear. - Repeat steps 5.2.21-28 to create a third image sequence.
- Generate rotation movies (shown in video) using the ImageJ software.
- Open ImageJ.
- Select File > Import > Image Sequence.
- Navigate to the file containing the images that view only the CT data for the pre scan. Select the first image and press Select.
NOTE: A Sequence Options window will appear. - Select OK.
- Select File > Import > Image Sequence.
- Navigate to the file containing the images that view only the MicroPET data for the pre scan. Select the first image and press Select.
NOTE: A Sequence Options window will appear. - Select OK.
- Select File > Import > Image Sequence.
- Navigate to the file containing the images that view both the CT and MicroPET data for the pre scan. Select the first image and press Select.
NOTE: A Sequence Options window will appear. - Select OK.
- Select Image > Stacks > Tools > Combine.
NOTE: A Combiner window will appear. - Select the Stack1 drop-down menu. Select the stack that contains the CT data.
- Select the Stack2 drop-down menu. Select the stack that contains the MicroPET data. Select OK.
NOTE: A new stack with both scans will appear. - Select Image > Stacks > Tools > Combine.
NOTE: A Combiner window will appear. - Select the Stack1 drop-down menu. Select the stack that contains the combined stacks.
- Select the Stack2 drop-down menu. Select the stack that contains both the CT data and the MicroPET data. Select OK.
NOTE: A new stack with all three scans will appear. - Keep the combined stacks open. Repeat steps 5.3.2-16 for the 1.5 hr post scan and the 24 hr post scan image stacks.
- Select Image > Stacks > Tools > Combine.
NOTE: A Combiner window will appear. - Select the Stack1 drop-down menu. Select the stack that contains all the pre scan data.
- Select the Stack2 drop-down menu. Select the stack that contains all the 1.5 hr post scan data.
- Check Combine Vertically.
- Select OK.
NOTE: A new stack with both the pre scan and 1.5 hr post scan will appear. - Select Image > Stacks > Tools > Combine.
NOTE: A Combiner window will appear. - Select the Stack1 drop-down menu. Select the stack that contains the combined stacks.
- Select the Stack2 drop-down menu. Select the stack that contains all the 24 hr post scan data.
- Check Combine Vertically.
- Select OK.
NOTE: A new stack with all nine scans will appear. - Select File > Save As > AVI.
- Select OK.
- Navigate to the desired destination. Type the desired name into the File Name field. Select Save.
Results
Loading...
$$\rightleftharpoonup{xx}$$
$$\longleftharp{xx}$$,
$$\longrightharp{xx}$$,
Cerebral ischemia was initiated in live Sprague-Dawley rats via occlusion of the middle cerebral artery, with subsequent nuclear imaging performed to detect its effects. Live rats were imaged 24 hr before stroke induction, as well as 1.5 hr and 24 hr post ischemia, each with independent injections of approximately 500 µCi of 18F-FDG that fully decays within 18 hr. The three detector ring Albira system used for these studies has a sensitivity of 9%, making 500 µCi a reasonable dose for the rats. Representative imaging data for PET and X-ray CT scans are shown for a rat at the 24 hr pre- and 24 hr post-reperfusion time points in Figure 1, top and bottom rows respectively. The transverse (panels A and E), sagittal (panels B and F), and coronal (panels C and G) slices for each scan are presented with FDG-PET data colored in a “rainbow” intensity scale, and overlaid on the CT in greyscale. Note that CT was used for anatomical co-registration of the PET data within the animal skull, and no radiodensity changes in brain tissue were noted during these experiments. At 24 hr there was a dramatic decline in glucose uptake to the ipsilateral hemisphere, suggesting widespread tissue damage due to the induced ischemic stroke. A 3D rendering of the overlay data is presented in Figure 1D and H. When rotated on screen, these rendered data provide an enhanced visualization of the stroke-induced decrease in FDG uptake.
In order to quantify the alterations in cerebral glucose uptake due to stroke in a spatiotemporal manner, a VOI brain atlas was applied to pre-stroke baseline, 1.5 hr, and 24 hr (post-reperfusion) for each scan. This was accomplished using the PMOD software package in conjunction with the W. Schiffer rat brain template and atlas. First, PMOD was used to transform each of the rat brain PET data sets to the appropriate space and geometry via manual co-registration using the Move and Rotate tools under the Reslicing tab. Note that the scale tool is also available to adjust overall brain size, if necessary. While the use of the Schiffer atlas is superior to manually drawing VOIs within the brain space, there may be experimental error induced from inaccurate brain fusion. Thus, in some cases an increase in animal numbers may be needed to achieve statistical significance. Next, the W. Schiffer VOI brain atlas was automatically applied to measure the FDG accumulation, in standard uptake units, within defined sub-regions of the rat brain (Figure 2). The brain VOI atlas may also be used in an iterative fashion with the standard brain model to further optimize the manual fusion of the experimental data. As the stoke event was isolated to the right brain hemisphere in each animal, the damage to each region was quantified by calculating a ratio of glucose uptake activity between contralateral regions (Figure 2). The use of these ratios provides a convenient normalization between right and left hemisphere, and removes variability that may be encountered when comparing PET signal intensity values across different scans. At 1.5 hr post-stroke, 18F-FDG uptakes were not affected in the ischemic area. Therefore, no quantitative changes were observed in glucose uptake between the contralateral and ipsilateral hemispheres (Figure 3, blue and green bars). This could be due to hyper-uptake of glucose by the peri-ischemic region or increased glucose metabolism at this time point to compensate for loss of cellular ATP10,11. However, significant decrease in glucose uptake in specific regions of the ipsilateral hemisphere was observed across multiple animals (n = 5) at 24 hr post-reperfusion (Figure 3, red bars). Other brain regions displayed little or no damage in the ipsilateral hemisphere.
Specifically, the regions of the ipsilateral hemisphere that consistently exhibited diminished FDG uptakes were: amygdala, caudate putamen, the auditory, entorhinal, insular lobe, paracortex, and somatosensory regions of the cortex. Cortical lesions caused due to stroke are associated with loss of neuronal connections and altered functional maps. Structural abnormalities in the amygdala due to stroke lead to psychopathology and cognitive dysfunction12. It is not surprising that the caudate-putamen region was affected for FDG uptake as the cerebral blood flow in the lateral part of this region is supplied by the occluded middle cerebral artery13. The pathology in this region of rodent brain leads to impaired discriminating learning, cognitive processing, and non-motor functions14. Inability to take up FDG was also observed in the entorhinal cortex and auditory cortex in the medial temporal lobe of the ischemic hemisphere. In 2001, Davis et al. reported that entorhinal cortex damage in rats leads to impaired sensory integration and persistent spatial learning deificits15. Auditory dysfunction is known to occur in stroke in humans, though infrequently16. However, uptake of FDG by the inferior colliculus that is one of the major auditory pathways was not affected by stroke in our model. It has been demonstrated that MCAO-induced stroke rats increase epinephrine, norepinephrine, and sympathetic nerve activity due to infarct in the insular cortex, one of the regions in our model that showed poor FDG uptake17. This could result in changes in autonomic function affecting the cardiac system. Poor FDG uptake was also observed in the somatosensory area of the frontoparietal cortex. Ischemic infarct in this area has been reported to cause structural abnormalities and loss of thalamic connections18. Limited FDG uptake was also observed in the visual cortex, which could lead to impaired ocular dominance plasticity, as reported in rat neonates subjected to hypoxic ischemia19. However, decreased FDG uptake was not observed in the superior colliculus an area that is involved in visual motor guidance20. FDG uptake in the hippocampal area was also impaired, an area that is important in spatial memory and navigation. It was consistently observed that sub-regions of the midbrain, such as the superior and inferior colliculus, the ventral tegmental area (VTA), as well as the olfactory bulb of the forebrain, and the deep-seated thalamus were not affected by occlusion of the middle carotid artery (Figure 3).
Taken together, these results demonstrate that FDG-PET with CT provides a viable, reproducible, and non-invasive imaging strategy with which to monitor cerebral ischemia in rats in a longitudinal fashion.
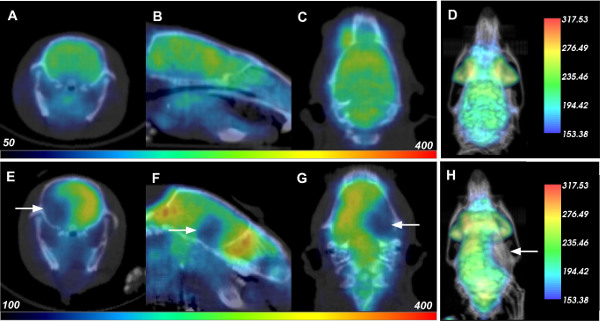
Figure 1: PET-CT Data of Rats Before and After Cerebral Ischemia. Each row displays the respective transverse (A, E), saggital (B, F), coronal (C, G), and 3D rendered (D, H) PET-CT data of a rat 24 hr before (top row) and 24 hr after reperfusion (or 26 hr after induction of cerebral ischemia; bottom). White arrows indicate location of decreased FDG uptake due to stroke damage. Please click here to view a larger version of this figure.
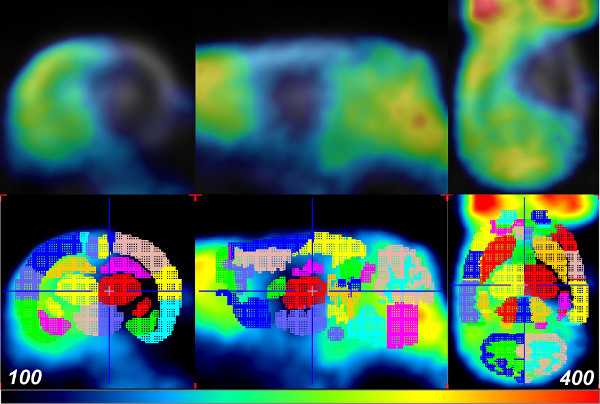
Figure 2: PET data aligned with the W. Schiffer Rat Brain atlas using PMOD. The FDG-PET data of a rat 24 hr after reperfusion (or 26 hr post-cerebral ischemia; top row) is fused with the VOI brain template atlas for analysis (bottom row). Colors indicate the separate VOIs of the brain template atlas. Please click here to view a larger version of this figure.
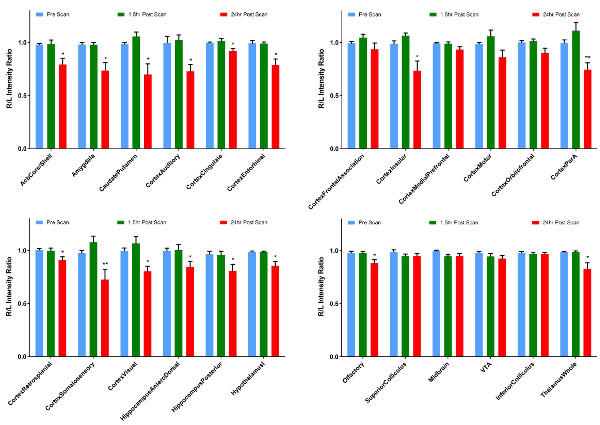
Figure 3: Representative Quantitative Analysis of Glucose Uptake in Rat Brain by Section. Ratios of right to left hemisphere FDG PET signal in Standard Uptake Units from each region of the W. Schiffer Rat Brain Atlas reported for scans taken before ischemic stroke event (pre; blue), 1.5 hr (green) and 24 hr (red) post-reperfusion (or 26 hr post-reperfusion). Error bars represent standard error for n = 5 rat brain stroke events, at each time point. **p ≤ 0.01, *p ≤ 0.05 (paired t-test). Please click here to view a larger version of this figure.
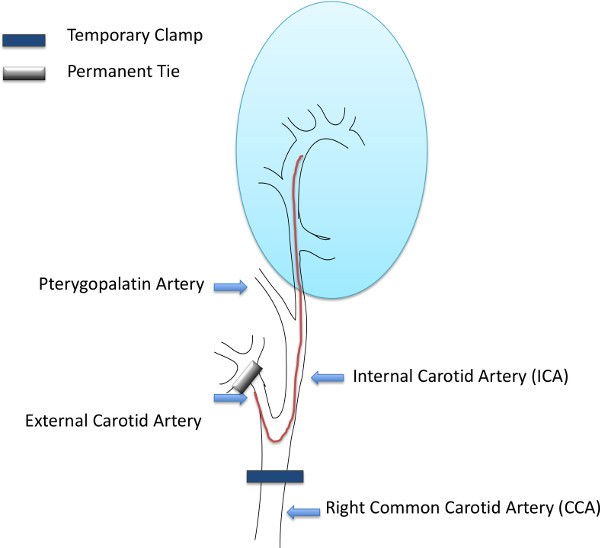
Figure 4: Illustration of MCAO Surgery. The red line is the occluder that is inserted into the external carotid artery. The blue oval represents the area of the brain.
Discussion
Loading...
$$\rightleftharpoonup{xx}$$
$$\longleftharp{xx}$$,
$$\longrightharp{xx}$$,
Here we present a detailed strategy for stroke induction, PET imaging, and standardized brain sub-region measurement of tissue damage in Sprague-Dawley rats. Imaging of small animal models, especially in the area of stroke is beneficial, as treatment for stroke to be effective depends on an extremely short therapeutic time. Here we present an injury-reperfusion model, wherein stroke was induced via an occlusion to the middle cerebral artery, and imaging conducted using FDG with PET, alongside an X-ray CT for anatomical reference. Regimented measurements of FDG uptake within brain sub-regions was made possible by precise mapping of the VOI template atlas onto the rat brain within the PMOD image analysis software. Ratiometric FDG values were collected by dividing corresponding brain sub-regions in opposing hemispheres, which allows a straightforward measurement of damage while normalizing for variations in global FDG PET signal between different animals and time points. These measurements are consistent with the expected effect of stroke on the rat brain, demonstrating consistently, significant loss of brain tissue glucose uptake in certain regions of the ipsilateral hemisphere. This methodology has the potential to augment our ability to compare FDG PET data sets of animals undergoing many types of brain trauma, including ischemic stroke. By standardizing the volumes to be quantified across hemispheres of the brain and across multiple animals, this method generates consistent measurements of decreased tissue glucose uptake. Note that other PET tracers with brain uptake, like 11C-raclopride for D2 receptors, may be used with this protocol as well21. Finally, we describe a method to visualize an ischemic stroke in a rat brain within its skeleton with high anatomical accuracy in three dimensions. Since stroke-induced physiological and functional impairment could be transient or permanent, this non-invasive method of imaging allows researchers to evaluate brain damage in the same animal over a period of time. It provides a way to neurologically score the rats, as well assess short- and long-term neurological deficits in the same animal. The template function of the PMOD software allows researchers with a certain amount of precision to map the injury area and perhaps correlate to neurological sequelae and behavioral patterns.
For accurate quantification of stroke damage by brain subregion, the key step is alignment of the PET data with the rat brain atlas within PMOD. Inconsistencies in alignment can lead to incorrect quantification of brain subregions affected by ischemia. As described in the protocol step 4.1.7, it is possible to use the harderian glands as landmarks for aligning the brain atlas with experimental PET data. Partial volume effects (PVE) are a concern during this type of analysis, and will limit the overall resolution of brain structure that may be imaged. Signal spillover may occur between adjacent volumes, or the VOI itself might be too small in relation to the instrument resolution, thus reducing the quantitative accuracy of the method22. The Albira PET system used in these studies is equipped with three detector rings and yields a resolution of 1.1 mm, which evolved from corresponding one-ring system that achieved 1.5 mm23. Buvat and co-workers note that PVE will affect measurements of tumors with a diameter less than 2-3x the system resolution at full width half max (FWHM), which would correspond to a spherical volume of 5.6-18.9 mm3 for the 3-ring Albira. Casteels et al. recently stated that volumes greater than 8 mm3 will have minimal partial volume effects for modern pre-clinical PET scanners with resolution in the range of 1.1-1.3 mm 24. The Schiffer atlas has been carefully constructed with these parameters in mind, and utilizes 58 VOIs, of which 13 fall below the 8 mm3 threshold. These include the VOIs for right and left hemispheres of the medial prefrontal cortex (6.3 mm3, R/L), the Par A Cortex (7.6 mm3, R/L), the superior colliculus (7.1 mm3, R/L), the VTA (5.5 mm3, R/L), inferior colliculus (5.7 mm3, R/L), pituitary gland (5.9 mm3), and the CB bloodflow (5.1 mm3). In addition, measurements of the frontal cortex (1.4 mm3 R/L) will be the most susceptible to PVE due to its small size.
Studies in larger animals like rats, which have a corresponding increase in the size of the anatomy, will have a larger number of brain sub-regions that may be reliably quantified compared to mice. Nevertheless, these methods are applicable to brain imaging in mice, which have their own brain atlas available in PMOD that is composed of 18 subregions that are sized to minimize PVE. Further, using PET to identify even smaller brain regions than are described in this study may require using alternative methodology. The method described here enables regimented and efficient quantification of brain tissue damage over time, segmented by brain subregion, in live rats. Injury due to ischemia is demonstrated here as an example, but the methodology presented for quantification of changes in brain activity can be applied to any other condition affecting the rat brain.
In conclusion, FDG-PET-CT data of small animals may be acquired in a non-invasive and economical manner, and can be conveniently used for small animal imaging in a quantitative fashion. Utilizing the Schiffer template tool of the PMOD program, ischemic areas of the brain can be delineated and the PET data measured. This is a powerful tool for the future study of brain reorganization, repair, and neurogenesis after cerebral ischemia that will promote development of neuro-therapies of disabled stroke patients. This visualization will also be particularly useful in evaluating other cases of brain trauma, where the tissue damage can be aligned from separate imaging modalities.
Disclosures
Loading...
$$\rightleftharpoonup{xx}$$
$$\longleftharp{xx}$$,
$$\longrightharp{xx}$$,
WML is a consultant for Bruker Molecular Imaging
Acknowledgements
Loading...
$$\rightleftharpoonup{xx}$$
$$\longleftharp{xx}$$,
$$\longrightharp{xx}$$,
This study was supported by a grant from Bruker Molecular Imaging (to WML) and from the NIH (Grant HL019982 to FJC).
Materials
| Name | Company | Catalog Number | Comments |
|---|---|---|---|
| Albira PET SPECT CT | Bruker | 3D molecular imaging equipment | |
| Sprague Dawley Rats | Charles River Laboratories | 400 | Animal Subjects |
| 18-F-D-Glucose | Spectron | PET compound | |
| micro clamp | FST | 18055-03 | artery clamp |
| occluder #4037 | Doccol Corp. | 403712PK10 | surgical stroke induction |
References
Loading...
$$\rightleftharpoonup{xx}$$
$$\longleftharp{xx}$$,
$$\longrightharp{xx}$$,
- Minino, A. M., Murphy, S. L., Xu, J., Kochanek, K. D. Deaths: final data for 2008. Natl Vital Stat Rep. 59, 1-126 (2011).
- Niemi, M. L., Laaksonen, R., Kotila, M., Waltimo, O. Quality of life 4 years after stroke. Stroke. 19, 1101-1107 (1988).
- Ter-Pogossian, M. M., Phelps, M. E., Hoffman, E. J., Mullani, N. A. A positron-emission transaxial tomograph for nuclear imaging. 114, 89-98 (1975).
- Schiffer, W. K., et al. Serial microPET measures of the metabolic reaction to a microdialysis probe implant. J Neurosci Methods. 155, 272-284 (2006).
- Roger, V. L., et al. Heart disease and stroke statistics--2012 update: a report from the American Heart Association. Circulation. 125, e2-e220 (2012).
- Heiss, W. D., et al. Progressive derangement of periinfarct viable tissue in ischemic stroke. J Cereb Blood Flow Metab. 12, 193-203 (1992).
- Foster, N. L., et al. Alzheimer's disease: focal cortical changes shown by positron emission tomography. Neurology. 33, 961-965 (1983).
- Bustamante, E., Pedersen, P. L. High aerobic glycolysis of rat hepatoma cells in culture: role of mitochondrial hexokinase. Proc Natl Acad Sci U S A. 74, 3735-3739 (1977).
- Toga, A. W., Santori, E. M., Hazani, R., Ambach, K. A 3D digital map of rat brain. Brain Res Bull. 38, 77-85 (1995).
- Yuan, H., et al. Saptiotemporal uptake characteristics of [18]F-2-Fluoro-2-Deoxy-D-Glucose in a rat middle cerebral artery occlusion model. Stroke. 44, (2013).
- Nemoto, E. M., Hossmann, K. A., Cooper, H. K. Post-ischemic hypermetabolism in cat brain. Stroke. 12 (5), 666-676 (1981).
- Sachdev, P. S., Chen, X., Joscelyne, A., Wen, W., Brodaty, H. Amygdala in stroke/transient ischemic attack patients and its relationship to cognitive impairment and psychopathology: the Sydney stroke study. Am. J. Geriatr. Psychiatry. 15, 487-496 (2007).
- Nagasawa, H., Kogure, K. Correlation between cerebral blood flow and histologic changes in a new rat model of middle cerebral artery occlusion. Stroke. 20, 1037-1043 (1989).
- Hauber, W., Schmidt, W. J. Differential effects of lesions of the dorsomedial and dorsolateral caudate-putamen on reaction time performance in rats. Behavioral Brain Research. 60, 211-215 (1994).
- Davis, A. E., Gimenez, A. M., Therrien, B. Effects of entorhinal cortex lesions on sensory integration and spatial learning. Nurs. Res. 50, 77-85 (2001).
- Hausler, R., Levine, R. A. Auditory dysfunction in stroke. Acta Otolaryngol. 120, 689-703 (2000).
- Cechetto, D. F., Wilson, J. X., Smith, K. E., Wolski, D., Silver, M. D., Hachinski, V. C. Autonomic and myocardial changes in middle cerebral artery occlusion: stroke models in the rat. Brain Res. 502, 5296-5305 (1989).
- Carmichael, S. T., Wei, L., Rovainen, C. M., Woolsey, T. A. New patterns of intracortical projections after focal cortical strike. Neurobiol. of Disease. 8, 910-922 (2001).
- Failor, S., et al. Neonatal cerebral hypoxia-ischemia impairs plasticity in rat visual cortex. J. Neurosci. 30, 81-92 (2010).
- Wurtz, R. H., Albano, J. E. Visual-motor function of the primate superior colliculus. Ann. Rev. Neurosci. 3, 189-226 (1980).
- Kuhn, F. P., et al. Comparison of PET template-based and MRI-based image processing in the quantitative analysis of C11-raclopride PET. EJNMMI Res. 4 (1), 7(2014).
- Soret, M., Bacharach, S. L., Buvat, I. Partial-Volume Effect in PET Tumor Imaging. J. Nuc. Med. 48, 932-945 (2007).
- Sanchez, F., et al. ALBIRA: A Small Animal PET/SPECT/CT Imaging System. Med. Phys. 40 (5), 051906(2013).
- Casteels, C., et al. Construction and Evaluation of Quantitative Small-Animal PET Probabilistic Atlases for [18F]FDG and [18F]FECT Functional Mapping of the Mouse Brain. PLOS One. 8 (6), e65286(2013).
Reprints and Permissions
Request permission to reuse the text or figures of this JoVE article
Request Permission