Three-dimensional (3D) microstructured composite beams are fabricated through the directed and localized infiltration of nanocomposites into 3D porous microfluidic networks. The flexibility of this manufacturing method enables the utilization of different thermosetting materials and nanofillers in order to achieve a variety of functional 3D reinforced nanocomposite macroscopic products.
Method Article
Manufacturing of Three-dimensionally Microstructured Nanocomposites through Microfluidic Infiltration
In This Article
Summary
Abstract
Microstructured composite beams reinforced with complex three-dimensionally (3D) patterned nanocomposite microfilaments are fabricated via nanocomposite infiltration of 3D interconnected microfluidic networks. The manufacturing of the reinforced beams begins with the fabrication of microfluidic networks, which involves layer-by-layer deposition of fugitive ink filaments using a dispensing robot, filling the empty space between filaments using a low viscosity resin, curing the resin and finally removing the ink. Self-supported 3D structures with other geometries and many layers (e.g. a few hundreds layers) could be built using this method. The resulting tubular microfluidic networks are then infiltrated with thermosetting nanocomposite suspensions containing nanofillers (e.g. single-walled carbon nanotubes), and subsequently cured. The infiltration is done by applying a pressure gradient between two ends of the empty network (either by applying a vacuum or vacuum-assisted microinjection). Prior to the infiltration, the nanocomposite suspensions are prepared by dispersing nanofillers into polymer matrices using ultrasonication and three-roll mixing methods. The nanocomposites (i.e. materials infiltrated) are then solidified under UV exposure/heat cure, resulting in a 3D-reinforced composite structure. The technique presented here enables the design of functional nanocomposite macroscopic products for microengineering applications such as actuators and sensors.
Introduction
Polymer nanocomposites using nanomaterials, especially carbon nanotubes (CNTs) incorporated into polymer matrices feature multifunctional properties1 for potential applications such as structural composites2, microelectromechanical systems3 (e.g. microsensors), and smart polymers4. Several processing steps including CNT treatment and nanocomposite mixing methods may be required to desirably disperse CNTs into the matrix. Since the CNTs' aspect ratio, their dispersion state and surface treatment mainly influence the electrical and mechanical performance, the nanocomposite processing procedure may vary depending on desired properties for a targeted application5. Moreover, for specific loading conditions, aligning CNTs along a desired direction and also positioning the reinforcements at desired locations enable further improvement of the mechanical and/or electrical properties of these nanocomposites.
A few techniques such as shear flow6-7and electromagnetic fields8 have been used to align the CNTs along a desired direction in a polymer matrix. Moreover, CNT orientation induced by dimensional constraining, specifically in one-dimension (1D) and two-dimension (2D), has been observed during the processing/forming of nanocomposite materials9-11. However, new advances on the manufacturing processes are still needed to allow sufficient control of the three-dimensional (3D) orientation and/or positioning of the nanotube reinforcement during the manufacturing of a product for optimal conditions.
In this paper, we present a protocol for manufacturing 3D-reinforced composite beams via directed and localized infiltration of a 3D microfluidic network with polymer nanocomposite suspensions (Figure 1). First, the fabrication of a 3D interconnected microfluidic network is demonstrated, which involves the direct-write fabrication of the fugitive ink filaments12-13 on epoxy substrates (Figures 2a and 2b), followed by epoxy encapsulation (Figure 2c) and the sacrificial ink removal (Figure 2d). The direct-write method consists of a computer-controlled robot that moves a fluid dispenser along the x, y, and z axes (Figure 3). This technique provides a fast and flexible way to fabricate 3D microdevices for photonic, MEMS and biotechnology applications (Figure 4). Then, the nanocomposite preparation is demonstrated, along with its infiltration (or injection) into the porous network under different controlled and constant pressures to manufacture 3D-reinforced multiscale composites (Figures 2e and 2f). Finally, some representative results along with their potential applications are shown.
Protocol
1. Fabrication of 3D Microfluidic Networks
- Melt the fugitive ink at 80 °C and load it into a 3 ml syringe barrel.
Note: The fugitive ink is a binary mixture of a microcrystalline wax and a petroleum jelly with a weight proportion of 40:60. - Choose a deposition nozzle depending on the desired filament diameter (e.g. internal diameter (ID) = 150 µm).
- Install the nozzle on the syringe barrel containing the ink material and mount it onto the syringe holder of the dispensing robot.
- Use an Excel program to design the moving path of the dispensing robot for the fabrication of the desired 3D scaffold structure.
Note: The overall dimensions of the 3D ink structure and filaments' spacing in a given layer can be easily programmed; in this case, the dimensions are 60 mm in length, 7.5 mm in width, and 1.7 mm in thickness with 0.25 mm horizontal spacing between each filament. - Set the deposition pressure on the pressure regulator and the robot dispensing speed.
Note: The fugitive ink filament diameter varies depending on the nozzle diameter, deposition pressure, ink viscosity and dispensing speed. Here, the filament diameter is ~150 µm for a deposition speed of 4.7 mm/sec at an extrusion pressure of 1.9 MPa. - Start the fabrication of the microscaffold with the deposition of the ink-based filaments on an epoxy substrate, which leads to a 2D pattern (Figure 2a).
- Deposit the subsequent layers by successively incrementing the z-position of the dispensing nozzle by an amount equal to the diameter of the filaments (Figure 2b).
Note: Self-supported 3D structures with other geometries and many layers (e.g. a few hundreds layers) could be built. - Mix the two parts of epoxy (i.e. the resin and the hardener) used for the encapsulation and degas the epoxy mixture under vacuum for a defined time (here, 0.15 bar for 30 min) to remove the bubbles trapped during mixing of the epoxy components.
Note: The degassing time may vary with the gel time of the epoxy mixture. For a different epoxy system, the required degassing time may be shorter or longer. - Load the epoxy resin into a 3 ml syringe barrel using a fluid dispenser by applying a negative pressure and then mount a fine nozzle (e.g. ID = 0.51 mm) into the syringe barrel.
- Place drops of epoxy over the inclined scaffold structure at its upper end using the same fluid dispenser and mounted nozzle to minimize the risk of bubble trapping during the epoxy encapsulation.
Note: The epoxy then flows into the empty spaces between filaments, driven by gravity and capillary forces. - Continue placing drops of epoxy over the scaffold until the empty space between the scaffold filaments is completely filled.
- Let the encapsulating epoxy precure at room temperature for 24 hr and then put the structure in an oven for post-curing at 60 °C (Figure 2c).
Note: A different cure schedule may be applied for a different epoxy system. - Cut the excess parts of epoxy using a precision saw after complete curing.
- Drill two holes at two ends of the structure and insert two plastic tubes.
- Remove the fugitive ink from the structure as following:
- Put the samples in an oven at 90 °C for 30 min for the ink liquefaction (Figure 2d).
- Shortly after taking the samples out of the oven, wash the channel network with the suction of hot distilled water through the tubes attached to the opened channels for 5 min followed by hexane for another 5 min.
Note: The ink removal yields an interconnected 3D microfluidic network (Figure 5). Post-cleaning of the networks using hexane is performed in order to remove the possible residual traces of the ink from the channel walls.
2. Nanocomposite Preparation
Note: The nanocomposites are prepared by blending a dual cure (ultraviolet/heat curable) thermosetting resin, either an epoxy resin or a urethane-based resin and nanofillers (here, single-walled carbon nanotubes) at different loadings.
- Add the desired amount of nanotubes to a solution of 0.1 mM of a surfactant (zinc protoporphyrin IX) either in acetone or dichloromethane14 (Figure 6).
Note: Here, 150 mg of CNTs was added to the solution (~50 ml) in order to prepare a nanocomposite with a final nanotube concentration of 0.5% wt. It should be also mentioned that the use of high boiling temperature solvents like DMF should be avoided due to possible heat-curing of the UV-epoxy used in this study at temperatures above 60 °C during the solvent evaporation. - Sonicate the suspension in an ultrasonic bath for 30 min to debundle the nanotube aggregates (Figure 6).
Note: Additional efforts such as filtration or ultracentrifugation of the nanotube solution should be made to remove the remaining big clusters before mixing with the resin. - Mix the resin (either epoxy or urethane) with the nanotube suspension over a magnetic stirring hot plate at a temperature slightly below the solvent boiling temperature (e.g. 50 °C for acetone solution) for 4 hr.
- Place the nanocomposite mixture into the ultrasonication bath and simultaneously apply the sonication and heating (40-50 °C) for 1 hr (Figure 6).
- Let the residual solvent evaporate by heating the nanocomposite at 30 °C for 12 hr and then at 50 °C for 24 hr under vacuum (~0.1 bar).
- Shear mix the nanocomposite materials by passing them through a small gap between the rolls in a three-roll mill mixer in order to break large nanotube aggregates (Figure 6). Keep a portion of nanocomposite prior to three-roll mixing for baseline comparison.
- Set the three-roll mixing parameters (i.e. gaps and rotating speed).
Note: Here, a constant speed of 250 rpm is used for the apron roll. However, the gaps between rolls are reduced in three-step processing as follows: 5 passes at 25 µm, 5 passes at 10 µm, and 10 passes at 5 µm, respectively. - Degas the final mixture under vacuum of ~0.1 bar for 24 hr using a desiccator to remove the air bubbles trapped during the mixing.
3. Nanocomposite Infiltration (Injection)
- Load the nanocomposites, prepared in section 2, into a 3 ml syringe barrel using the fluid dispenser by applying a negative pressure.
- Insert a fine nozzle (e.g. ID = 0.51 mm) that fits into the plastic tubes attached to the opened channels (same tubes used for the ink removal) and mount it into the syringe barrel containing the nanocomposite materials.
- Set the desired pressure (i.e. positive pressure) on the pressure dispenser.
Note: Here, the nanocomposite injection pressure is set at 400 kPa.
Note: A vacuum (i.e. negative pressure) could be applied to the other end (i.e. outlet side) to assist the network filling. Once the pressure is applied, the microfluidic network, built in Protocol 1, is filled by nanocomposite suspension, which enters the network through the plastic tubes. - Shortly after the injection, expose the nanocomposite-filled composite beams to UV illumination of a UV lamp for 30 min for precuring.
Note: This precuring operation is thought to reduce the effect of Brownian motion on the CNTs possible orientation. It also reduces the heat-induced shrinkage (Figure 7) - Post-cure the manufactured beams in the oven at, in the case of UV-epoxy, 80 °C for 1 hr followed by 130 °C for another 1 hr (Figure 7).
- Cut the excess epoxy parts using a saw and then polish the beams to the desired dimensions (here, ~60 mm in length, ~6.8 mm in width, and ~1.6 mm in thickness of the beams were manufactured for ease of mechanical characterization).
Results
Figures 8a and 8b show a representative image of manufactured beams and an optical image of its cross-section, consisting of nine layers of the nanocomposite filaments.
Figures 8c and 8d show typical SEM images of a manufactured beams fracture surface and a higher magnification image of filled channels (i.e. embedded nanocomposite microfibers), respectively. Since no debonding is seen at the channels wall, it is fair to say that the surrounding epoxy and the infiltrated materials are well adhered as a result of proper cleaning of the channels with hexane after the ink removal.
Figure 9 shows a representative optical image of a beam broken during the mechanical testing in which hexane is not used during the ink removal. Fiber debonding, as a result of poor mechanical interface is observed which might be due to fugitive ink traces remained after network cleaning.
Figure 10 shows the storage modulus, E', of the molded bulk epoxy samples (as benchmarks) and the 3D-reinforced beams. The results show unique trends for the manufactured beams which are the combination of the embedded and surrounding epoxy materials with superior properties with the presence of only ~0.18 wt. % CNTs.
Figure 11 shows the three-point bending test results of the manufactured composite beams using a DMA. As a result of CNTs positioning, the flexural modulus of the 3D reinforced beams showed an increase of 34% compared to the pure epoxy-infiltrated (whole epoxy) beams.

Figure 1. Schematic representation of a 3D-reinforced nanocomposite manufactured by the microinfiltration approach. Click here to view larger image.
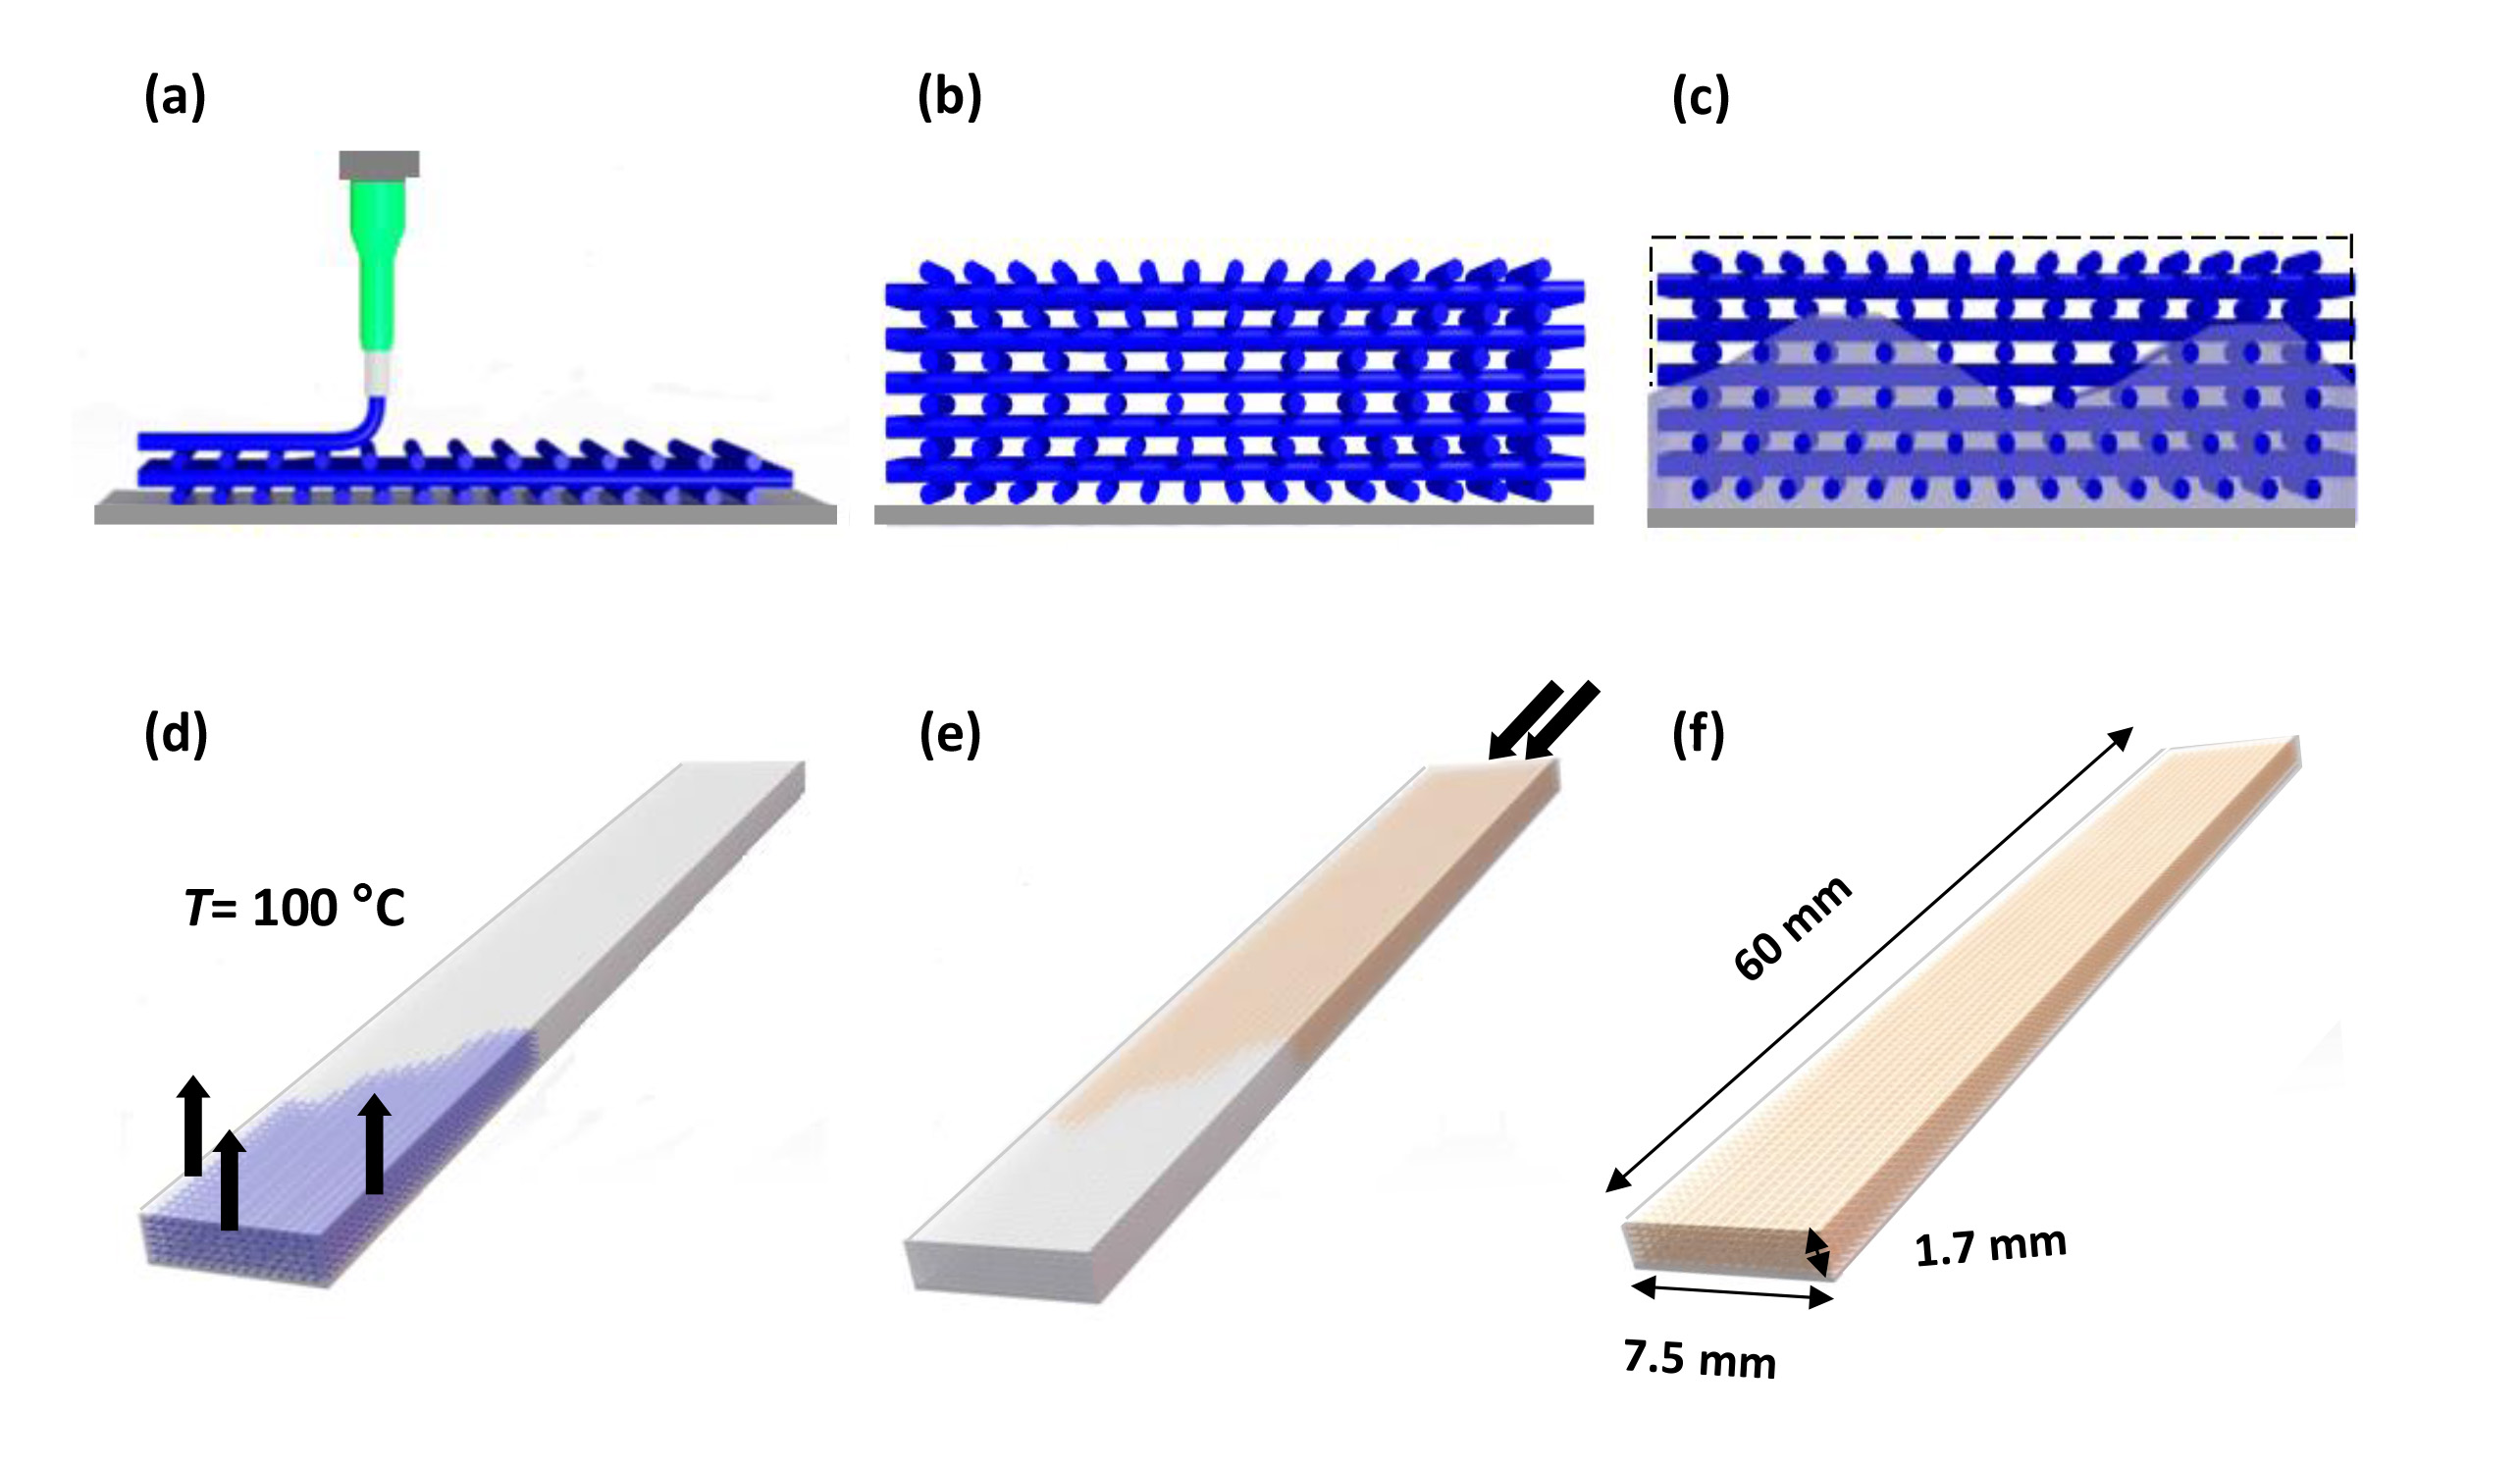
Figure 2. Schematic representation of the manufacturing of 3D-reinforced beams. (a) Ink filament direct deposition using a dispensing robot, (b) Deposition of several layers on top of each other by incrementing the dispensing nozzle in z-direction, (c) Filling the pore space between filaments using a low viscosity resin, (d) Taking the ink out of the network by its liquefaction, resulting in the fabrication of microfluidic channels. (e) Filling the empty network with the nanocomposite suspension followed by curing, and (f) Cutting the excess epoxy parts. Click here to view larger image.
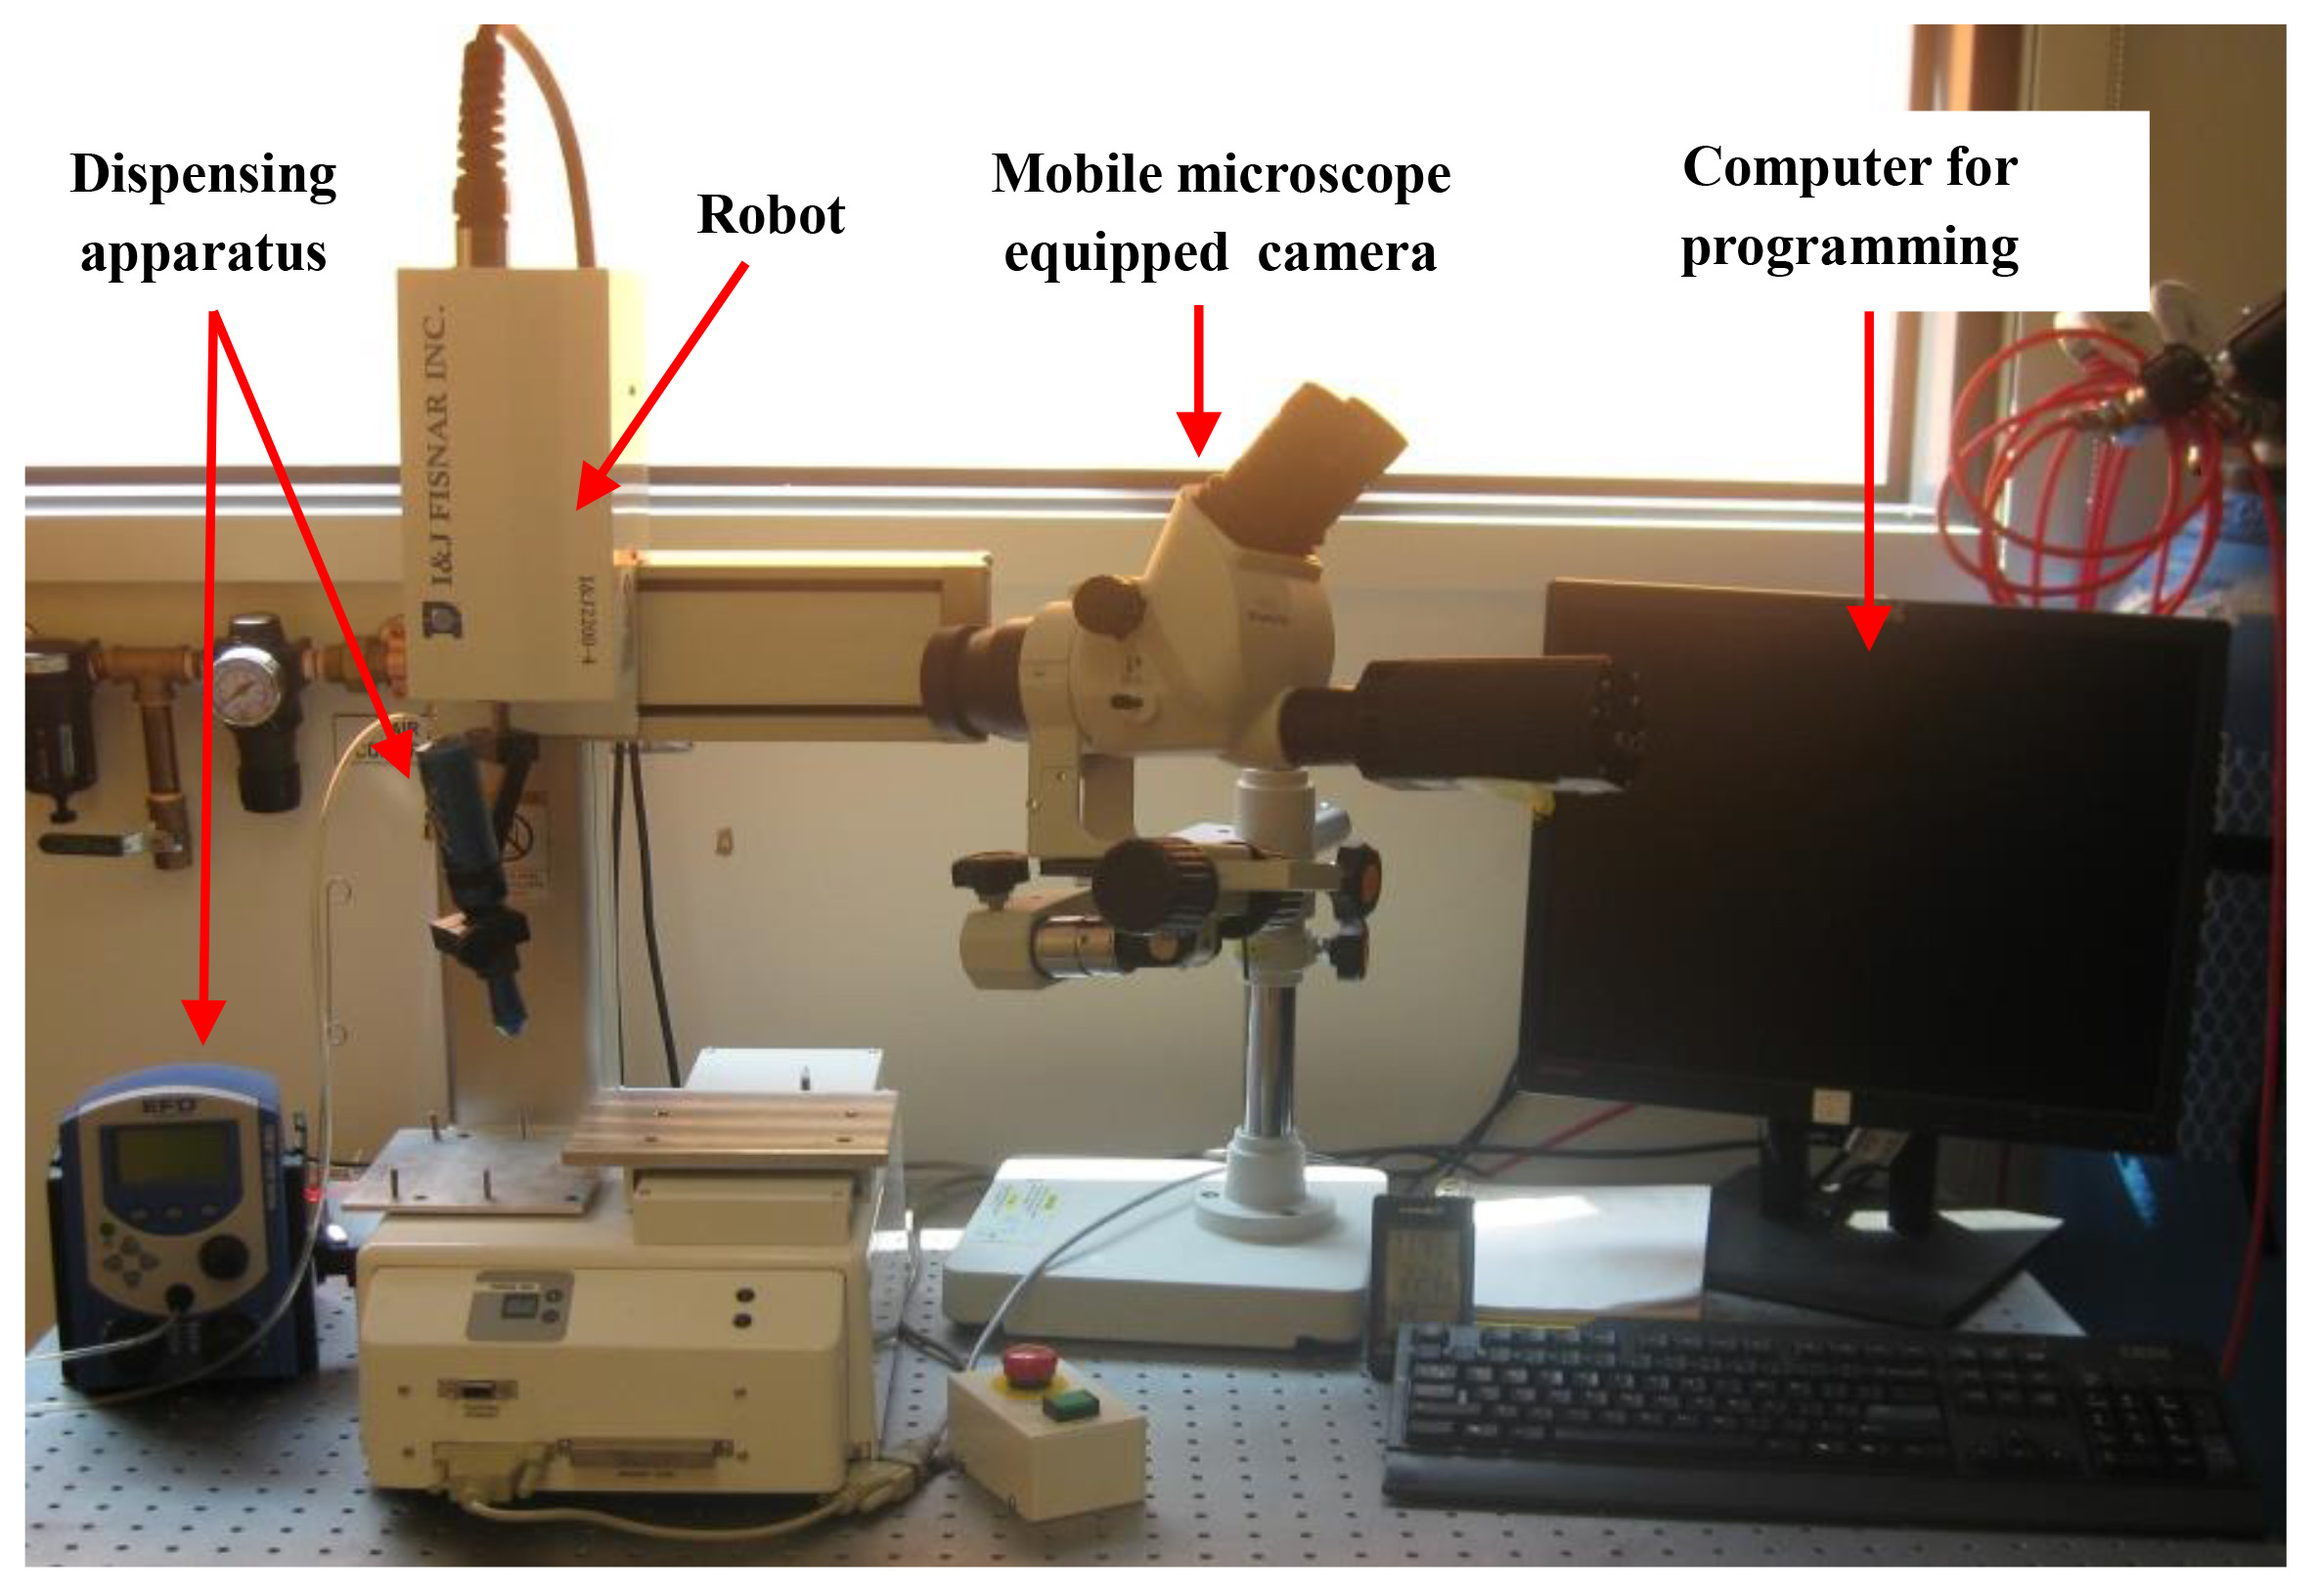
Figure 3. A photo of the robotic deposition stage consisting of a computer-controlled robot, a dispensing apparatus, and a live camera. Click here to view larger image.

Figure 4. A few images of microstructures manufactured by the direct-write assembly. Click here to view larger image.
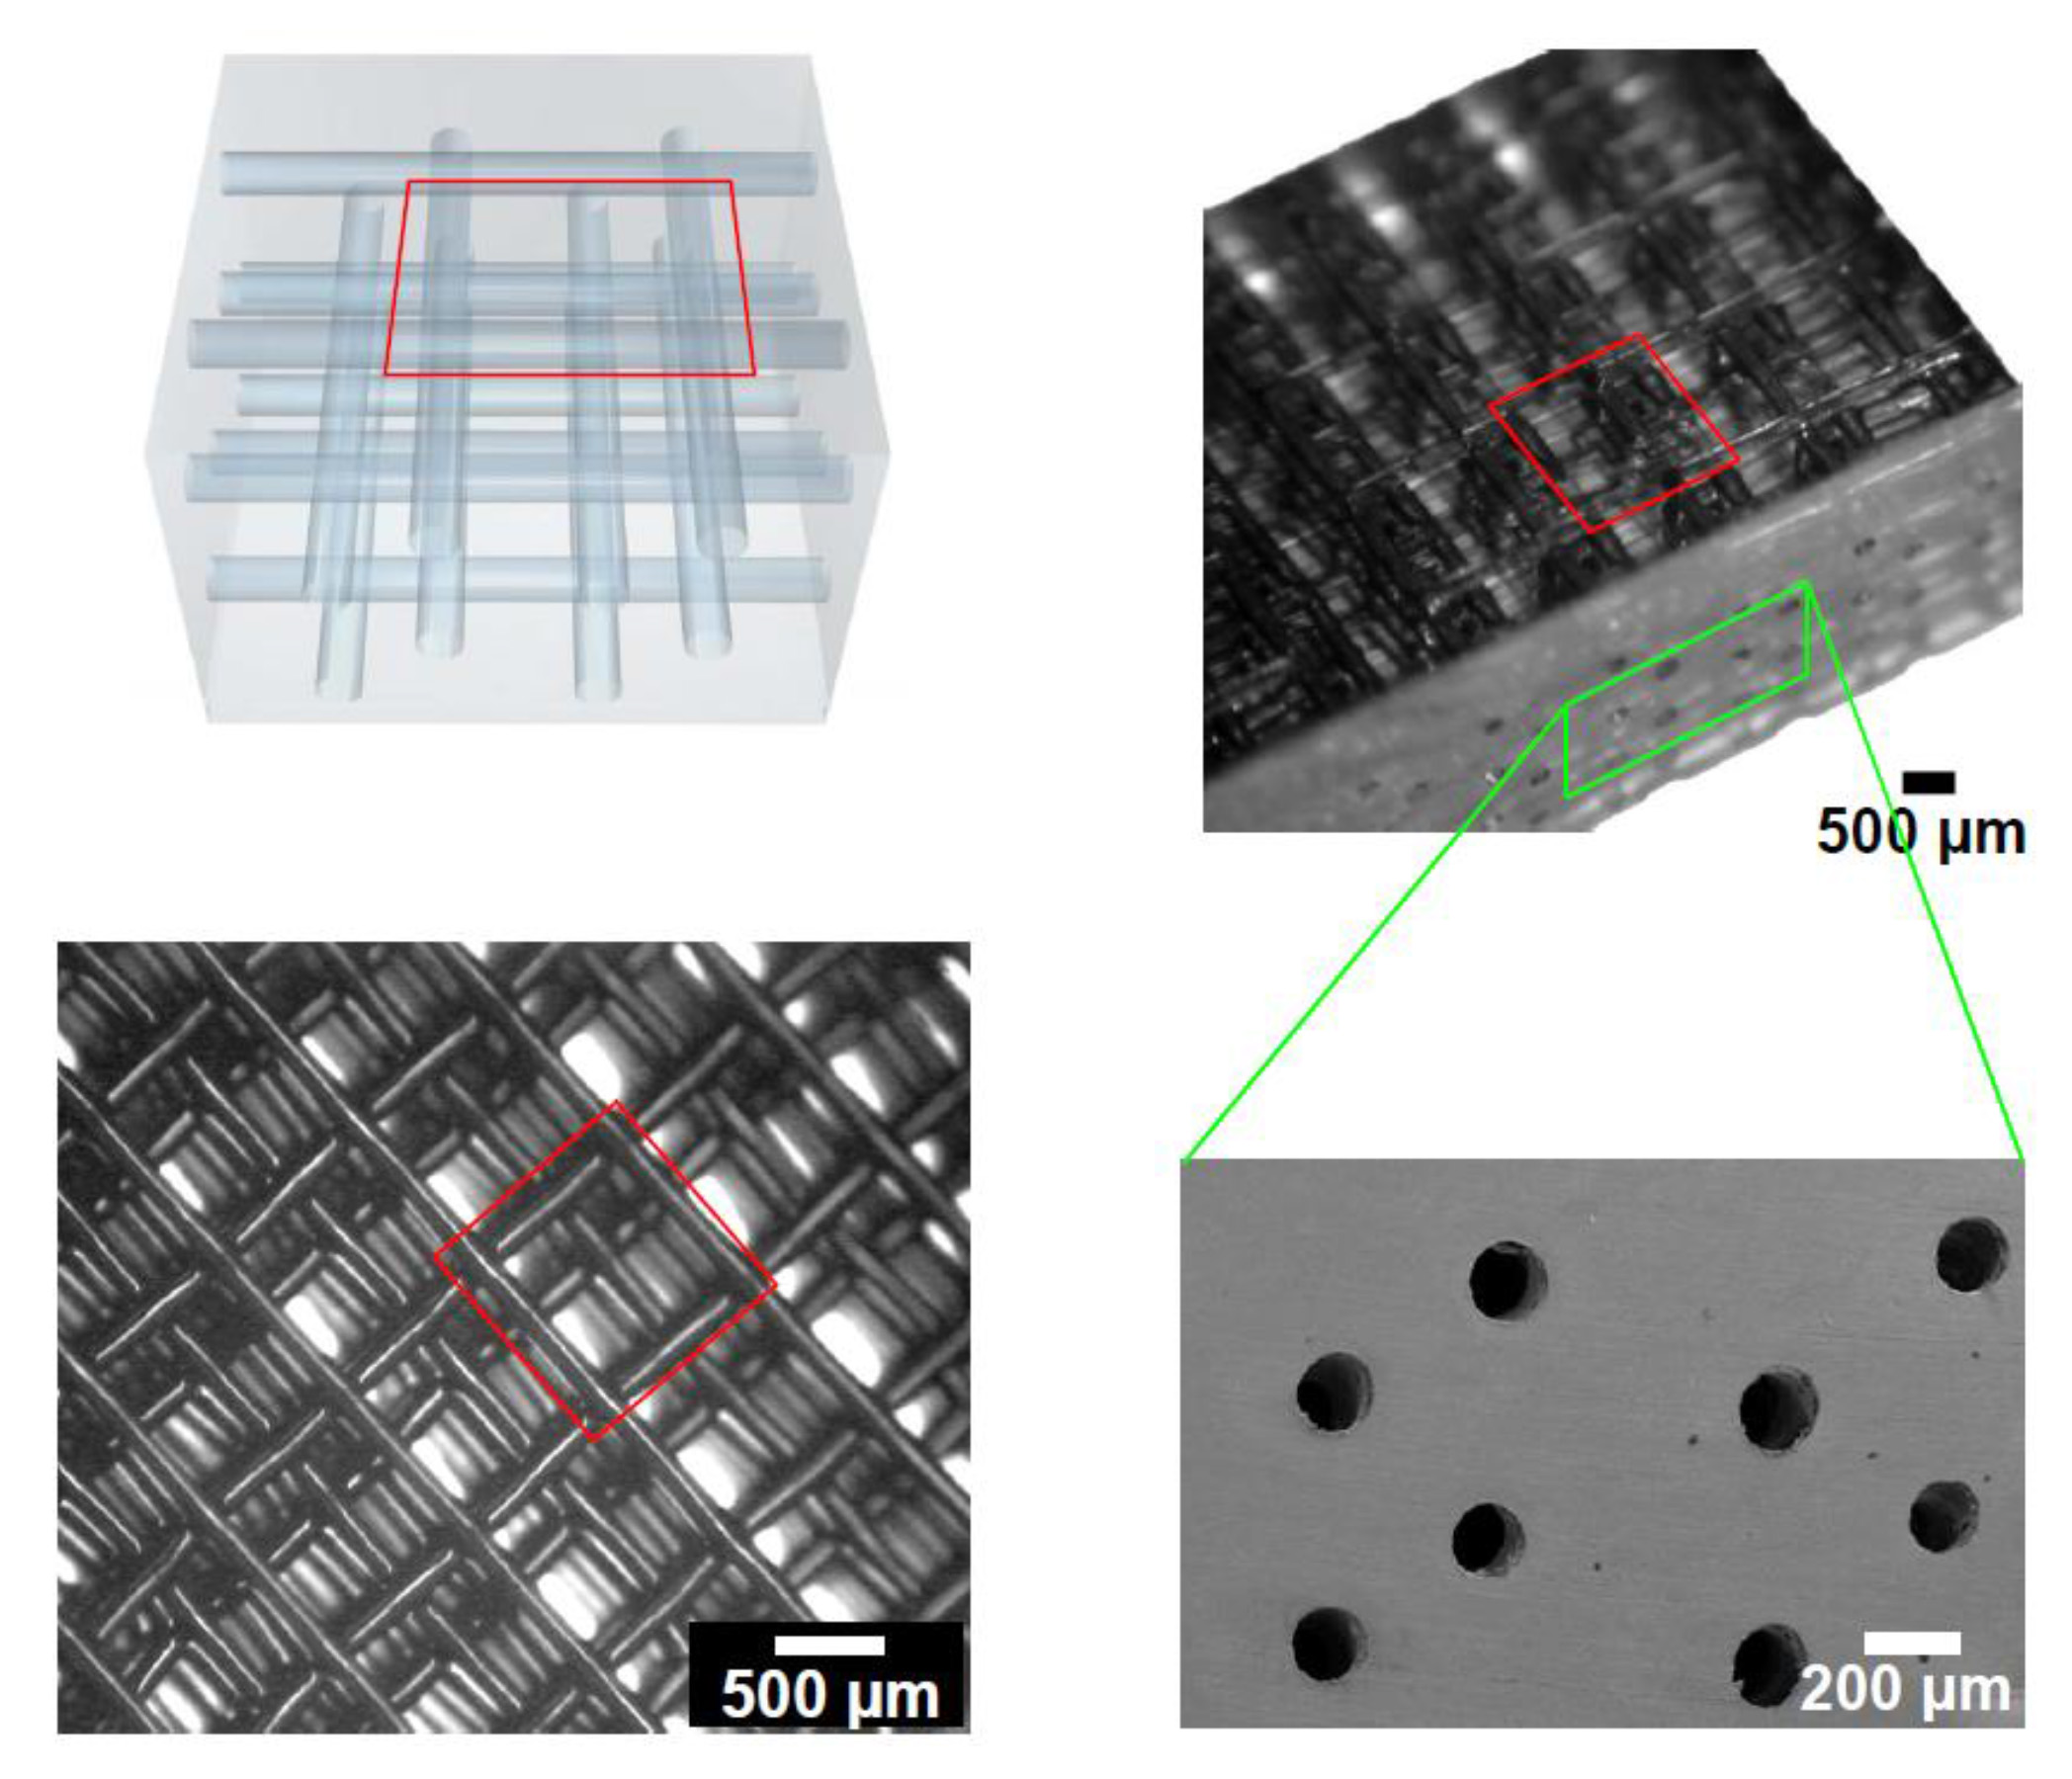
Figure 5. An isometric view and a SEM image the 3D-connected microfluidic empty network. Click here to view larger image.
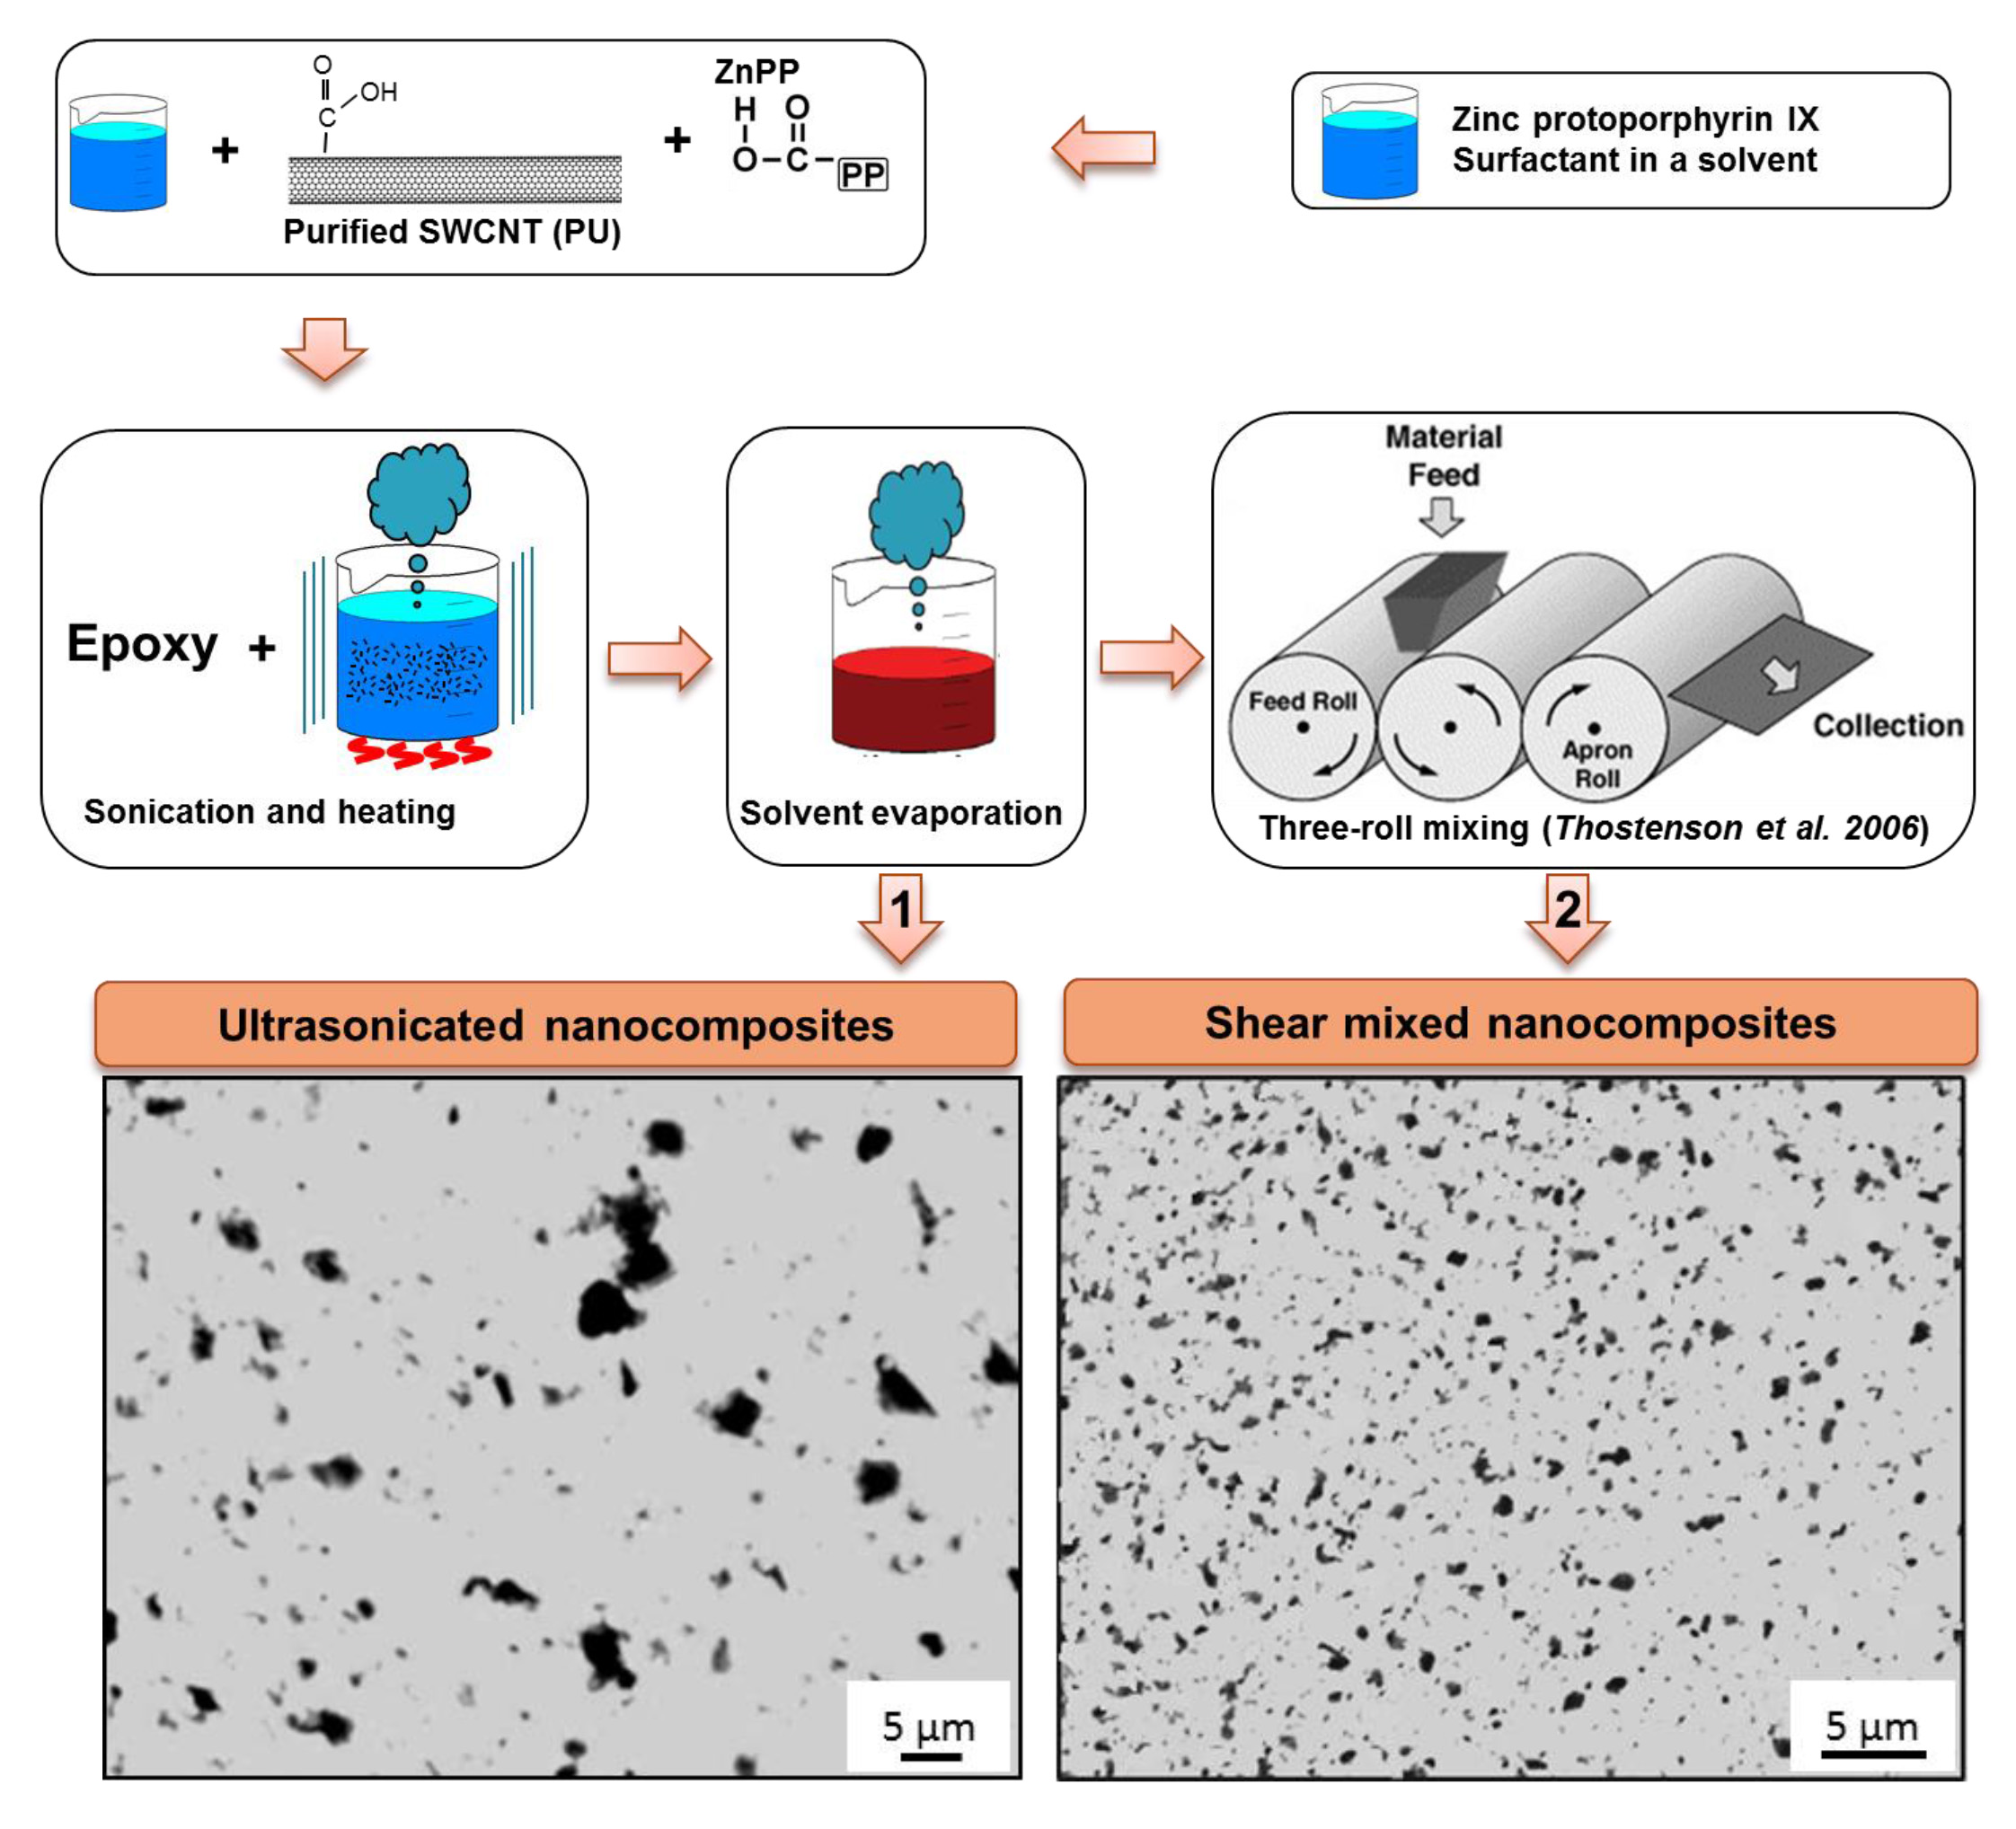
Figure 6. Nanocomposite mixing strategies including nanotube noncovalent functionalization, ultrasonication, and/or three-roll mill mixing which lead to nanotube dispersions with different qualities (optical images of nanocomposite films). Click here to view larger image.

Figure 7. Nanocomposite curing under UV illumination of a UV-lamp followed by post-curing in the oven. Click here to view larger image.
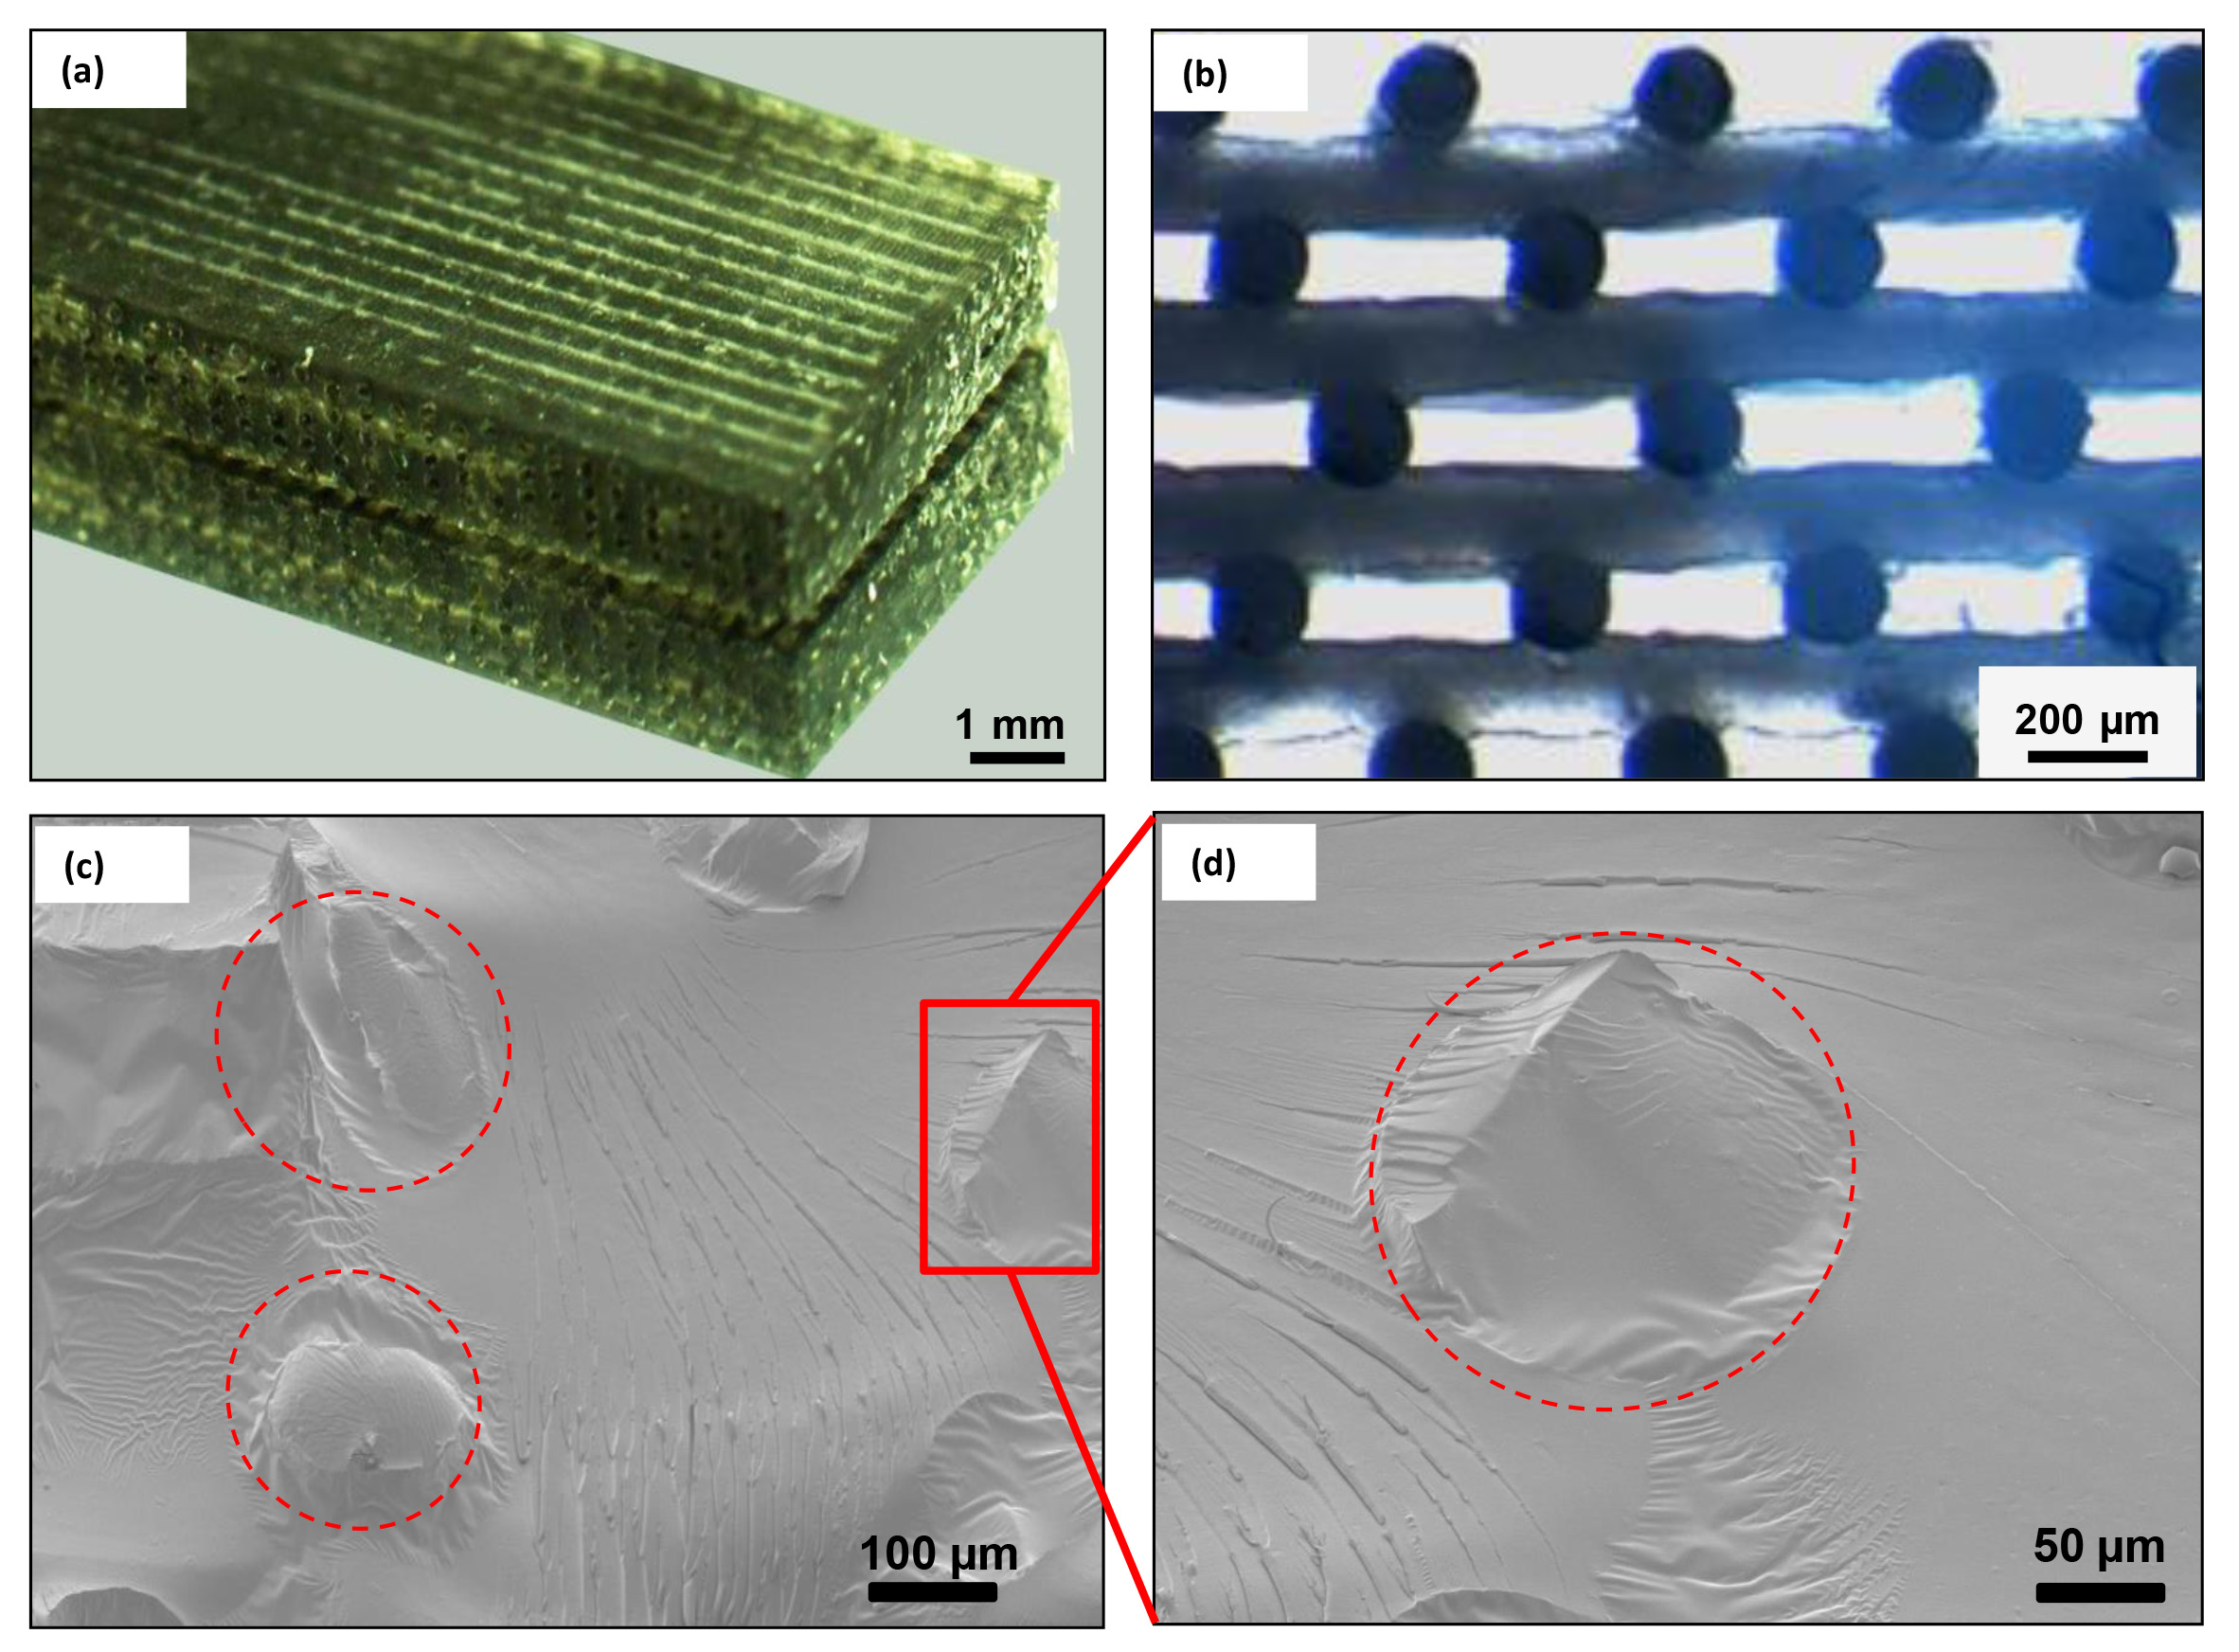
Figure 8. (a) Isometric image of a 3D-reinforced beam, (b) Typical cross-section of a nanocomposite-injected beam, (c) A beam surface fracture SEM image, and (d) A close-up view of (c). Click here to view larger image.
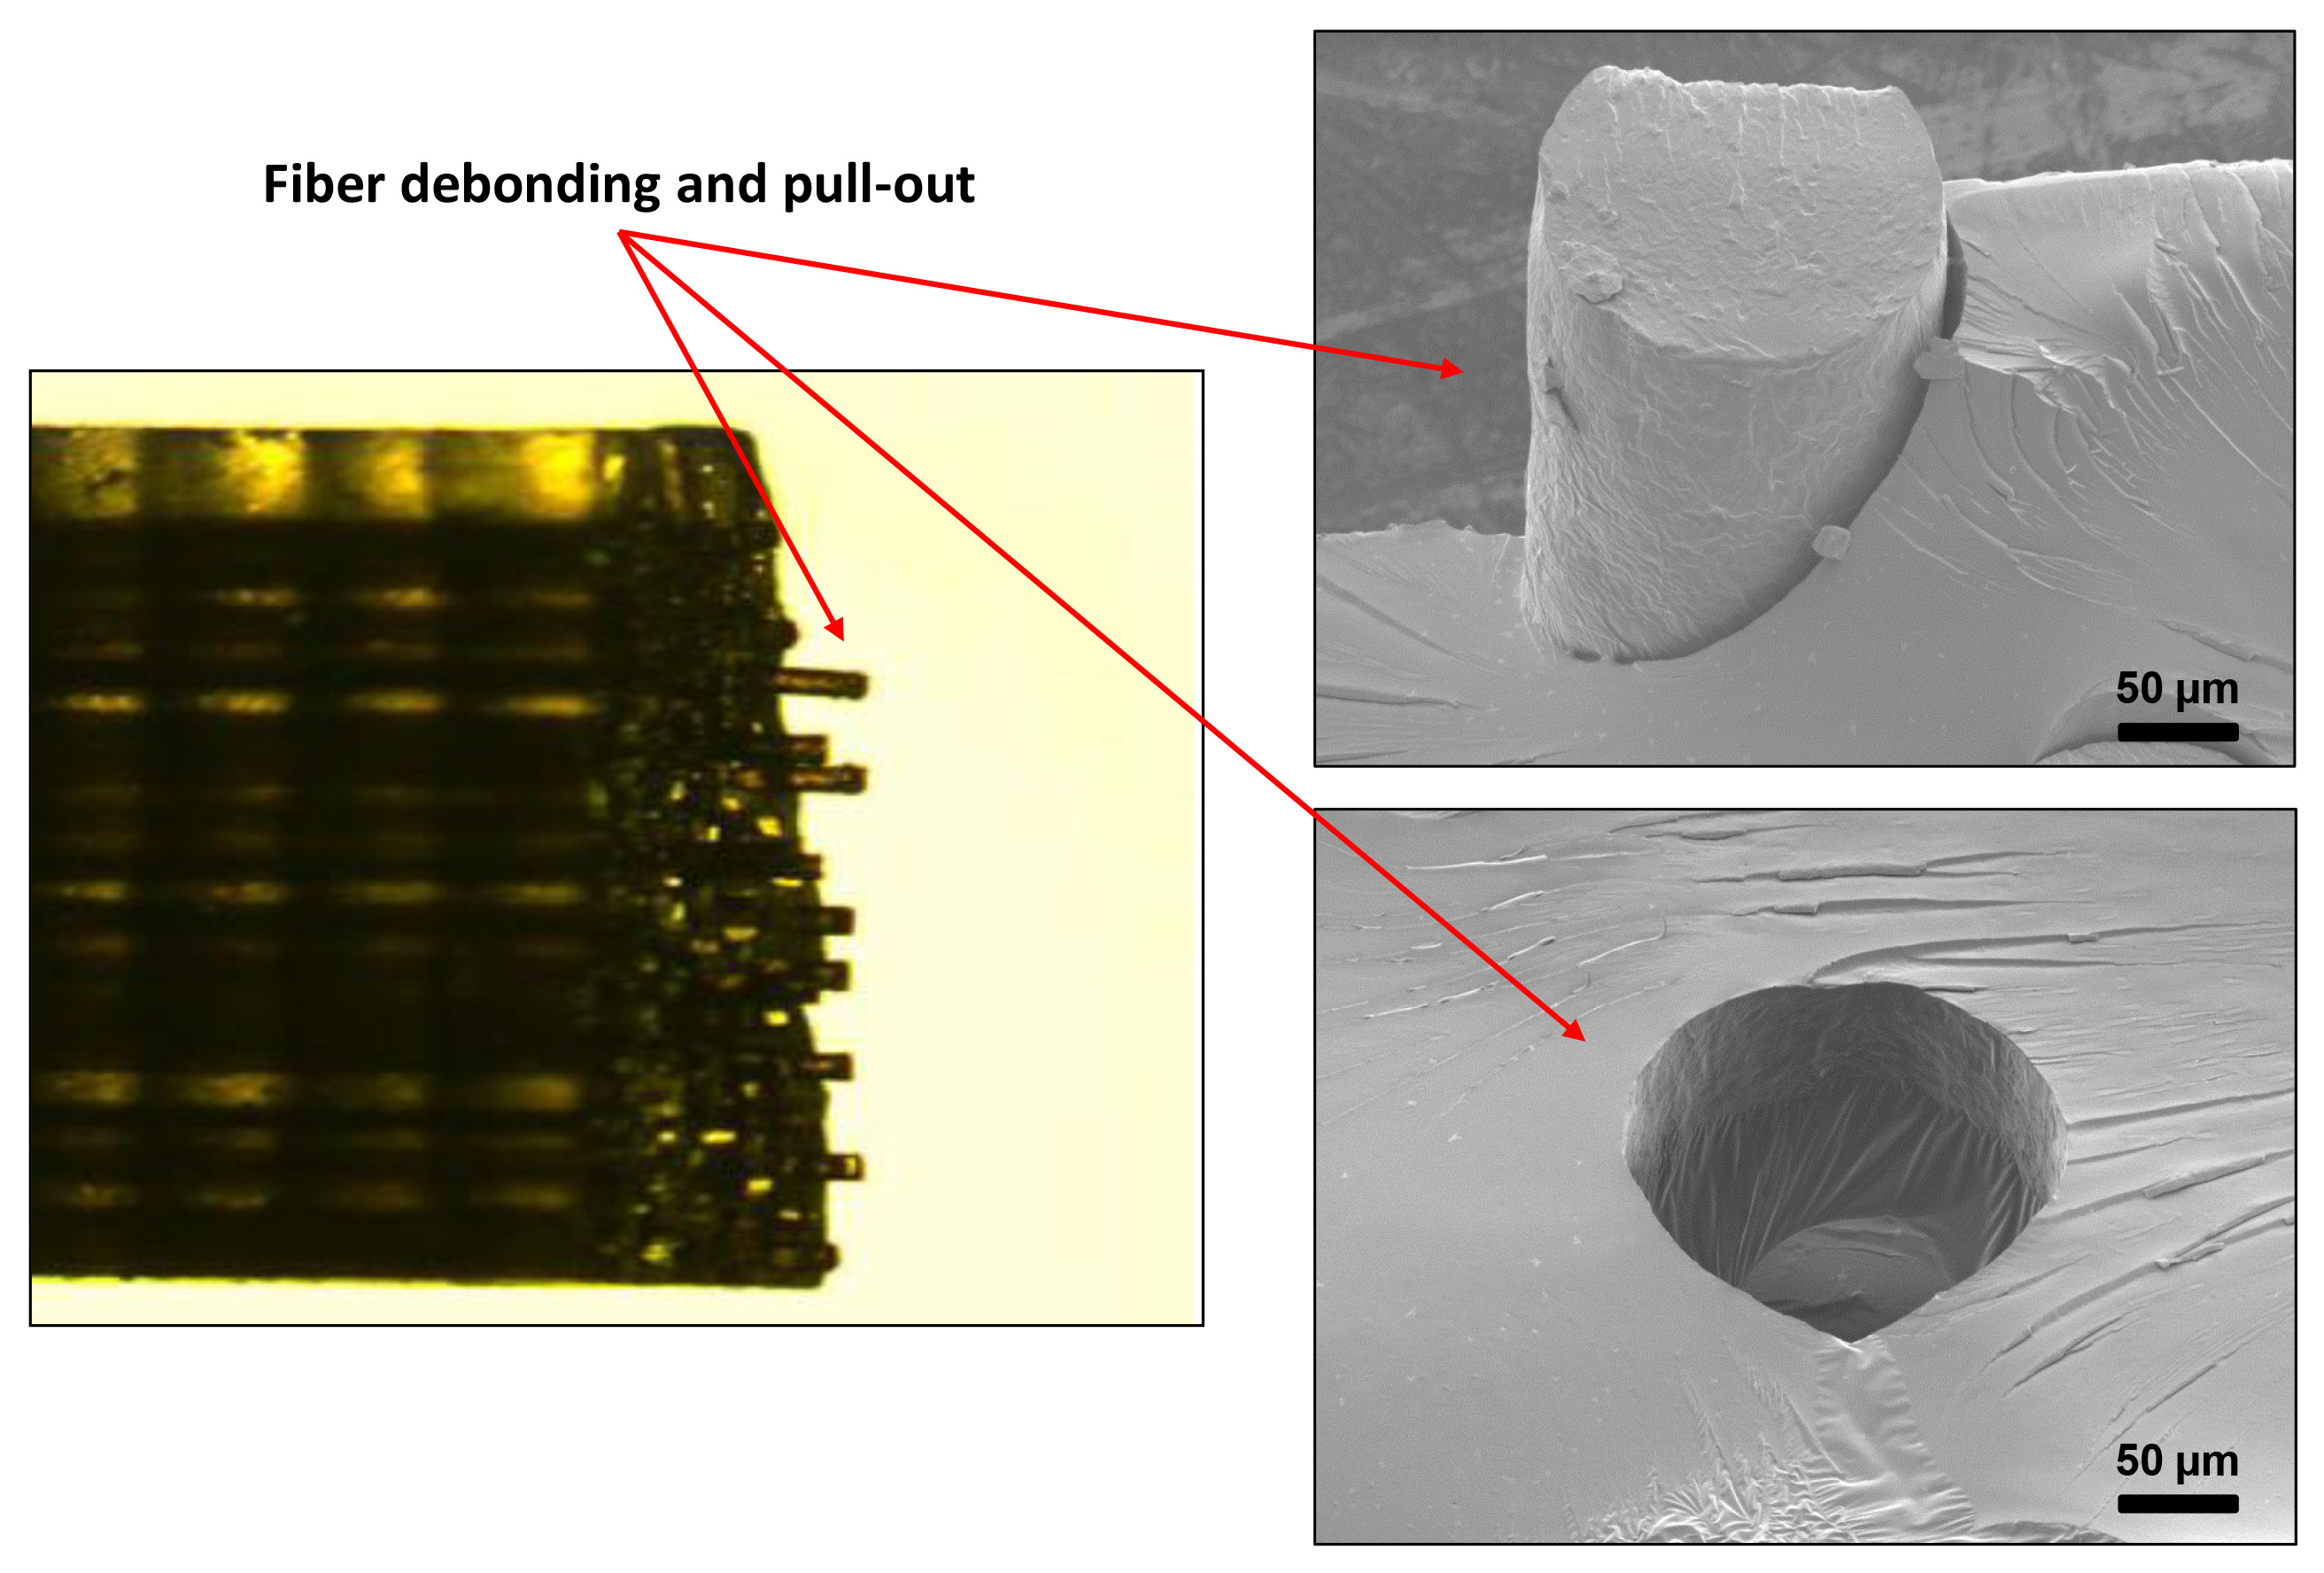
Figure 9. Fracture surface image of a polyurethane nanocomposite-infiltrated beam. Click here to view larger image.

Figure 10. Temperature-dependent mechanical properties (storage modulus) of the bulk epoxies and the manufactured beams using a dynamic mechanical analyzer. Click here to view larger image.
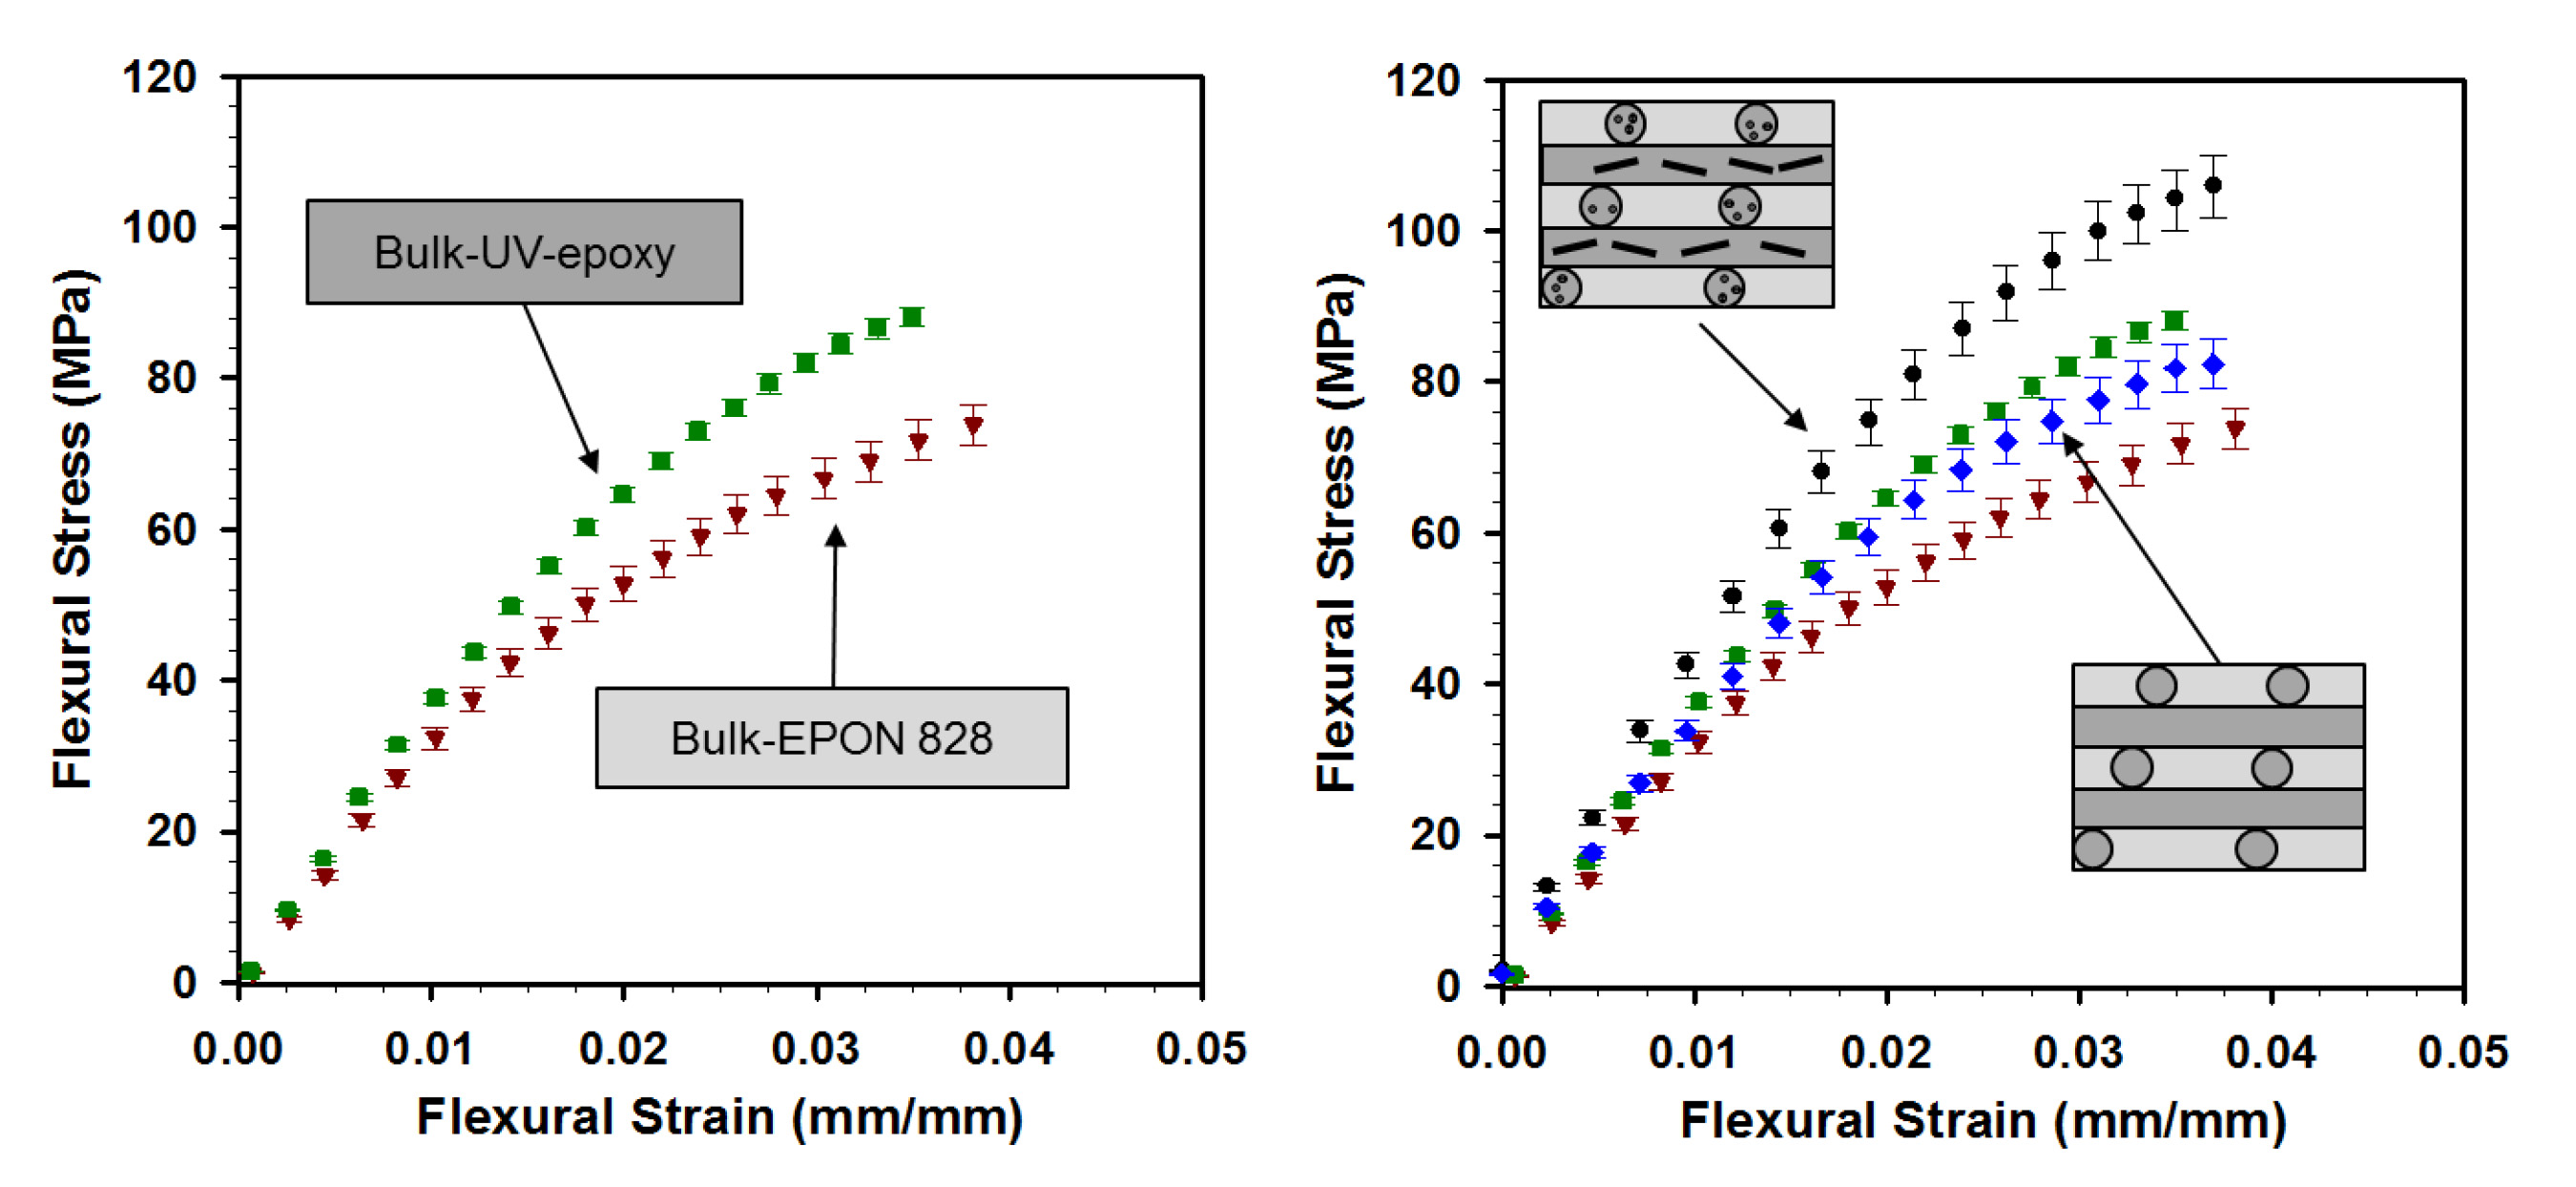
Figure 11. Quasi-static mechanical properties (flexural) of the bulk epoxies and the manufactured beams (three-point bending test). Click here to view larger image.
Discussion
The experimental procedure presented here is a new and flexible manufacturing method in order to tailor mechanical performance of polymer-based materials for material design purposes. Using this method, desired properties could be achieved based on the proper choice of components (i.e. infiltrated materials and main matrix) as well as engineering the composite structures. First, the technique enables the manufacture of a single material, composed of different thermosetting polymers, representing a unique temperature-dependent feature which is different than those of the components bulks15. Another advantage of the present technique over other nanocomposite fabrication techniques by which the nanofillers are uniformly distributed through whole matrix is the ability to spatially place the reinforcements at desired locations in these 3D-reinforced composite beams. Due to this positioning capability, a lower amount of possibly expensive nanofillers is needed to obtain a specific mechanical performance13. Since the reinforcement pattern obeys the original direct-writing of the ink scaffold, the filaments' spacing in a given layer is limited to approximately ten times the ink filaments diameter owing to the viscoelastic properties of the fugitive ink. On the other hand, a small spacing may limit flow of liquid epoxy during the epoxy encapsulation step. Moreover, the ink filament's diameter should be large enough (e.g. above 50 µm) for ease of fabrication (e.g. extrusion of high viscous ink) and subsequent manufacturing steps such as nanocomposite infiltration into the microfluidic networks.
Another potential of the present method might be the capability of aligning the individual CNTs or other nanofillers in the flow direction under shear flow16 by nanocomposite infiltration at higher speeds/pressures, if the nanofillers are well-dispersed in during the nanocomposite mixing process. However, a high degree of alignment could only be achieved at very high infiltration pressures (due to small channel diameter), which may cause air entrapment in the network during the infiltration.
Representative optical images in Figure 6 show the nanocomposites prepared by the mixing procedure presented in Protocol 2 (two images at the bottom of the figure). The observed dark spots are thought to be nanotube aggregates. For the ultrasonicated nanocomposite, the micron-size aggregates with a diameter of up to ~7 µm are present while a drastic change of the size of the aggregates (with an average of ~1 µm) is observed for the shear-mixed nanocomposite. Since the nanofiller dispersion affects the mechanical and electrical properties of the manufactured 3D nanocomposite beams, an improved dispersion should be achieved to take the full advantage of 3D positioning of nanofillers using the present manufacturing technique. Therefore, a further study is needed to systematically investigate the dispersion states of nanotubes and the use of other nanofillers, which can be more easily dispersed within the epoxy matrix.
The present manufacturing technique might enable the design of functional 3D nanocomposite products for microengineering application17. The technique is not limited to the materials used in this study. Therefore, the application of this technique could be extended by the utilization of other thermosetting materials and nanofillers. Among several applications, structural health monitoring, vibration absorption products and microelectronics can be mentioned.
Disclosures
No conflicts of interest declared.
Acknowledgements
The authors acknowledge financial support from FQRNT (Le Fonds Québécois de la Recherche sur la Nature et les Technologies). The authors would like to thank the consulting support of Prof. Martin Levesque, Prof. My Ali El Khakani and Dr. Brahim Aissa.
Materials
| Name | Company | Catalog Number | Comments |
|---|---|---|---|
| Dispensing Robot | I & J Fisnar | I & J2200-4 | |
| Robot software | I & J Fisnar | JR-Point Dispensing | |
| Syringe Barrel | Nordson EFD Inc. | 7012072 | 3 ml |
| Dispensing Nozzle | Nordson EFD Inc. | 7018225 | Stainless Steel Tip (ID: 0.51 mm) |
| Dispensing Nozzle | Nordson EFD Inc. | 7018424 | Stainless Steel Tip (ID: 0.15 mm) |
| Fluid Dispenser | Nordson EFD Inc. | HP-7X | |
| Fluid Dispenser | Nordson EFD Inc. | 800 | |
| Live camera | MediaCybernetics | QI, Cool, Color | 12 Bit, Qimaging |
| Live Camera Software | Image-Pro Plus | Version 6 | |
| Precision Saw | Buehler (IsoMet) | 622-ISF-03604 | Low-Speed Saw |
| Flexible plastic tube | Saint-Gobain PRL Corp. | Tygon 177936 | |
| Stirring hot plate | Barnstead International | SP131825 | |
| Vacuumed-oven | Cole-Parmer | EW-05053-10 | |
| Ultrasonic cleaner | Cole-Parmer | EW-08891-11 | |
| Three-roll mill mixer | Exakt Technologies | Exakt 80E | |
| Dynamic Mechanical Analyzer | TA Instruments | DMA Q800 | |
| UV-lamp | Cole Parmer | RK-97600-00 | Intensity of 21 mW/cm² |
References
- Endo, M., et al. Applications of Carbon Nanotubes in the Twenty-First Century. Philosoph. Trans. Math. Phys. Eng. Sci. 362 (1823), 2223-2238 (2004).
- Ear, Y., Silverman, E. Challenges and opportunities in multifunctional nanocomposite structures for aerospace applications. MRS Bull. 32 (4), 328-334 (2007).
- Mirfakhrai, T., Krishna-Prasad, R., Nojeh, A., Madden, J. D. W. Electromechanical actuation of single-walled carbon nanotubes: an ab initio simulation study. Nanotechnology. Nanotechnology. 19 (31), 1-8 (2008).
- Sahoo, N. G., Jung, Y. C., Yoo, H. J., Cho, J. W. Influence of carbon nanotubes and polypyrrole on the thermal, mechanical and electroactive shape-memory properties of polyurethane nanocomposites. Comp. Sci. Technol. 67 (9), 1920-1929 (2008).
- Coleman, J. N., Khan, U., Gun'ko, Y. K. Mechanical reinforcement of polymers using carbon nanotubes. Adv. Mater. 18 (6), 689-706 (2006).
- Fan, Z. H., Advani, S. G. Characterization of orientation state of carbon nanotubes in shear flow. Polymer. 46 (14), 5232-5240 (2005).
- Abbasi, S., Carreau, P. J., Derdouri, A. Flow-induced particle orientation and rheological properties of suspensions of organoclays in thermoplastic resins. Polymer. 51 (4), 922-935 (2010).
- Kimura, T., Ago, H., Tobita, M., Ohshima, S., Kyotani, M., Yumura, M. Polymer composites of carbon nanotubes aligned by a magnetic field. Adv. Mater. 14 (19), 1380-1383 (2002).
- Chronakis, I. S. Novel nanocomposites and nanoceramics based on polymer nanofibers using electrospinning process-A review. J. Mater. Process. Technol. 167 (2-3), 283-293 (2005).
- Zhou, W., et al. Single wall carbon nanotube fibers extruded from super-acid suspensions: preferred orientation, electrical, and thermal transport. J. Appl. Phys. 95 (2), 649-655 (2004).
- Sandler, J. K. W., et al. A comparative study of melt spun polyamide-12 fibres reinforced with carbon nanotubes and nanofibres. Polymer. 45 (6), 2001-2015 (2004).
- Therriault, D., Shepherd, R. F., White, S. R., Lewis, J. A. Fugitive inks for direct-write assembly of three-dimensional microvascular networks. Adv. Mater. 17 (4), 395-399 (2005).
- Therriault, D., White, S. R., Lewis, J. A. Chaotic mixing in three-dimensional microvascular networks fabricated by direct-write assembly. Nat. Mater. 2 (4), 265-271 (2003).
- Lebel, L. L., Aissa, B., Khakani, A. E., Therriault, D. Preparation and mechanical characterization of laser ablated single-walled carbon-nanotubes/polyurethane nanocomposite microbeams. Comp. Sci. Technol. 70 (3), 518-524 (2010).
- Farahani, R. D., Dalir, H., et al. Micro-infiltration of three-dimensional porous networks with carbon nanotube-based nanocomposite for material design. Comp. A. Appl. Sci. Manufact. 42 (12), 1910-1919 (2011).
- Farahani, R. D., et al. Manufacturing composite beams reinforced with three-dimensionally patterned-oriented carbon nanotubes through microfluidic infiltration. Mater. Design. 41 (5), 214-225 (2012).
- Volder, M. D., Tawfick, S. H., Copic, D., Hart, A. J. Hydrogel-driven carbon nanotube microtransducers. Soft Matter. 7 (21), 9844-9847 (2011).
Reprints and Permissions
