

Summary
Unmodified and hyperphosphorylated tau proteins were used in two in vitro aggregation assays to reveal the hyperphosphorylation-dependent fast aggregation kinetics. These assays pave the way for future screens for compounds that can modulate the propensity of hyperphosphorylated tau to form fibrils that underlie the progression of Alzheimer’s disease.
Abstract
Alzheimer's disease is one of a large group of neurodegenerative disorders known as tauopathies that are manifested by the neuronal deposits of hyperphosphorylated tau protein in the form of neurofibrillary tangles (NFTs). The density of NFT correlates well with cognitive impairment and other neurodegenerative symptoms, thus prompting the endeavor of developing tau aggregation-based therapeutics. Thus far, however, tau aggregation assays use recombinant or synthetic tau that is devoid of the pathology-related phosphorylation marks. Here we describe two assays using recombinant, hyperphosphorylated tau as the subject. These assays can be scaled up for high-throughput screens for compounds that can modulate the kinetics or stability of hyperphosphorylated tau aggregates. Novel therapeutics for Alzheimer's disease and other tauopathies can potentially be discovered using hyperphosphorylated tau isoforms.
Introduction
Alzheimer’s disease (AD) is one of a large collection of neurodegenerative disorders known as tauopathies. The quintessential pathology underlying tauopathy is the neurofibrillary tangles, NFTs, in neurons, astrocytes and microglia 1-4. The NFT density correlates with cognitive impairment 3,5 and neuron loss 6. NFT contains primarily hyperphosphorylated tau protein (referred to as “p-tau” henceforth) that forms straight or paired helical filaments (PHF) 7,8. Tau is a microtubule associated protein thought to facilitate axonal transport that is essential for neuronal signaling and trafficking 9,10. Each tau molecule contains 2 to 3 phosphates in normal brain, but the phosphoryl content increases by several folds in tauopathy patients 11. Multiple kinases are likely to contribute to tau hyperphosphorylation including GSK3β (glycogen synthase kinase 3β) and CDK5 (cyclin-dependent kinase 5) 12,13, but the direct trigger for the pathological phosphorylation remains elusive 14. Abnormal phosphorylation in or near the microtubule-binding motifs dissociates tau from the microtubule 15, and causes tau mis-localization to the somatodendritic compartment, where p-tau oligomerizes into straight or paired helical filaments that can eventually polymerize into NFT inclusions. The close tie between tau hyperphosphorylation, NFT formation, and neurodegeneration led to a prevalent hypothesis that p-tau tangles elicit apoptotic and other cytotoxic responses, and thus is the underlying cause for tauopathy neurodegeneration 16,17. Drug screens and early clinical tests based on this premise have been launched 18. However, this hypothesis faces challenges 19,20. For example, SantaCruz et al. showed that cognitive functions of transgenic mice can be improved by suppressing the expression of a mutant human tau, even though NFTs continued to form from existing tau molecules 21. In a Drosophila model, NFT was shown to sequester the toxic cytosolic tau to protect the underlying neuron cells 22,23. Clearly, the pathogenesis role of NFT, if any, will greatly impact the direction of tauopathy therapeutics development.
In high concentrations, recombinant or normal brain tau protein spontaneously but slowly polymerizes into a PHF-like structure in vitro, as indicated by the binding of several β-sheet preferred fluorescent dyes, electron microscopy, and light scattering spectroscopy 24-27. Adding heparin or arachidonic acid, an abundant fatty acid in human brain, drastically accelerates PHF formation in tau isoform- and inducer concentration-dependent manners 28-32. Intriguingly, hyperphosphorylated tau purified from AD brains or prepared by exhaustive in vitro phosphorylation reactions aggregates faster and more efficiently 26,33-35. These results are in excellent agreement with the pathological roles of p-tau. An in vitro system based on the aggregation of p-tau may thus serve as a powerful tool for AD drug screening.
Given the close association between tau aggregation and the progressive neurodegeneration of AD, as well as the recent failure in drug development targeting the Aβ plaque, another key histological marker of AD 36-38, the interest in discovering drugs that control tau aggregation is rising. Indeed, several groups have already begun drug screens at different throughput, using in vitro tau aggregation reactions as the primary assay. A number of chemicals were found to exhibit inhibitory or reversal activities on tau aggregation in vitro 39-42. However, all current tau aggregation regulator screens use unmodified tau that misses the key pathological mark of phosphorylation, raising a concern for the specificity and efficacy of using these compounds in AD treatment.
One of the major hurdles of developing aggregation assays for biochemical characterization and AD drug screening is the production of sufficient quantities of the pathophysiologically relevant hyperphosphorylated tau protein. Using the Zippers-Assisted Catalysis system in which the 1N4R isoform of tau and the GSK-3β kinase are co-expressed in E. coli as leucine zipper fusion proteins, we have overcome this challenge (Sui et al., submitted; see Figure 1 for the final products of tau and p-tau; also see 43 for preliminary mass spectrometry characterization of p-tau). From a panel of nine antibodies specific for different phosphorylation sites of tau, positive signals were seen in eight positions (data not shown). Below, we describe protocols and instrumentations that can differentiate the aggregation kinetic differences between unmodified tau and p-tau species. These assays were modified from published protocols that measured the increase of fluorescence of thioflavin T (ThT) or thioflavin S (ThS) upon amyloid (tau aggregates) binding 26. In the first “terminal”, no-dye approach, aggregation reactions are assembled and incubated in the absence of the amyloid dye. At different time points, an aliquot of each reaction is removed and mixed with equal volume of the ThT-containing buffer to stop aggregation and allow ThT to bind tau aggregates. Fluorescence is measured by an IAP FluoroMax-2 fluorometer. In the second “with-dye” continual monitoring assay, ThT or ThS is included in the aggregation reactions. Fluorescence can be measured continuously throughout the entire experiment manually or using a multi-plate reader. In addition, we describe an assay that uses a near-physiological concentration of tau and p-tau for aggregation in the continual measurement mode. The effect of phosphorylation remains readily detectable. Below, we will describe step-by-step operation procedures, and show representative results of these assays. Discussion of some of the pros and cons of each approach, as well as potential drug screening applications will follow.
At a high concentration, tau aggregates into amyloid-like structures spontaneously. However, in the laboratory, tau fibrillization is typically accelerated by such inducers as heparin (average molecular weight, 6,000 g/mol) and arachidonic acid. Examples shown herein include 30 µM heparin. The formation of tau amyloid aggregates is monitored by the fluorescence resulting from amyloid binding by thioflavin T (ThT) or thioflavin S (ThS). Upon binding to tau aggregates, ThT exhibits a red shift in fluorescence (excitation: 450 nm; peak emission: 485 nm). ThS, on the other hand, has weak emission at 510 nm (excitation at 450 nm) before amyloid binding, but this fluorescence increases significantly in the presence of an amyloid protein such as the aggregated tau 44. Both dyes work well in detecting tau and p-tau aggregation. Because of the strong and relatively broad emission peak of ThT (see Figure 2), there is only 30% reduction in the fluorescence unit at 510 nm. For convenience, we use the same combination of excitation/emission wavelengths (i.e., 450 nm/510 nm) to monitor tau aggregation when using either dye.
Tau aggregation can be done in the presence or absence of the dye, depending on the purpose of the assay and the availability of tau protein. Both modes of reactions are shown below. In addition, we demonstrate the operation of two different instruments – a single-sample fluorometer (ISA-SPEX FluoroMax-2) and a multi-plate reader (SpectraMax M2). Readers should be able to adapt these protocols to suit their specific needs and instrument availability.
Subscription Required. Please recommend JoVE to your librarian.
Protocol
1. Preparation of Reagents
- Prepare aggregation buffer (20 mM Tris, pH 7.4, 100 mM NaCl, 1 mM EDTA). Store at RT, stable for months. Supplement 1 mM dithiothreitol (DTT) before use.
NOTE: a HEPES-based buffer (10 mM HEPES, pH 7.5, 0.1 mM EDTA, 5 mM DTT) also produces similar results in tau aggregation. - Prepare thioflavin T or thioflavin S stock solution (3 mM, dissolved in aggregation buffer), and filter by 0.22 μm sterile filter unit. Store at –20 °C in a tube covered by aluminum foil, stable for months.
- Prepare heparin stock solution (300 μM, dissolved in aggregation buffer). Store at –20 °C, stable for months.
- Prepare dithiothreitol (DTT) stock (1 M, dissolved in water). Aliquot into 1.5 ml tubes. Store at –20 °C. Before aggregation assays, thaw the 1 M solution at RT. From this 1,000x stock, prepare an aliquot of 100 mM working stock with deionized water. Leave on ice until ready.
- Remove tau from –80 °C freezer. Thaw on ice. Adjust tau to predetermined concentration with the aggregation buffer. Spin in a microcentrifuge at 20,800 x g for 10 min at 4 °C to remove pre-formed large aggregates. This pre-spinning step increases consistency in the subsequent fluorescence measurement of each batch of the protein prep. Transfer the supernatant to another tube; leave on ice until ready to assemble the aggregation reaction.
2. No-dye, Terminal Assay
NOTE: The aggregation reaction of this assay is done in the absence of the fluorescent dye. After mixing all components, the reaction is allowed to proceed to pre-determined time points. Aliquots are then taken out of the aggregation reaction and mixed with ThT or ThS for amyloid binding before fluorescence reading. The initial volume of the aggregation reaction depends on the number of time points needed. This approach may require a large amount of tau protein, but is fast, straightforward, and can be done in a fluorometer or a multi-well plate reader (see Discussion). Below is the step-by-step operation, using the ISA SPEX FluoroMax-2 compact spectrofluorometer for fluorescence quantification.
- Set up the aggregation mixture in 1.5 ml Eppendorf tubes as in Table 1. Each column represents the ingredients needed for a 100 μl reaction, which is enough for one time-point measurement. Adjust the amount for the entire aggregation mix based on the time points needed for the particular experiment. Add additional 10% of each component to give room for pipetting error. The typical reaction containing heparin shown here can be replaced by arachidonic acid or aggregation buffer. Add DTT to 1 mM to the reaction mixture. If the entire reaction lasts more than one day, supplement fresh DTT everyday (1 mM) to ensure a reducing environment.
- Invert the tube a few times to mix. Place each reaction in a 37 °C incubator or water bath. Agitation is not needed for tau aggregation.
- Before measuring the fluorescence, turn on the spectrofluorometer (lamp first, then computer).
NOTE: The xenon arc lamp that can be used right away. However, for best results allow the machine to warm up for about 10 min before reading fluorescence. - Start the software on the computer.
- Choose Real Time Display mode in Instrument Control Center, set excitation wavelength to 450 nm (slit to 2 nm) and emission wavelength to 510 nm (slit to 5 nm). Close Real Time Display mode window to return to the Instrument Control Center.
- Choose Constant Wavelength Analysis, press Add>> key in the upper frame to add wavelengths sets. Set acquisition parameters of Standard Error to 1 and Maximum Trials to 3, then click Add. Click Go! to open the Data Display window.
- In the Data Display window, click Start Acq to open the New Sample dialog box. Choose “unknown” for sample type.
- To every 100 μl aggregation mixture, add 98 µl aggregation buffer and 2 µl 3 mM thioflavin T. Pipet several times to mix.
- Transfer the entire mixture to a cuvette (FCA3, exterior dimension, w x l x h = 12.5 mm x 12.5 mm x 45 mm). Place the cuvette in the sample holder in the sample-compartment and close the lid. Click Run to collect the fluorescence data. Record the data.
- Remove the cuvette and decant the solution. Rinse the cuvette by distilled water 3 times. Dry by blowing air in and outside the cuvette.
3. With-dye, Continual Mode Assay on a SpectraMax M2 Plate Reader
NOTE: This assay differs from the previous one in that the fluorescent dye ThT or ThS is included in the aggregation reaction. This allows continuous measurement of the same set of reactions. Because of the repetitive use of the reaction, this method is better done with an automatic multi-well plate reader (as shown below the operation of SpectraMax M2). A regular fluorometer also works but the frequency of measurement of fast aggregation reactions is somewhat limited, due to the manual nature of the operation.
- Set up the aggregation mix in a 96-well plate (96-well black solid plate, well-volume 360 μl, flat bottom) as in Table 2. Each column represents the ingredients needed for a 200 μl reaction, which is enough for one time-point measurement. Mix well by pipetting several times. Supplement fresh 1mM DTT every day throughout the course of experiments.
- Incubate the 96-well plate at 37 °C.
- At each time point before fluorescence measurement, turn on the multi-mode microplate reader and the computer. Allow sufficient time for the machine to stabilize, about 10 min.
- Start the software on the computer. Set temperature to 37 °C and choose Fluorescence Intensity (FI-Top Read) mode, set excitation wavelength at 450 nm and emission wavelength at 510 nm.
- Insert the 96-well plate into the drawer and press the READ key to start measurement.
- After reading, remove the plate and return it back to the 37 °C incubator. Copy the data and paste into an Excel spreadsheet for data analysis and plotting.
4. With-dye, Continual Mode Assay on an Compact Spectrofluorometer
- Set up the aggregation mixture in 1.5 ml Eppendorf tubes as in Table 3. Each column represents the ingredients needed for a 200 μl reaction, which is enough for one time-point measurement.
- Invert the tube a few times to mix.
- Turn on the spectrofluorometer and set the software as in steps 2.3 and 2.4.
- Transfer the entire mixture to a cuvette. Place the cuvette in the sample holder in the sample-compartment and close the lid. Click Run to collect the fluorescence data. Record the data.
- Continue reading at appropriate intervals by clicking Run and recording the data. If the aggregation is to be monitored at a high frequency (e.g., every 30 or 60 sec), leave the reaction in the cuvette and in the machine until either the measurement is finished, or when there is sufficient time to swap reactions or cuvettes.
- Remove the cuvette and decant the solution. Rinse the cuvette by distilled water 3 times. Dry by blowing air in and outside the cuvette.
Subscription Required. Please recommend JoVE to your librarian.
Representative Results
Using recombinant tau and p-tau (Figure 1), we established two different protocols to compare the kinetics of aggregation of tau and p-tau, taking advantage of the strong fluorescence emission of ThT and ThS upon binding to amyloidal protein aggregates, including tau and p-tau (Figure 2). With or without the fluorescent dye in the aggregation reaction, we observed consistent enhancement of tau aggregation by hyperphosphorylation (Figures 3–5). This stimulation is independent of heparin (data not shown). In a typical reaction, tau and p-tau oligomerize at fast rates within the first 30 min before slowing down significantly (Figures 3 and 5), with p-tau exhibiting higher fluorescence units throughout the course of the experiment. Including ThT in the aggregation reactions causes significant retardation in the rate of aggregation (Figure 4). Both isoforms approached plateau 160 hr after the reactions had started. ThS, on the other hand, does not cause appreciable slowdown of aggregation (Figure 5).

Figure 1. Purified tau and hyperphosphorylated tau (p-tau) used in this study. Samples were resolved by a 10% SDS-PAGE gel, and stained by Coomassie blue R250 (left) or probed by an anti-tau monoclonal antibody (right panel). Lane M, molecular weight marker; lanes 1 and 3, unphosphorylated tau; lane2 and 4, hyperphosphorylated tau.

Figure 2. Emission spectra for ThT (30 µM) with or without binding tau aggregates. Emission acquisition was scanned from 460 nm to 600 nm (1 nm increment; 0.1 sec integration, 5 nm slit width), excitation at 450 nm. Tau aggregates were obtained by allowing 50 µM tau aggregation to proceed at 37 °C O/N (see Protocol 2 for details).
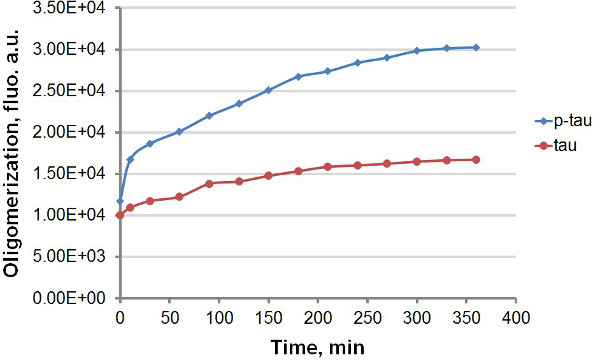
Figure 3. Aggregation curves for tau and p-tau in terminal assay. Aggregation of 50 μM tau and p-tau was completed with 30 μM heparin as the inducer. At different times after the start of the reaction, 100 µl of the reaction was removed and mixed with same volume of 60 µM ThT before fluorescence measurement. Fluorescence was measured at 450 nm excitation, 510 nm emission. “a.u.”, arbitrary units. Note that the time scale is in minutes.
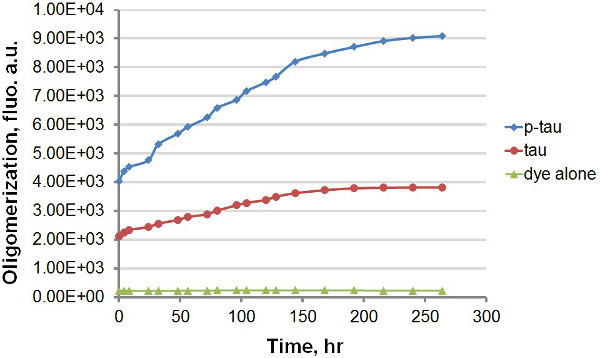
Figure 4. Aggregation curves for ThT alone, tau and p-tau in the continual measurement mode in the presence of ThT. Each reaction consisted of 0 or 50 μM tau or p-tau, 30 μM heparin, and 30 μM ThT in aggregation buffer. Reactions were incubated at 37 °C in a 96-well plate. At different time points, the plate was removed from the incubator and loaded to the plate reader for fluorescence reading (excitation 450 nm, emission 510 nm). Between readings, the plate was kept in the incubator without agitation under a cover. The presence of ThT significantly slowed down aggregation, but, importantly, the hyperphosphorylated tau still exhibited a faster rate of aggregation than did its unmodified counterpart. Note that the scale of time is in hours.
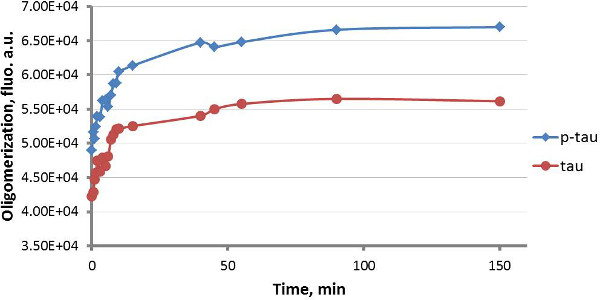
Figure 5. Small-scale tau aggregation assays in the presence of ThS. In vitro heparin-induced aggregation of 6 µM tau and p-tau was assessed in the continual measurement mode with thioflavin S as the indicator dye. In addition to the protein, each reaction contained 30 µM heparin and 20 µM ThS in the HEPES aggregation buffer (10 mM HEPES pH 7.5, 5 mM DTT, 0.1 mM EDTA). All ingredients except heparin were mixed and equilibrated at RT. After adding heparin, the reaction was transferred to the cuvette and placed in the sample holder. Fluorescence was recorded immediately as T0, and continued for about 2 hr or until the fluorescence increase slowed down to near zero. Because of the relatively short reaction period, the entire reaction was carried out at RT in the same cuvette.
| tau | p-tau | |
| 60 - 100 μM tau | 50 µl | 0 µl |
| 60 - 100 μM p-tau | 0 µl | 50 µl |
| 300 μM heparin | 10 μl | 10 μl |
| aggregation buffer | 39 μl | 39 μl |
| 100 mM DTT | 1 μl | 1 μl |
Table 1. Aggregation mixture components for no-dye, terminal assay.
| tau | p-tau | Dye alone | |
| 60 - 100 μM tau | 50 μl | 0 µl | 0 µl |
| 60 - 100 μM p-tau | 0 µl | 50 μl | 0 µl |
| 300 μM heparin | 20 µl | 20 μl | 20 µl |
| 3 mM thioflavin T | 2 µl | 2 μl | 2 µl |
| Aggregation buffer | 126 µl | 126 μl | 176 µl |
| 100 mM DTT | 2 µl | 2 µl | 2 µl |
Table 2. Aggregation mixture components for with-dye, continual assay on a plate reader.
| tau | p-tau | Dye alone | |
| 60 - 100 μM tau | 5 μl | 0 µl | 0 µl |
| 60 - 100 μM p-tau | 0 µl | 5 μl | 0 µl |
| 300 μM heparin | 20 µl | 20 μl | 20 µl |
| 3 mM thioflavin S | 1.5 µl | 1.5 μl | 1.5 µl |
| Aggregation buffer | 171.5 µl | 171.5 μl | 176.5 µl |
| 100 mM DTT | 2 µl | 2 µl | 2 µl |
Table 3. Aggregation mixture components for with-dye, continual assay on a compact spectrofluorometer.
Subscription Required. Please recommend JoVE to your librarian.
Discussion
This protocol demonstrates different assay conditions and instruments that detect the phosphorylation-dependent fast tau aggregation kinetics. In the terminal assay, the fluorescence dye ThT is added to a portion of the reaction removed from the master mix at each time point. Amyloid binding-induced fluorescence is then measured 26. In the second, with-dye mode, tau aggregation is carried out in the presence of ThT or ThS, rendering this type of reaction suitable for real-time automatic assessment of the growth of tau aggregates. Each of these methods has its pros and cons.
The terminal-mode reaction is conducted with only those ingredients needed for tau aggregation. Diluting and mixing the reaction with thioflavin T drastically slows down the rate of fluorescence increase, essentially stops the reaction for fluorescence quantification. This method thus is also compatible with manual operation. However, because the reaction is practically terminated upon ThT addition, a large amount of tau may be required for plotting an aggregation curve. Another potential caveat for this method is that frequent access to the reaction mixture may introduce microbial or proteolytic contamination, or protein oxidation. In contrast, the with-dye mode allows the generation of amyloid in the presence of ThT or ThS. The advancement of aggregation can be monitored continuously without ever disturbing the reaction. This feature is particularly attractive when establishing an automated assay platform. However, different dyes may elicit specific responses. Indeed, ThT retards tau and p-tau aggregation significantly, but ThS has little effects (compare Figures 3 and 5). There are several other fluorescence dyes, including Congo red and thiazines, which have been used in histological and cell biology studies for PHF formation. At least one report stated that some of these dyes may induce tau aggregation in tissue culture cells 45. Therefore, when choosing these compounds for amyloidogenesis kinetics studies, caution shall be practiced and that different dyes may have to be compared.
With respect to the choice of instrument, the single-sample fluorometer used in the first approach is highly reliable, but the operation may be laborious when more than a few reactions are to be compared. Using multiple cuvettes can help avoid cross-contamination between reactions, although the cost of these fragile quartz cuvettes may be prohibitive to some. Conversely, the multi-well microplate reader can examine multiple reactions at the same time. The use of disposable 96-well plates is advantageous as well. With a heating element, a microplate reader can be a dedicated device for monitoring multiple reactions at 37 °C for an extended period of time. However, evaporation might be a concern. DiNitto et al. overlaid a similar reaction with mineral oil to prevent evaporation46.
Some precautions are to be taken for the above protocols to ensure consistent and quantitative results. Firstly, tau and p-tau spontaneously form amyloid aggregates over time, particularly when in a high concentration. It is thus imperative to freeze all the aliquots of protein preps, and thaw only the needed volume before the experiments. Even so, some aggregates, including the granular intermediates detectable by ThT 47 might have formed during the preparation of recombinant proteins. A substantial initial fluorescence reading of a typical aggregation reaction is thus common. Nonetheless, adding a pre-spinning step and transferring the supernatant to a separate tube, even without a visible protein pellet, can reduce, and maintain consistent, initial fluorescence of the same batch of tau and p-tau prep. Secondly, the working stock solution of ThT (i.e., 60 µM) is stable at RT for less than a week before the fluorescence diminishes. It is thus advised to re-make the 60 µM ThT every several days.
One prominent reason underlying studies of p-tau aggregation is the development of novel AD diagnostics and therapeutics. Compounds that inhibit or revert recombinant tau aggregation have been identified from high-throughput screens and targeted tests 18,40,41,48. Efficacy of these compounds for p-tau aggregation remains to be elucidated. These screens were carried out in the terminal mode by dispensing a common aggregation mix without the dye to individual multiplate wells with different compounds. Typically after O/N incubation, ThT or ThS is added for fluorescence measurement, revealing the inhibitory power of many compounds. The with-dye approach mentioned above and by Rankin et al.49 has yet to be incorporated to high-throughput screens. Now with hyperphosphorylated tau available for kinetic and pharmaceutical studies of paired helical filament formation, Alzheimer’s disease drug discovery is likely to advance farther.
Finally, it is worth noting that the study of p-tau aggregation is of critical importance to not only tauopathies, but can also impact an even wider population. For example, there are reports that the neurofibrillary tangles are detectable in some patients of chronic traumatic encephalopathy, such as professional American football players and boxers 50-52. Similar correlation has also been reported for single or repetitive traumatic brain injury patients including soldiers 53. Protocols described in this work may thus help the discovery and development of new therapeutics targeting p-tau aggregates in neuronal cells.
Subscription Required. Please recommend JoVE to your librarian.
Disclosures
We have nothing to disclose.
Acknowledgments
This work was supported by the National Institute on Aging (AG039768) to MHK. We thank Drs. Thomas Sharkey and Honggao Yan for generously providing the instruments, as well Sean Weise and Yan Wu for technical assistance.
Materials
| Name | Company | Catalog Number | Comments |
| Trizma base | Sigma | T1503 | |
| NaCl | Macron Fine Chemicals | MAL-7581-06 | |
| Ethylenediaminetetraacetic Acid (EDTA) | Invitrogen | 15576-028 | |
| Thioflavin T | Sigma | T3516 | Stored in dark |
| Thioflavin S | Sigma | T1892 | Stored in dark |
| heparin | Sigma | H3393 | |
| DL-Dithiothreitol (DTT) | Sigma | D9779 | Stored at 4 °C |
| 96-well plate | Corning | 3917 | |
| ISA SPEX FluoroMax-2 | Horiba | ||
| SpectraMax M2 Multi-Mode Microlate Reader | Molecular Devices | ||
| Mouse Anti-Tau Monoclonal Antibody | R&D Systems | MAB3494 | Stored at –80 °C |
References
- Lee, V. M., Goedert, M., Trojanowski, J. Q. Neurodegenerative tauopathies. Annu Rev Neurosci. 24, 1121-1159 (2001).
- Ballatore, C., Lee, V. M., Trojanowski, J. Q. Tau-mediated neurodegeneration in Alzheimer's disease and related disorders. Nat Rev Neurosci. 8 (9), 663-672 (2007).
- Arriagada, P. V., Marzloff, K., Hyman, B. T. Distribution of Alzheimer-type pathologic changes in nondemented elderly individuals matches the pattern in Alzheimer's disease. Neurology. 42 (9), 1681-1688 (1992).
- Arriagada, P. V., Growdon, J. H., Hedley-Whyte, E. T., Hyman, B. T. Neurofibrillary tangles but not senile plaques parallel duration and severity of Alzheimer's disease. Neurology. 42 (3 Pt 1), 631-639 (1992).
- Bancher, C., Braak, H., Fischer, P., Jellinger, K. A. Neuropathological staging of Alzheimer lesions and intellectual status in Alzheimer's and Parkinson's disease patients. Neurosci Lett. 162 (1-2), 179-182 (1993).
- Guillozet, A. L., Weintraub, S., Mash, D. C., Mesulam, M. M. Neurofibrillary tangles, amyloid, and memory in aging and mild cognitive impairment. Arch Neurol. 60 (5), 729-736 (2003).
- Hasegawa, M., et al. Protein sequence and mass spectrometric analyses of tau in the Alzheimer's disease brain. J Biol Chem. 267 (24), 17047-17054 (1992).
- Matsuo, E. S., et al. Biopsy-derived adult human brain tau is phosphorylated at many of the same sites as Alzheimer's disease paired helical filament tau. Neuron. 13 (4), 989-1002 (1994).
- Bamburg, J. R., Bloom, G. S. Cytoskeletal pathologies of Alzheimer disease. Cell Motil Cytoskeleton. 66 (8), 635-649 (2009).
- Denk, F., Wade-Martins, R. Knock-out and transgenic mouse models of tauopathies. Neurobiol Aging. 30 (1), 1-13 (2009).
- Gong, C. X., Iqbal, K. Hyperphosphorylation of microtubule-associated protein tau: a promising therapeutic target for Alzheimer disease. Curr Med Chem. 15 (23), 2321-2328 (2008).
- Mazanetz, M. P., Fischer, P. M. Untangling tau hyperphosphorylation in drug design for neurodegenerative diseases. Nat Rev Drug Discov. 6 (6), 464-479 (2007).
- Brunden, K. R., Trojanowski, J. Q., Lee, V. M. Advances in tau-focused drug discovery for Alzheimer's disease and related tauopathies. Nat Rev Drug Discov. 8 (10), 783-793 (2009).
- Querfurth, H. W., LaFerla, F. M. Alzheimer's disease. N Engl J Med. 362 (4), 329-344 (2010).
- Buee, L., Bussiere, T., Buee-Scherrer, V., Delacourte, A., Hof, P. R. Tau protein isoforms, phosphorylation and role in neurodegenerative disorders. Brain Res Brain Res Rev. 33 (1), 95-130 (2000).
- Lee, V. M., Brunden, K. R., Hutton, M., Trojanowski, J. Q. Developing therapeutic approaches to tau, selected kinases, and related neuronal protein targets. Cold Spring Harb Perspect Med. 1 (1), 006437 (2011).
- Mandelkow, E. M., Mandelkow, E. Biochemistry and cell biology of tau protein in neurofibrillary degeneration. Cold Spring Harb Perspect Med. 2 (7), a006247 (2012).
- Bulic, B., Pickhardt, M., Mandelkow, E. Progress and Developments in Tau Aggregation Inhibitors for Alzheimer Disease. J Med Chem. 56 (11), 4135-4155 (2013).
- Cowan, C. M., Quraishe, S., Mudher, A. What is the pathological significance of tau oligomers. Biochem Soc Trans. 40 (4), 693-697 (2012).
- Spires-Jones, T. L., Kopeikina, K. J., Koffie, R. M., de Calignon, A., Hyman, B. T. Are tangles as toxic as they look. J Mol Neurosci. 45 (3), 438-444 (2011).
- SantaCruz, K., et al. Tau suppression in a neurodegenerative mouse model improves memory function. Science. 309 (5733), 476-481 (2005).
- Wittmann, C. W., et al. Tauopathy in Drosophila: neurodegeneration without neurofibrillary tangles. Science. 293 (5530), 711-714 (2001).
- Shulman, J. M., Feany, M. B. Genetic modifiers of tauopathy in Drosophila. Genetics. 165 (3), 1233-1242 (2003).
- Wille, H., Drewes, G., Biernat, J., Mandelkow, E. M., Mandelkow, E. Alzheimer-like paired helical filaments and antiparallel dimers formed from microtubule-associated protein tau in vitro. J Cell Biol. 118 (3), 573-584 (1992).
- Alonso, A., Zaidi, T., Novak, M., Grundke-Iqbal, I., Iqbal, K. Hyperphosphorylation induces self-assembly of tau into tangles of paired helical filaments/straight filaments. Proc Natl Acad Sci U S A. 98 (12), 6923-6928 (2001).
- Barghorn, S., Biernat, J., Mandelkow, E. Purification of recombinant tau protein and preparation of Alzheimer-paired helical filaments in vitro. Methods Mol Biol. 299, 35-51 (2005).
- Wilson, D. M., Binder, L. I. Polymerization of microtubule-associated protein tau under near-physiological conditions. J Biol Chem. 270 (41), 24306-24314 (1995).
- Wilson, D. M., Binder, L. I. Free fatty acids stimulate the polymerization of tau and amyloid beta peptides. In vitro evidence for a common effector of pathogenesis in Alzheimer's disease. Am J Pathol. 150 (6), 2181-2195 (1997).
- Perez, M., Valpuesta, J. M., Medina, M., Montejo de Garcini, E., Avila, J. Polymerization of tau into filaments in the presence of heparin: the minimal sequence required for tau-tau interaction. J Neurochem. 67 (3), 1183-1190 (1996).
- Carlson, S. W., et al. A complex mechanism for inducer mediated tau polymerization. Biochemistry. 46 (30), 8838-8849 (2007).
- Goedert, M., et al. Assembly of microtubule-associated protein tau into Alzheimer-like filaments induced by sulphated glycosaminoglycans. Nature. 383 (6600), 550-553 (1996).
- King, M. E., Gamblin, T. C., Kuret, J., Binder, L. I. Differential assembly of human tau isoforms in the presence of arachidonic acid. J Neurochem. 74 (4), 1749-1757 (2000).
- Rankin, C. A., Sun, Q., Gamblin, T. C. Pseudo-phosphorylation of tau at Ser202 and Thr205 affects tau filament formation. Brain Res Mol Brain Res. 138 (1), 84-93 (2005).
- Rankin, C. A., Sun, Q., Gamblin, T. C. Pre-assembled tau filaments phosphorylated by GSK-3b form large tangle-like structures. Neurobiol Dis. 31 (3), 368-377 (2008).
- Grundke-Iqbal, I., et al. Abnormal phosphorylation of the microtubule-associated protein tau (tau) in Alzheimer cytoskeletal pathology. Proc Natl Acad Sci U S A. 83 (13), 4913-4917 (1986).
- Castellani, R. J., Perry, G. Pathogenesis and disease-modifying therapy in Alzheimer's disease: the flat line of progress. Arch Med Res. 43 (8), 694-698 (2012).
- Green, R. C., et al. Effect of tarenflurbil on cognitive decline and activities of daily living in patients with mild Alzheimer disease: a randomized controlled trial. JAMA. 302 (23), 2557-2564 (2009).
- Gauthier, S., et al. Effect of tramiprosate in patients with mild-to-moderate Alzheimer's disease: exploratory analyses of the MRI sub-group of the Alphase study. J Nutr Health Aging. 13 (6), 550-557 (2009).
- Pickhardt, M., et al. Anthraquinones inhibit tau aggregation and dissolve Alzheimer's paired helical filaments in vitro and in cells. J Biol Chem. 280 (5), 3628-3635 (2005).
- Crowe, A., Ballatore, C., Hyde, E., Trojanowski, J. Q., Lee, V. M. High throughput screening for small molecule inhibitors of heparin-induced tau fibril formation. Biochem Biophys Res Commun. 358 (1), 1-6 (2007).
- Taniguchi, S., et al. Inhibition of heparin-induced tau filament formation by phenothiazines, polyphenols, and porphyrins. J Biol Chem. 280 (9), 7614-7623 (2005).
- Sigurdsson, E. M. Tau-focused immunotherapy for Alzheimer's disease and related tauopathies. Curr Alzheimer Res. 6 (5), 446-450 (2009).
- Tan, Y. J., et al. Phosphopeptide Enrichment with TiO-Modified Membranes and Investigation of Tau Protein Phosphorylation. Anal Chem. 85 (12), 5699-5706 (2013).
- Santa-Maria, I., Perez, M., Hernandez, F., Avila, J., Moreno, F. J. Characteristics of the binding of thioflavin S to tau paired helical filaments. J Alzheimers Dis. 9 (3), 279-285 (2006).
- Lira-De Leon, K. I., et al. Molecular mechanism of tau aggregation induced by anionic and cationic dyes. J Alzheimers Dis. 35 (2), 319-334 (2013).
- DiNitto, J. P., Wang, L., Wu, J. C. Continuous fluorescence-based method for assessing dicer cleavage efficiency reveals 3' overhang nucleotide preference. BioTechniques. 48, 303-311 (2010).
- Maeda, S., et al. Granular tau oligomers as intermediates of tau filaments. Biochemistry. 46 (12), 3856-3861 (2007).
- Pickhardt, M., et al. Phenylthiazolyl-hydrazide and its derivatives are potent inhibitors of tau aggregation and toxicity in vitro and in cells. Biochemistry. 46 (35), 10016-10023 (2007).
- Rankin, C. A., Sun, Q., Gamblin, T. C. Tau phosphorylation by GSK-3beta promotes tangle-like filament morphology. Mol Neurodegener. 2, 12 (2007).
- McKee, A. C., et al. Chronic traumatic encephalopathy in athletes: progressive tauopathy after repetitive head injury. J Neuropathol Exp Neurol. 68 (7), 709-735 (2009).
- Herrup, K. Reimagining Alzheimer's disease--an age-based hypothesis. J Neurosci. 30 (50), 16755-16762 (2010).
- Gavett, B. E., Stern, R. A., McKee, A. C. Chronic traumatic encephalopathy: a potential late effect of sport-related concussive and subconcussive head trauma. Clin Sports Med. 30 (1), 179-188 (2011).
- Tsitsopoulos, P. P., Marklund, N. Amyloid-beta Peptides and Tau Protein as Biomarkers in Cerebrospinal and Interstitial Fluid Following Traumatic Brain Injury: A Review of Experimental and Clinical Studies. Front Neurol. 4, 79 (2013).
