Key steps of protein function, in particular backbone conformational changes and proton transfer reactions, often take place in the microsecond to millisecond time scale. These dynamical processes can be studied by time-resolved step-scan Fourier-transform infrared spectroscopy, in particular for proteins whose function is triggered by light.
Method Article
Proton Transfer and Protein Conformation Dynamics in Photosensitive Proteins by Time-resolved Step-scan Fourier-transform Infrared Spectroscopy
Opens in a new tab
In This Article
Summary
Loading...
$$\rightleftharpoonup{xx}$$
$$\longleftharp{xx}$$,
$$\longrightharp{xx}$$,
Abstract
Loading...
$$\rightleftharpoonup{xx}$$
$$\longleftharp{xx}$$,
$$\longrightharp{xx}$$,
Monitoring the dynamics of protonation and protein backbone conformation changes during the function of a protein is an essential step towards understanding its mechanism. Protonation and conformational changes affect the vibration pattern of amino acid side chains and of the peptide bond, respectively, both of which can be probed by infrared (IR) difference spectroscopy. For proteins whose function can be repetitively and reproducibly triggered by light, it is possible to obtain infrared difference spectra with (sub)microsecond resolution over a broad spectral range using the step-scan Fourier transform infrared technique. With ~102-103 repetitions of the photoreaction, the minimum number to complete a scan at reasonable spectral resolution and bandwidth, the noise level in the absorption difference spectra can be as low as ~10-4, sufficient to follow the kinetics of protonation changes from a single amino acid. Lower noise levels can be accomplished by more data averaging and/or mathematical processing. The amount of protein required for optimal results is between 5-100 µg, depending on the sampling technique used. Regarding additional requirements, the protein needs to be first concentrated in a low ionic strength buffer and then dried to form a film. The protein film is hydrated prior to the experiment, either with little droplets of water or under controlled atmospheric humidity. The attained hydration level (g of water / g of protein) is gauged from an IR absorption spectrum. To showcase the technique, we studied the photocycle of the light-driven proton-pump bacteriorhodopsin in its native purple membrane environment, and of the light-gated ion channel channelrhodopsin-2 solubilized in detergent.
Introduction
Loading...
$$\rightleftharpoonup{xx}$$
$$\longleftharp{xx}$$,
$$\longrightharp{xx}$$,
To fully elucidate how proteins perform their function, it is required to measure them as they work, i.e. along a reaction path that often involves a series of intermediates and extends several orders of time. Key steps of protein function often take place in the microsecond to millisecond time range1, in particular backbone conformational changes and proton transfers reactions in membrane proteins. X-ray crystallography, arguably the pillar of structural biology, provides static (time-averaged) electron densities from well-diffracting protein crystals, notoriously difficult to grow with membrane proteins2. A 3D atomic model can be built based on electron densities, although rarely including the location of hydrogen atoms. Remarkable progress in time-resolved X-ray crystallography, relying either on Laue diffraction3 or on femtosecond X-ray pulses4, adds the time dimension to the high structural information inherent to X-ray crystallography5. But setting aside technical and analytical challenges, the crystal lattice can impair backbone conformational changes and alter protein dynamics, an unavoidable shortcoming of methods based on protein crystals5. Consequently, dynamical aspects of proteins are still best covered by optical methods, as pioneered by flash photolysis6,7, although with the general drawback of limited structural insight.
Fourier transformed infrared spectroscopy (FT-IR) combines the temporal resolution of optical spectroscopies with a valuable sensitivity to protein structure, the last feature exploited in innumerable static structural and functional investigations on membrane proteins8-11. In particular, FT-IR difference spectroscopy has proven to be an ideal tool to study tiny spectral changes as a protein transits from one metastable state to another12-19.
Studies on protein dynamics, other than at the single molecule level20,21, require a triggering process for synchronization. A reaction is conveniently initiated fast and not invasively using light as trigger, as done in the study of proteins with cyclic photoreactions. A major challenge associated with time-resolved studies is the attainment of sufficient time resolution while maintaining good spectral resolution and appropriate signal-to-noise ratio. Also essential is to cover a sufficiently broad spectral and temporal range. Time-resolved step-scan FT-IR spectroscopy excels in all of these aspects22, with published examples covering spectral ranges as wide as 3,900-850 cm-1 and dynamics extending ~9 orders of time, with up to 3.5 cm-1 spectral and 30 nsec temporal resolution23-28.
Fourier-transform IR spectrometers show reduced noise and improved photometric accuracy over dispersive ones29. However, in the normal rapid-scan recording mode FT-IR spectrometers suffer from a time-resolution limited to ≥5-10 msec as a consequence of the minimum time the mobile mirror of the interferometer requires to complete a scan. With the step-scan technique, in contrast, the time dependence of the dynamic event is decoupled from the scan duration of the interferometer. Briefly, the mobile mirror moves in discrete steps rather than continuously scanning to complete a scan. At each of these steps the (mobile) mirror is held fixed and a transient is recorded. Thus, the time-resolution is limited by the rise time of the mercury-cadmium-telluride (MCT) detector, which is typically in the range of 10-100 nsec. In practice, the large dynamic range of the interferogram (containing an intense signal in the centerburst and small signals in the wings), requires for proper digitalization an analog/digital converter (ADC) with as many as 16-24 bits, leading to sampling rates not higher than ~200 kHz (5 µsec)30. Nanosecond time-resolution can be accomplished by measuring only the changes in the interferogram, for which a 8-12 bit ADC is sufficient23,31-33. Technical aspects30,34,35 and applications36-38 of time-resolved step-scan have been discussed in detail elsewhere.
The purpose of the current contribution is to provide a protocol describing the practicalities of time-resolved step-scan FT-IR spectroscopy on photosensitive membrane proteins. Here, the performance of the technique is shown for two sampling methods: transmission and attenuated total reflection (ATR). The use of ATR allows working in the presence of excess water, which not only ensures full hydration conditions for the protein but also allows acute control of the sample pH and ionic strength49,50. Step-scan experiments are illustrated on two selected systems: bacteriorhodopsin and channelrhodopsin-2.
The light-driven proton pump bacteriorhodopsin (bR) has been the subject of numerous biophysical studies for over forty years39,40, making it the best-understood membrane protein so far. Among the numerous techniques applied to the study of bR functionality FT-IR spectroscopy has arguably exerted one of the largest impacts. Namely, FT-IR spectroscopy has been key to resolve the groups involved in proton transfer across the membrane as accounted elsewhere13,41,51.
Channelrhodopsin (ChR) is the first light-gated ion channel found in nature42,43. Light excitation of ChR leads to the transient opening of an ion channel. Its discovery settled the way for the development of optogenetics, where molecular processes are controlled by light44,45. ChR belongs, as bR, to the family of microbial rhodopsins but in contrast to bR, much less is known about its functional mechanism52. ChR2 combines its function as an ion channel with proton-pumping activity46,47. Recently, we applied time-resolved step-scan FT-IR spectroscopy to resolve intra-protein proton transfer reactions and the dynamics of protein backbone conformation changes in ChR2 48.
Protocol
Loading...
$$\rightleftharpoonup{xx}$$
$$\longleftharp{xx}$$,
$$\longrightharp{xx}$$,
1. General Aspects of Sample and Instrument Preparation
- Use a commercial FT-IR spectrometer equipped for time-resolved step-scan measurements. For best results place the FT-IR spectrometer on top of a vibration-decoupled table.
- Evacuate the optics compartment to a few mbar. Purge the sample compartment with dry air or nitrogen.
- Place an IR transparent material opaque to visible radiation in front of the MCT detector of the FT-IR spectrometer. This precaution is essential to prevent artifacts from the exciting laser pulse during step-scan experiments. Note: We use a germanium (Ge) window of 25 mm diameter. Its high refractive index causes undesirable intensity loses, largely avoided using a Ge filter with antireflecting coating.
- Cool down the MCT detector dewar with liquid nitrogen. Note: The use of photovoltaic MCT detectors is preferred over photoconductives because of their linear response and, thus, superior photometric accuracy and baseline reliability31,53.
- Pre-concentrate the sample used for the experiments to at least 2 mg protein/ml in a buffer of low (<20 mM) ionic strength to prevent formation of salt crystals while drying the protein suspension to form a homogenous protein film. For samples that sediment, wash/concentrate them by applying ultracentrifugation (e.g., membrane proteins in a liposomes or in cell membrane patches). Use centricons of proper cutoff for proteins that do not sediment (e.g., detergent solubilized membrane proteins).
- For optimum results use: a) protein preparations as pure and active as possible; b) lipid/protein ratios ≤ 3 in weight for proteins in cell membrane patches or reconstituted in liposomes; c) detergent/protein ratios ≤ 1 in weight for detergent solubilized proteins. Avoid the use of detergents or lipids whose vibrational bands overlap with those of the protein (e.g., CHAPS).
2. Preparation of Attenuated Total Reflection Experiments on Bacteriorhodopsin
- Mount the ATR accessory into the sample compartment of the FT-IR spectrometer. Note: We use a ZnSe/diamond ATR with 5 active reflections. Avoid semiconductor materials such as germanium or silicon as internal reflection element (IRE) of the ATR accessory, as their optical properties are affected by the exciting visible laser.
- Measure a broad-range (approx. 4,000-800 cm-1) energy spectrum at 4 cm-1 resolution of the clean IRE surface by conventional rapid-scan FT-IR spectroscopy. Use this spectrum as a reference spectrum to compute absorption spectra at a later stage.
- Cover the IRE surface of the ATR with 20 μl of the buffer used later to rehydrate the sample (e.g., 4 M NaCl and 100 mM NaPi at pH 7.4). Measure the IR absorption of the buffer.
- Remove the buffer, and rinse the IRE surface with water. Avoid touching the surface. Remove residual liquid from the IRE surface by an intense air flow.
- Spread ~3 μl of bacteriorhodopsin (bR) in purple membranes (~6 mg protein/ml in deionized water) on top of the IRE surface (~0.2 cm2 area). Dry the protein suspension under a gentle stream of dry air until a film is attained.
- Measure the absorption spectrum of the dry film (see Figure 1).
- Gently add 20-40 μl of a buffer of high ionic strength to rehydrate the dry film (e.g., 4 M NaCl and 100 mM NaPi at pH 7.4). Note: The high ionic strength prevents excessive swelling of the membrane film, allowing to retain as much protein as possible close to the probed surface (Figure 2).
- Cover the ATR holder with a lid to prevent water evaporation. Optionally, place a cover-jacket connected to a circulatory bath set to 25 °C for temperature control. For proteins with long photocycles (>seconds), temperature control might increase baseline stability.
- Measure an absorbance spectrum. Estimate the percentage of sample remaining near the surface after rehydration of the film by subtracting the absorption spectrum of the buffer (Figure 3).
- Confirm stabilization of the film swelling by recording absorption spectra at 5-20 min intervals after rehydration (Figure 4). This step is optional but recommended.
3. Performing Transmission Experiments on Detergent-solubilized Channelrhodopsin-2
- Add 10 μl of ChR2 (~10 mg protein/ml) dissolved in 5 mM NaCl, 5 mM HEPES (pH 7.4) and decyl-maltoside (DM) at the center of a BaF2 window of 20 mm diameter. Spread it with the help of the micropipette tip to a 6-8 mm diameter (protein surface density of ~ 200 μg/cm2).
- Form a film using a gentle flow of dry air. For best results ensure that the film is homogeneous and has a diameter roughly matching the size of the IR beam at the largest aperture.
- Hydrate the film by adding 3-5 μl of a mixture of glycerol/water distributed in 3-5 drops around the dry film, and tightly close it with a second window using a flat silicone O-ring of ≥1 mm thickness. Note: The ratio of the glycerol/water mixture controls the relative humidity between the windows54. For hydroscopic samples use a 3/7 or 2/8 glycerol/water ratio (w/w). The glycerol/water drops should never be in direct contact with the protein film.
- Insert the BaF2 sandwiched windows in a holder. Prevent straight light from reaching the detector by covering the sample window with an IR opaque material, such as paper, with a hole matching the size of the hydrated film. Place the holder in the sample compartment.
- Control the temperature of the holder to 25 °C by a thermostatic jacket connected to a temperature controlled circulatory bath.
- Measure an absorption spectrum. Ensure that the maximum absorption in the amide I region (~1,700-1,620 cm-1) is in the range of 0.6-1.0.
- Estimate the mass and molar ratio of protein/detergent/water from the absorption spectrum of the hydrated film (Figure 5) using reference extinction coefficient spectra for water, DM, and representative membrane proteins (Figure 6).
- Wait until the hydration level stabilizes before performing step-scan experiments (≥1 hr).
4. Adjustment and Synchronization of the Exciting Laser
For experiments on bR use the second harmonic emission of a pulsed Nd:YAG laser (λ = 532 nm) to trigger the photocycle. For experiments involving ChR2, use an excitation of λ = 450 nm as provided by an optical parametric oscillator (OPO) driven by the third harmonic (λ = 355 nm) of a Nd:YAG laser. Ensure that the laser pulse is sufficiently short (~10 nsec) to minimize secondary photo-excitation. Note: The energy of the laser pulses should be as constant as possible. In our setup, the laser intensity fluctuates ≤10% around the mean value, as confirmed by measuring a reflex of the laser by a photodiode connected to a transient recorder and integrating the response (Figure 8).
- Couple the laser to the sample. Adjust the energy density of the laser at the sample to 2-3 mJ/cm2 per pulse using a power-meter.
- For the ATR setup, use an optical fiber placed atop of the ATR lid.
- For transmission experiments, use mirrors to bring the laser to the sample and, if required, lenses to either collimate or diverge the laser beam to a diameter slightly above the sample film size.
- Synchronize the laser pulse with data recording by the spectrometer. Use the Q-switch sync-out TTL pulse of the electronics of the Nd:YAG laser to trigger the spectrometer. Set the excitation rate of the Nd:YAG laser to 10 Hz for bR and 0.25 Hz for ChR2, respectively.
- Use a pulse delay generator (PDG) to control the laser excitation rate if the repetition rate of the Nd:YAG laser is not easily adjustable.
- Connect the lamp sync-out of the Nd:YAG laser to the PDG external trigger input. The PDG provides a ~190 μsec delayed TTL pulse output to the Q-switch sync-in input of the Nd:YAG laser to trigger the lasing. Gate the PDG to accept an external trigger only after certain period of time since the last accepted trigger (100 msec for bR or 4 sec for ChR2).
5. Time-resolved Step-scan Preparations and Settings
- Place a low pass optical filter in the optical path. To perform time-resolved step-scan measurements in the 1,800-850 cm-1 spectral range, use a filter opaque above 1,950 cm-1 and with good transmission (>50-80%) below 1,800 cm-1 (Figure 7).
- Change the detector from AC to DC-coupled mode. Note: After this adjustment the interferogram signal will no longer oscillate around zero but around a value known as the DC-level.
- Use the largest possible beam aperture of the spectrometer for higher photon flux and, thus, better signal-to-noise, but within the linearity limits of the detector.
- Bring the DC-level of the interferogram to zero and readjust the electronic gain to make better use of dynamic range of the analog digital converted (ADC). Achieve DC-level offset by applying a voltage bias to the signal provided by the pre-amplifier. Note: This option is included in modern FT-IR spectrometers. Otherwise, a home-made external device can be used instead, placed between the preamplifier and the ADC 38. Care is then needed to ensure that the electronics of such device are fast and linear.
- Start the step-scan menu of the FT-IR spectrometer. Set the target spectral bandwidth for the step-scan measurement to 1,975.3-0 cm-1. Adjust the spectral bandwidth to a fraction of the He-Ne laser wavenumber (1/8th in the present case), slightly exceeding the cutoff of the optical filter.
- Disable any high-pass electronic filter to prevent distortions of the kinetics at later times. A low-pass electronic filter can be beneficial when its cutoff frequency is in the order or above the sampling rate of the ADC (reduces noise aliasing).
- Set the spectral and phase resolution to 8 cm-1 and 64 cm-1, respectively. Set the interferogram acquisition mode to single-side forward. With these options one interferogram requires about 500 points.
- Set the sampling rate of the ADC to the highest available in the spectrometer (e.g., 160 kHz, or 6.25 μsec). Set the “trigger for experiment” to “External”, i.e., the laser is the master. Set the number of linearly-spaced data points to be recorded: 7,000 for bR (up to 42 msec) and 20,000 for ChR2 (up to 125 msec). Note: Longer time-scales can be covered without overflowing the ADC memory using a quasi-logarithmically time-spaced external TTL pulses from a wave generator to trigger data acquisition 38, or by using two parallel transient recorders as substitutes of the internal ADC31,32.
- Save approximately 100 pre-trigger points as a reference for the dark state of the sample. Note: In the millisecond time-scale the data quality is often limited by fluctuations in the mobile mirror. Increasing the pre-trigger points above 100 is, therefore, not expected to significantly improve the data quality.
- Set the number of co-additions, i.e., number of averages of the photoreaction per mirror position. For bR, use 20 co-additions (20 min of measuring time at 10 Hz excitation rate). For ChR2 use 2 co-additions (70 min of measuring time at 0.25 Hz excitation rate)
- Repeat the experiment 10x for bR, and 35x on three different sample films for ChR2, to have finally ~200 co-additions per mirror position.
6. Data Processing
- Confirm the status of the sample by comparing the light-induced IR difference spectrum obtained from the first and the last measurement. Consider discarding any measurements where the intensity of the difference spectrum drops below 60% of the first measurement.
- Average the recorded interferograms.
- Using the OPUS software from the FTIR spectrometer select the time-resolved interferograms to average and add them to the “Spectrum Calculator”.
- Click “=” to obtain the average of the interferograms.
Note: When the phase of the interferogram is constant during the measurement it is indifferent to average interferograms or single-channel spectra. A constant phase can be confirmed by computing and comparing the phase spectrum for the first and the last recorded interferogram.
- Perform the Fourier transform of the averaged time-resolved interferograms to obtain averaged time-resolved single channel spectra.
- Using the same software as in step 6.2.1, select the averaged time-resolved interferogram and click the icon for “interferogram to spectra”. Use the Mertz phase-correction method, a zero-filling factor of 2 (two digital points per instrumental resolution), and an apodization function (e.g., triangle, Blackmann-Harris 3-terms, etc.).
- Click the bottom “convert” to transform the time-resolved interferogram into time-resolved spectra.
- Export the time-resolved single channel data as a “data point table” or a “matlab” file using the “save as” icon in the OPUS software. Continue the data processing in an external program.
- Average the single channel spectra before the laser, and convert the time-resolved single channel data to time-resolved absorption difference spectra.
- Compute a vector for the expected noise standard deviation in the difference spectra as a function of wavenumber (Figure 12), using the noise standard deviation, ε, and mean, S0(ν), of the 100 single channel spectra preceding the laser: ε / S0(ν). The value of ε is estimated subtracting consecutive single channel spectra and calculating the standard deviation corrected by √2.
- Remove spectral regions too noisy to be of use (e.g., above 1,825 cm-1 and below 850 cm-1).
- Perform a quasi-logarithmically averaging (e.g., 20 spectra/time decade). The appearance of the data will improve and the number of spectra will be reduced from ~104 to ~102 without any significant information lost (Figure 9).
- Increase four times the spectral density of points (to 1 point/cm-1) using Fourier interpolation (post zero-filling).
Note: We perform steps 6.4.1 to 6.4.4 in a home-made program running in MATLAB.
- Process the obtained time-resolved spectra (Figure 10A) with singular value decomposition, SVD, (Figure 13). Accomplish data denoising by reconstructing the data with a limited number of significant SVD components (Figure 10B). Note: We perform SVD in MATLAB, using the built-in “svd” function.
Results
Loading...
$$\rightleftharpoonup{xx}$$
$$\longleftharp{xx}$$,
$$\longrightharp{xx}$$,
Figure 1 shows an absorption spectrum of a dry film of bR deposited on the surface of the diamond internal reflection element used for ATR spectroscopy. Characteristic bands from vibrations of the peptide bond (amide A, amide I and amide II) are clearly distinguishable. The approximate thickness of the dry film can be estimated as ~1 μm, considering the amount of added protein (18 μg) and the surface of the ATR (~0.2 cm2), and taking the density of protein as ~1.4 g/cm3,58 and of lipids as 1.0 g/cm3,59 and a lipid/protein ratio of 1/3 (w/w) in purple membrane60.
The dry film was rehydrated with excess of 4 M NaCl, 100 mM NaPi at pH 7.4 (Figure 3). The hydration level and effective protein concentration in the volume probed by the evanescent wave can be deduced from the scaling factor needed to digitally remove absorption bands from water. The optimum scaling factor was 0.87, meaning that in this case the buffer occupies 87% and the sample 13% of the volume near the surface. Taking into account protein and lipid density and the lipid/protein ratio in purple membranes (see above), we can deduce an effective protein concentration of 125 mg/ml in the volume probed by the evanescent wave. We can deduce from the hydration level that, in this particular case, the sample film thickness expanded ~6 times upon rehydration, from ~1 to ~6 μm. For a 45° incident angle, typical for our and for most ATR arrangements, the penetration depth of the evanescent field (dp) for a hydrated protein film varies between 0.3 and 0.6 μm in the 1,800-850 cm-1 interval 61. Because the evanescent field is almost insensitive to the sample located two times above dp 61, we infer that the amount of protein used in the ATR experiment could be in principle reduced 5x without any significant loss of signal.
When using buffers of lower ionic strength the film expands more, and the amount of protein in the volume probed by the evanescent field is reduced (Figure 2). The exact dependence between film swelling and the ionic strength of the buffer will depend, among other factors, on the nature of the lipids. For instance, a similar film swelling as obtained here for bR in purple membrane using 4 M NaCl was obtained for a membrane protein reconstituted in polar E. coli lipids using just 0.1 M NaCl 62. If the sample occupies less than 5% of the probed volume consider re-doing the hydration step using a buffer of higher ionic strength. Film swelling after hydration requires some time to reach stabilization (Figure 4). For bR in purple membrane the process is monoexponential, with a time constant of 12 min: it takes no more than 30-60 min to have a stable rehydrated film
Figure 5 shows an IR absorption spectrum of a hydrated film of ChR2 obtained by transmission. Here, hydration was achieved by exposing the dry film to an atmosphere of controlled humidity provided by a mixture of glycerol/water. The spectrum can be decomposed into contributions from water, detergent and protein. We could estimate the amount of each of them using extinction coefficient spectra, scaled to fit the experimental spectrum. For water we took the extinction coefficient spectrum from the literature63, and for DM we measured it from a 100 mg/ml solution (Figure 6). We also used extinction coefficients for two representative membrane proteins: the mitochondrial ADP/ATP carrier64 and bR (Figure 7). The scaling factor indicates a water and DM mass surface density of 260 μg/cm2 and 200 μg/cm2 in the film, respectively. The remaining absorption (Figure 5, red line) comes mainly from the protein, estimated to be at a surface density of 250 μg/cm2 using the amide II extinction coefficient from two different membrane proteins (see Figure 6). The molar ratio for protein/detergent/water was calculated to be 1/60/2000 using a molecular mass of 35 kDa, 480 Da, and 18 Da, respectively.
A 3D plot from typical time-resolved step-scan FT-IR experiment on bR is presented in Figure 10A, obtained by ATR and involving 200 min of data acquisition. Spectra can be extracted at specific times, for instance when the L, M and N intermediates of the bR photocycle are expected to reach their highest population (Figure 11). Their spectral features have been described extensively13,41,65 and will be not discussed further here. Figure 12 shows time-traces at some selected wavenumbers. Namely, the rise of the kinetics at 1,762 cm-1 (t1/2 ~60 μsec) reports on the dynamics of Asp85 protonation from the retinal Schiff base66, and its decay to zero indicates its deprotonation upon ground-sate recovery67. The negative rise of the kinetics at 1,740 cm-1 (t1/2 ~1 msec) reports on the deprotonation of Asp96 side chain, the proton donor to the Schiff base68. The decay of the intensity to zero reports on its reprotonation from the cytoplasm67. The dynamics of protein conformational changes can be probed by absorption changes in the amide I and amide II region, which reaches a maximal change at ~3 msec at room temperature67,69.
The application of SVD to spectroscopic problems has been reviewed before55,56. Briefly, SVD factorizes the experimental data, arranged into a matrix A, as: A = U S VT. This factorization can be modified to account for the noise dependence on wavenumber and to penalize fluctuations/drifts in the baseline57. The columns of U and V contain orthonormal spectra and time-traces vectors for each SVD component, respectively. S is a diagonal matrix containing the so-called singular values. The (abstract) spectro-temporal components in U and V appear in decreasing relevance to describe the experimental data in the least-square sense, quantified by their associated singular value. Figure 13A shows the singular values as a function of the component number, and reproduces the first eight columns/components of U (abstract spectra, Figure 13B) and V (abstract time-traces, Figure 13C). The signal is concentrated in the first five components (as expected for a photocycle containing five intermediate states), with components above largely dominated by random noise and other sources of errors. The experimental data was reconstructed using only the first five columns of U and V, and the first five columns and rows of S. The data reconstructed by SVD represents the best least-square approximation of the experimental data to a matrix of rank five. The reconstructed data shows improved quality (Figure 10B). Namely, the noise is largely reduced, as well as some barely noticeable fluctuations and drifts in the baseline (common in time-resolved step-scan spectroscopy 25). SVD processing is especially beneficial for improving the quality of the experimental time-traces in the millisecond range (red lines in Figure 12).
Time-resolved step-scan data for the ChR2 photocycle were obtained using the above described protocol for transmission experiments (Figure 14A), roughly involving 120 hr of accumulated measurements. The time-resolved data collected by step-scan extends from 6.25 µsec to 125 msec. The photocycle of ChR2 requires approximately 60 s for full recovery. The latest part of the photocycle can be covered using rapid-scan FT-IR, and both step-scan and rapid-scan data sets merged as presented elsewhere48. The spectral changes of ChR2 are ~10-fold smaller than those obtain from bR, making the measurements more challenging. Specially, oscillations in the baseline in the millisecond range become clearly evident at these low absorption changes. These are due to small oscillations in the mobile mirror in the millisecond time scale25. The oscillations, together with part of the noise, can be largely removed by SVD, remarkably improving the appearance of the data (Figure 14B).

Figure 1. Absorption spectrum of bR in purple membrane dried on top the diamond surface of an ATR accessory. Bands from vibrations of the peptide bond (amide I, II, and A) are indicated.

Figure 2. Absorption spectrum of a film of bR after rehydration using buffers of various ionic strengths (dilutions of 4 M NaCl, 100 mM Na2HPO4/NaH2PO4 at pH 7.4). Notice the decrease of the amide II band, i.e., increased film swelling, with decreasing ionic strength of the buffer. (Insert) Relative amount of protein near the surface, quantified by the intensity of the absorbance at 1,541 cm-1 (amide II maximum) after subtraction of the absorption contribution of the buffer.

Figure 3. Absorption spectrum of a film of bR rehydrated with bulk buffer (4.3 M ionic strength) and after subtraction of the buffer contribution. The subtraction factor, 0.87, was chosen to remove the strong water absorption between 3,700-3,000 cm-1 and to obtain a flat baseline between 2,700-1,800 cm-1.

Figure 4. Absorption spectrum of bR after rehydration with a buffer of 4.3 M ionic strength (buffer absorption has been subtracted for clarity as in Figure 3). The insert shows the evolution of the film swelling after rehydration, followed by the protein amide II absorbance at 1,541 cm-1. A fit to a single exponential indicates a time constant for film swelling stabilization of 12 min.

Figure 5. Absorption spectrum of a hydrated film of ChR2 measured by transmission (blue line). The extinction coefficient spectrum of water (dashed orange line) and DM (dashed cyan line) was scaled and subtracted (red line).

Figure 6. Reproduced mass extinction coefficient spectra at 25 °C for liquid water (http://www.ualberta.ca/~jbertie/JBDownload.HTM#Spectra) and for a hydrated film of the ADP/ATP carrier (AAC)64. The mass extinction coefficient spectrum was measured in solution for DM (100 mg/ml), and in a hydrated film for bR.

Figure 7. Transmittance of the optical filter used in the time-resolved scan-scan FT-IR measurements.

Figure 8. Performance of the laser pulses provided by the second harmonic (532 nm) of a Nd:YAG laser. Histogram of the variation of the relative energy of 1,000 laser pulses, and fit to a Gaussian distribution with a standard deviation of 0.05.

Figure 9. Light-induced absorbance changes of bR at three representative wavenumbers at uniform time spacing intervals (green, black, and blue lines) and after quasi-logarithmic averaging to ~20 points/decade (red lines). Notice the noise reduction after logarithmic averaging, revealing oscillation of the time traces in the millisecond range.
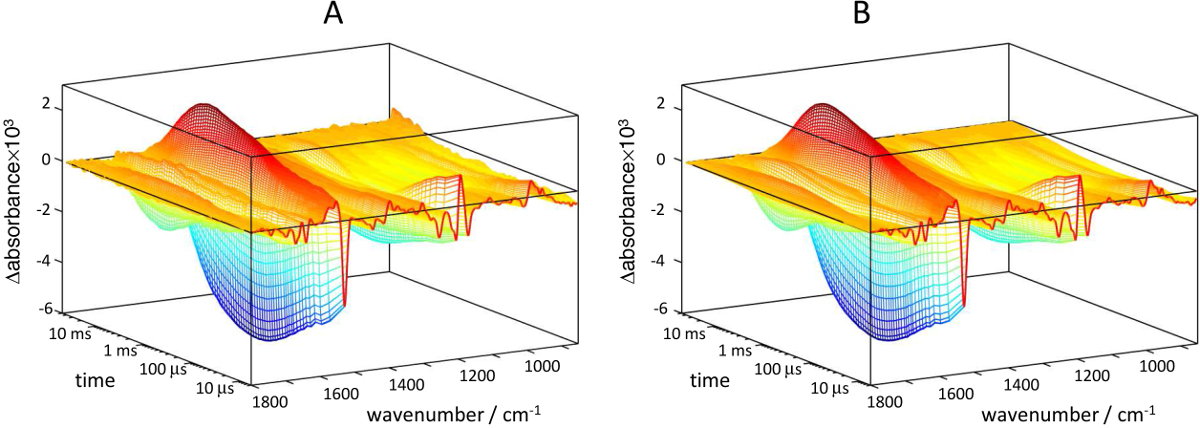
Figure 10. 3D representation of light-induced absorbance changes for bR recorded by ATR at pH 7.4 (4 M NaCl, 100 mM NaPi). A) Raw data. B) Data reconstructed with five SVD components. Please click here to view a larger version of this figure.

Figure 11. FT-IR difference absorption spectra of the bR photocycle at three selected times where the L (12.5 µsec), M (300 µsec), and N (6 msec) intermediates are most enriched.
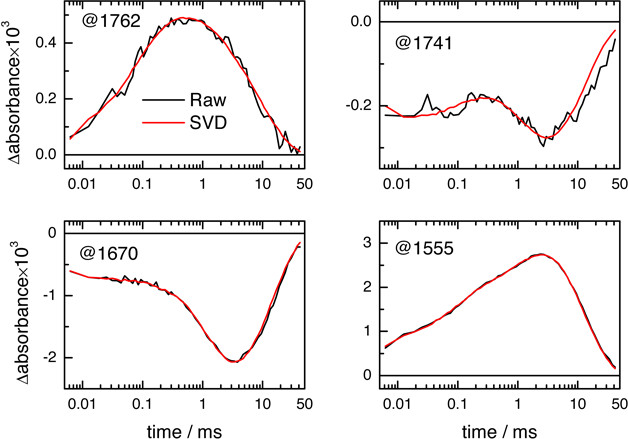
Figure 12. Proton transfer and protein backbone dynamics in the bR photocycle as resolved by time-resolved step-scan FT-IR difference spectroscopy. The absorbance changes at 1,762 cm-1 reports on the protonation/deprotonation dynamics of Asp85, and at 1,741 cm-1 on the deprotonation/reprotonation dynamics of Asp96 (including H-bonding changes before 300 μsec). The time-traces at 1,670 and 1,555 cm-1 report changes in amide I and II vibrations, both sensitive to the conformation of the peptide backbone. The back traces correspond to the raw data, and the red ones to SVD-treated data. Please click here to view a larger version of this figure.
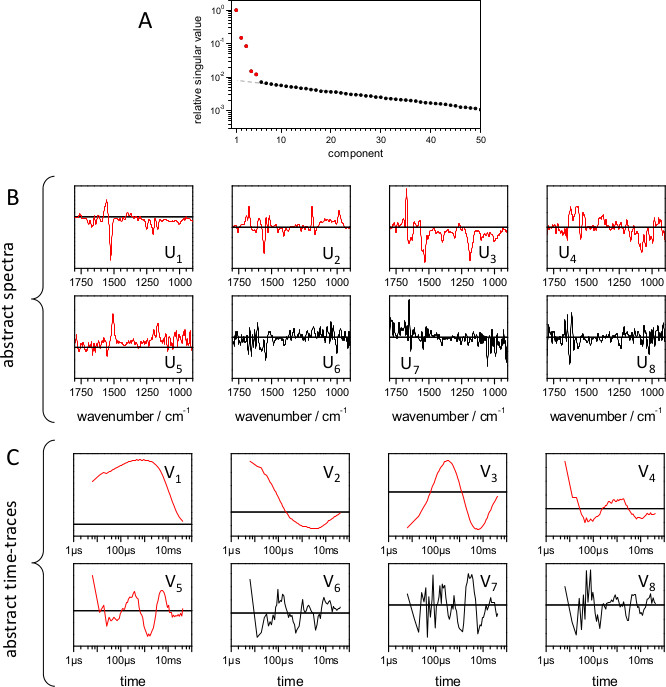
Figure 13. Singular value decomposition (SVD) of the experimental time-resolved step-scan FT-IR data of the bR photocycle (see Figure 10A). SVD was performed after weighing the experimental data taking into account the noise standard deviation dependence on wavenumber (Figure 15); combined with the 1st derivative to reduce the statistical weight of baseline fluctuations, as described before57. A) Plot of the relative singular values of the first 50 components (black circles). The first five components are assigned to signal components (red circles). The rest of components decay exponentially as expected for noise-components (see dashed gray line). B) First eight abstract spectra (U1 to U8). C) First eight abstract time-traces (V1 to V8). The abstract spectra and time-traces assigned to signal are depicted in red lines, and with black lines otherwise. Please click here to view a larger version of this figure.
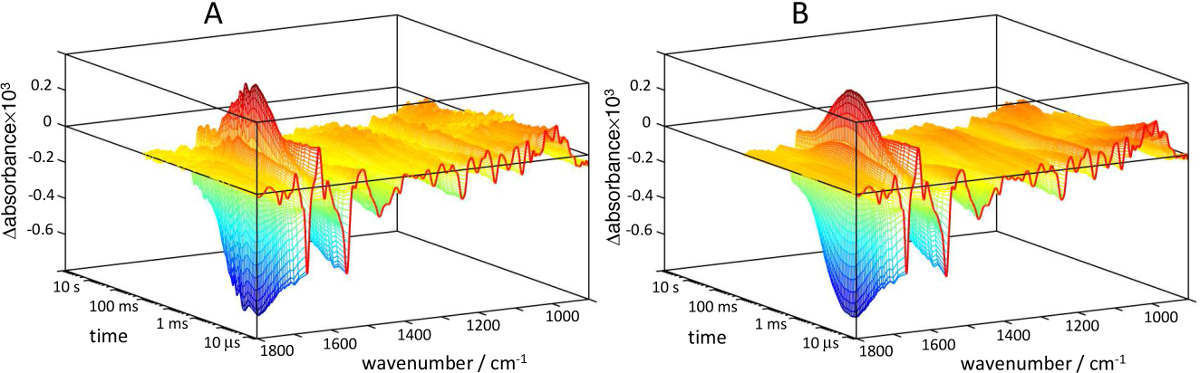
Figure 14. 3D representation of light-induced IR absorbance changes for ChR2 recorded by step-scan in transmission mode. The step-scan data extends until 125 msec, only covering a part of the photocycle. A) Raw data. B) Data reconstructed with five SVD components. Please click here to view a larger version of this figure.

Figure 15. Estimated noise level in an FT-IR. Difference absorption spectrum at 6.25 μsec temporal and 8 cm-1 spectral resolution for an experiment involving 1 co-addition/mirror position (500 photoreactions) or ~200 co-addition/mirror position (105 photoreactions). Values are shown for the attenuated total reflection (ATR) and the transmission setup.
Discussion
Loading...
$$\rightleftharpoonup{xx}$$
$$\longleftharp{xx}$$,
$$\longrightharp{xx}$$,
One of the first aspects that needs consideration when performing time-resolved step-scan FT-IR experiments on a protein is the preparation of a sample in a suitable form for IR spectroscopy. The IR absorption from substances other than the protein of interest needs to be reduced, especially that from water. The most common approach is to evaporate the bulk water of the sample to form a film. The film can be rehydrated either by adding some droplets of an aqueous solution or by exposing the film to an atmosphere of controlled humidity. We have shown how in both cases it is possible to estimate the hydration level obtained by means of IR absorption spectroscopy (see Figure 3 and Figure 5). Although the obtained hydration levels might appear low compared to those in solution, they are actually close to those found in living cells70, making the study of hydrated films of proteins functionally relevant. Besides water, it is also important to know and to control the amount of lipid or detergent in the sample. Both should be kept low enough to have a reduced spectroscopic impact in the IR absorption, but high enough to preserve the integrity and functionality of the protein of interest.
Time-resolved step-scan spectroscopy is only straightforwardly applicable to proteins showing reversible reactions that can be triggered reproducibly by light (but see progress in coupling step-scan with rapid buffer exchange)71. In step-scan the reaction needs to be reproducible for at least ~500x, the minimum number to complete an interferogram covering the 1,800-850 cm-1 region at 8 cm-1 resolution. In practice, however, additional data averaging is generally required to push the noise level down. For 200 co-additions/mirror position (105 repetitions of the reaction) a 6.25 μsec resolution absorbance difference spectrum can display a noise standard deviation between 2 x 10⁻⁵ and 2 x 10⁻⁴ for an ATR and between 5 x 10⁻⁶ and 3 x 10⁻⁵ for a transmission experiment (Figure 15). Thanks to its higher photon throughput, transmission allows for ~7 lower noise levels than ATR, a key aspect for successfully studying samples giving weak absorption changes such as ChR2. On the other hand, ATR requires 5 to 25 times less sample than a transmission experiment.
The application of time-resolved step-scan FT-IR spectroscopy is problematic for proteins displaying slow photocycles: recording an interferogram by step-scan can become unpractical long. Some solutions have been presented for dealing with such cases72,73, often based on using multiple exchangeable samples to speed up measurements at the cost of increased protein consumption and experimental complexity27,74. In some instances it is possible to circumvent this problem by exciting the sample before the photocycle is strictly completed. For ChR2, with a photocycle requiring after photo-excitation 60 sec for 99% recovery, the recovery at 4 sec is already of 80%48. With an excitation efficiency of 10% per laser pulse, 98% of ChR2 molecules are in the dark state 4 sec after photo-excitation, making possible to perform experiments at a laser repetition rate to 0.25 Hz.
Data processing is a final technical aspect required to attain the best possible results. Logarithmic averaging reduces noise and, also important, reduces the size of the data without distortions, a feature essential for posterior data analysis using singular value decomposition or global fitting. Logarithmic averaging is, however, not very successful in averaging out fluctuations in the time-traces caused by oscillations in the mobile mirror and other 1/f noise sources during the measurements (Figure 9). These fluctuations in the baseline can exceed the noise in the millisecond range and corrupt the quality of the data. Singular value decomposition takes advantage of the redundancy of the data to reduce the noise, and with some modifications57 it can reduce as well fluctuations in the baseline.
Finally, the harder and most time-consuming part of a time-resolved step-scan FT-IR experiment corresponds to the assignment of bands and to the spectral and kinetic interpretation of the data. For bacteriorhodopsin many of the bands appearing in the IR difference spectra have been assigned or interpreted thanks to the accumulated work of many researcher groups over decades. For a much less studied protein, such as channelrhodopsin-2, the above presented time-resolved IR experiments need to be accompanied by parallel experiments on site-directed mutants and combined with information from complementary techniques to reach a mechanistic interpretation48.
Disclosures
Loading...
$$\rightleftharpoonup{xx}$$
$$\longleftharp{xx}$$,
$$\longrightharp{xx}$$,
The authors declare no competing financial interest.
Acknowledgements
Loading...
$$\rightleftharpoonup{xx}$$
$$\longleftharp{xx}$$,
$$\longrightharp{xx}$$,
This work was supported by grants from the Deutsche Forschungsgemeinschaft to J.H. (FOR-1279, SFB-1078, B3). We thank Tom Resler and Björk Süss for helpful comments.
Materials
| Name | Company | Catalog Number | Comments |
|---|---|---|---|
| FT-IR spectrometer | Bruker | Vertex 80v | Equipped with photovoltaic-MCT detector, an external global, and an oil-free pump. Firmware 2.3. |
| BaF2 windows | korth Kristalle | ||
| Diamond ATR accesory | Smiths detection | Nine-reflection DuraDisk | |
| Thermostatic bath | Julabo | F25 | |
| Vibration decoupled table | OPTA | ||
| Pulsed Nd:YAG laser with a second harmonic generator | Continuum electro-Optics | Minilite | |
| Optical parametric oscillator (OPO) | OPTA | BBO-355-VIS/IR S/N 1009 | |
| Digital delay/pulse generator | Stanford Research Systems | DG535 | |
| Pulsed Nd:YAG laser with a third harmonic generator | Spectra-Physics | Quanta-Ray | |
| Various optical mirrors and lenses | ThorLabs | ||
| OPUS 7.0 | Bruker | Software to control Vertex 80v spectrometer | |
| MATLAB run time | Mathworks | Used to run home-made executable programs to preprocess the data |
References
Loading...
$$\rightleftharpoonup{xx}$$
$$\longleftharp{xx}$$,
$$\longrightharp{xx}$$,
- Henzler-Wildman, K., Kern, D. Dynamic personalities of proteins. Nature. 450, 964-972 (2007).
- Lacapère, J. J., Pebay-Peyroula, E., Neumann, J. M., Etchebest, C. Determining membrane protein structures: still a challenge. Trends Biochem. Sci. 32, 259-270 (2007).
- Wöhri, A. B., et al. Light-induced structural changes in a photosynthetic reaction center caught by Laue diffraction. Science. 328, 630-633 (2010).
- Aquila, A., et al. Time-resolved protein nanocrystallography using an X-ray free-electron laser. Opt. Express. 20, 2706-2716 (2012).
- Neutze, R., Moffat, K. Time-resolved structural studies at synchrotrons and X-ray free electron lasers: opportunities and challenges. Curr. Opin. Struc. Biol. 22, 651-659 (2012).
- Austin, R. H., et al. Dynamics of carbon monoxide binding by heme proteins. Science. 181, 541-543 (1973).
- Alberding, N., et al. Tunneling in ligand binding to heme proteins. Science. 192, 1002-1004 (1976).
- Goormaghtigh, E., Cabiaux, V., Ruysschaert, J. M. Determination of soluble and membrane protein structure by Fourier transform infrared spectroscopy. III. Secondary structures. Subcell. Biochem. 23, 405-450 (1994).
- Tamm, L. K., Tatulian, S. A. Infrared spectroscopy of proteins and peptides in lipid bilayers. Q. Rev. Biophys. 30, 365-429 (1997).
- Arrondo, J. L., Goñi, F. M. Structure and dynamics of membrane proteins as studied by infrared spectroscopy. Prog. Biophys. Mol. Biol. 72, 367-405 (1999).
- Barth, A., Zscherp, C. What vibrations tell us about proteins. Q. Rev. Biophys. 35, 369-430 (2002).
- Gerwert, K. Molecular reaction-mechanisms of proteins as monitored by time-resolved FTIR Spectroscopy. Curr. Opin. Struct. Biol. 3, 769-773 (1993).
- Maeda, A. Application of FTIR spectroscopy to the structural study on the function of bacteriorhodopsin. Isr. J. Chem. 35, 387-400 (1995).
- Kandori, H. Role of internal water molecules in bacteriorhodopsin. Biochim. Biophys. Acta. 1460, 177-191 (2000).
- Zscherp, C., Barth, A. Reaction-induced infrared difference spectroscopy for the study of protein reaction mechanisms. Biochemistry. 40, 1875-1883 (2001).
- Nyquist, R. M., Heitbrink, D., Bolwien, C., Gennis, R. B., Heberle, J. Direct observation of protonation reactions during the catalytic cycle of cytochrome c oxidase. Proc. Natl. Acad. Sci. U. S. A. 100, 8715-8720 (2003).
- Rich, P. R., Iwaki, M. Methods to probe protein transitions with ATR infrared spectroscopy. Mol. Biosyst. 3, 398-407 (2007).
- Noguchi, T. Light-induced FTIR difference spectroscopy as a powerful tool toward understanding the molecular mechanism of photosynthetic oxygen evolution. Photosynth. Res. 91, 59-69 (2007).
- Granell, M., Leon, X., Leblanc, G., Padros, E., Lorenz-Fonfria, V. A. Structural insights into the activation mechanism of melibiose permease by sodium binding. Proc. Natl. Acad. Sci. U. S. A. 107, 22078-22083 (2010).
- Schuler, B., Eaton, W. A. Protein folding studied by single-molecule FRET. Curr. Opin. Struct. Biol. 18, 16-26 (2008).
- Kapanidis, A. N., Strick, T. Biology, one molecule at a time. Trends Biochem. Sci. 34, 234-243 (2009).
- Uhmann, W., Becker, A., Taran, C., Siebert, F. Time-resolved FT-IR absorption spectroscopy using a step-scan interferometer. Appl. Spectrosc. 45, 390-397 (1991).
- Dioumaev, A. K., Braiman, M. S. Two bathointermediates of the bacteriorhodopsin photocycle, distringuished by nanosecond time-resolved FTIR spectroscopy at room temperature. J. Phys. Chem. B. 101, 1655-1662 (1997).
- Rammelsberg, R., Huhn, G., Lübben, M., Gerwert, K. Bacteriorhodopsin's intramolecular proton-release pathway consists of a hydrogen-bonded network. Biochemistry. 37, 5001-5009 (1998).
- Rödig, C., Siebert, F. Errors and artifacts in time-resolved step-scan FT-IR spectroscopy. Appl. Spectrosc. 53, 893-901 (1999).
- Brudler, R., Rammelsberg, R., Woo, T. T., Getzoff, E. D., Gerwert, K. Structure of the I1 early intermediate of photoactive yellow protein by FTIR spectroscopy. Nat. Struct. Biol. 8, 265-270 (2001).
- Remy, A., Gerwert, K. Coupling of light-induced electron transfer to proton uptake in photosynthesis. Nat. Struct. Biol. 10, 637-644 (2003).
- Lórenz-Fonfría, V. A., Furutani, Y., Kandori, H. Active internal waters in the bacteriorhodopsin photocycle. A comparative study of the L and M intermediates at room and cryogenic temperatures by infrared spectroscopy. Biochemistry. 47, 4071-4081 (2008).
- Griffiths, P. R., de Haseth, J. A. Fourier Transform Infrared Spectrometry. , John Wiley and Sons. (1986).
- Smith, G. D., Palmer, R. A. Handbook of vibrational spectroscopy. , John Wiley & Sons Ltd. (2002).
- Rammelsberg, R., Heßling, B., Chorongiewski, H., Gerwert, K. Molecular reaction mechanisms of protein monitored by nanosecond step-scan FT-IR difference spectroscopy. Appl. Spectrosc. 51, 558-562 (1997).
- Rödig, C., Chizhov, I., Weidlich, O., Siebert, F. Time-resolved step-scan Fourier transform infrared spectroscopy reveals differences between early and late M intermediates of bacteriorhodopsin. Biophys. J. 76, 2687-2701 (1999).
- Bromberg, S. E., et al. The mechanism of a C-H bond activation reaction in room-temperature alkane solution. Science. 278, 260-263 (1997).
- Rödig, C., Siebert, F. Handbook of vibrational spectroscopy. , John Wiley & Sons. (2002).
- Braiman, M. S., Xiao, Y. Vibrational Spectroscopy of Biological and Polymeric Materials. , CRC Press. 353-418 (2006).
- Gerwert, K. Handbook of vibrational spectroscopy. , John Wiley & Sons Ltd. (2002).
- Koutsoupakis, C., Pinakoulaki, E., Stavrakis, S., Daskalakis, V., Varotsis, C. Time-resolved step-scan Fourier transform infrared investigation of heme-copper oxidases: implications for O2 input and H2O/H+ output channels. Biochim. Biophys. Acta. 1655, 347-352 (2004).
- Radu, I., Schleeger, M., Bolwien, C., Heberle, J. Time-resolved methods in biophysics. 10. Time-resolved FT-IR difference spectroscopy and the application to membrane proteins. Photochem. Photobiol. Sci. 8, 1517-1528 (2009).
- Haupts, U., Tittor, J., Oesterhelt, D. Closing in on bacteriorhodopsin: progress in understanding the molecule. Annu. Rev. Biophys. Biomol. Struct. 28, 367-399 (1999).
- Lanyi, J. K. Bacteriorhodopsin. Annu. Rev. Physiol. 66, 665-688 (2004).
- Heberle, J., Fitter, J., Sass, H. J., Büldt, G. Bacteriorhodopsin: the functional details of a molecular machine are being resolved. Biophys. Chem. 85, 229-248 (2000).
- Nagel, G., et al. Channelrhodopsin-1: a light-gated proton channel in green algae. Science. 296, 2395-2398 (2002).
- Nagel, G., et al. Channelrhodopsin-2, a directly light-gated cation-selective membrane channel. Proc. Natl. Acad. Sci U. S. A. 100, 13940-13945 (2003).
- Zhang, F., et al. The microbial opsin family of optogenetic tools. Cell. 147, 1446-1457 (2011).
- Fenno, L., Yizhar, O., Deisseroth, K. The development and application of optogenetics. Annu. Rev. Neurosci. 34, 389-412 (2011).
- Feldbauer, K., et al. Channelrhodopsin-2 is a leaky proton pump. Proc. Natl. Acad. Sci. U. S. A. 106, 12317-12322 (2009).
- Nack, M., et al. Kinetics of proton release and uptake by channelrhodopsin-2. FEBS Lett. 586, 1344-1348 (2012).
- Lórenz-Fonfría, V. A., et al. Transient protonation changes in channelrhodopsin-2 and their relevance to channel gating. Proc. Natl. Acad. Sci. U. S. A. 110, (2013).
- Heberle, J., Zscherp, C. ATR/FT-IR difference spectroscopy of biological matter with microsecond time resolution. Appl. Spectrosc. 50, 588-596 (1996).
- Nyquist, R. M., Ataka, K., Heberle, J. The molecular mechanism of membrane proteins probed by evanescent infrared waves. Chembiochem. 5, 431-436 (2004).
- Gerwert, K., Freier, E., Wolf, S. The role of protein-bound water molecules in microbial rhodopsins. Biochim. Biophys. Acta. 1837, 606-613 (2014).
- Lórenz-Fonfría, V. A., Heberle, J. Channelrhodopsin unchained: Structure and mechanism of a light-gated cation channel. Biochim. Biophys. Acta. 1837, 626-642 (2014).
- Carter, R. O., Lindsay, N. E., Beduhn, D. A solution to base-line uncertainty due to MCT detector nonlinearity in FT-IR. Appl. Spectrosc. 44, 1147-1151 (1990).
- Noguchi, T., Sugiura, M. Flash-induced FTIR difference spectra of the water oxidizing complex in moderately hydrated photosystem II core films: effect of hydration extent on S-state transitions. Biochemistry. 41, 2322-2330 (2002).
- Henry, E. R., Hofrichter, J. Singular value decomposition: application to analysis of experimental data. Methods Enzymol. 210, 129-192 (1992).
- Hendler, R. W., Shrager, R. I. Deconvolutions based on singular value decomposition and the pseudoinverse: a guide for beginners. J. Biochem. Biophys. Methods. 28, 1-33 (1994).
- Lórenz-Fonfría, V. A., Kandori, H. Spectroscopic and kinetic evidence on how bacteriorhodopsin accomplishes vectorial proton transport under functional conditions. J. Am. Chem. Soc. 131, 5891-5901 (2009).
- Fischer, H., Polikarpov, I., Craievich, A. F. Average protein density is a molecular-weight-dependent function. Protein Sci. 13, 2825-2828 (2004).
- Nagle, J. F., Tristram-Nagle, S. Structure of lipid bilayers. Biochim. Biophys. Acta. 1469, 159-195 (2000).
- Lee, A. G. Lipid-protein interactions in biological membranes: a structural perspective. Biochim. Biophys. Acta. 1612, 1-40 (2003).
- Goormaghtigh, E., Raussens, V., Ruysschaert, J. M. Attenuated total reflection infrared spectroscopy of proteins and lipids in biological membranes. Biochim. Biophys. Acta. 1422, 105-185 (1999).
- Lórenz-Fonfría, V. A., León, X., Padrós, E. Studying substrate binding to reconstituted secondary transporters by attenuated total reflection infrared difference spectroscopy. Methods Mol. Biol. 914, 107-126 (2012).
- Bertie, J. E., Lan, Z. D. Infrared intensities of liquids XX: the intensity of the OH stretching band of liquid water revisited, and the best current values of the optical constants of H2O(l) at 25 oC between 15,000 and 1 cm-1. Appl. Spectrosc. 50, 1047-1057 (1996).
- Lórenz, V. A., et al. The secondary structure of the inhibited mitochondrial ADP/ATP transporter from yeast analyzed by FTIR spectroscopy. Biochemistry. 40, 8821-8833 (2001).
- Heßling, B., Souvignier, G., Gerwert, K. A model-independent approach to assigning bacteriorhodopsin's intramolecular reactions to photocycle intermediates. Biophys. J. 65, 1929-1941 (1993).
- Braiman, M. S., et al. Vibrational spectroscopy of bacteriorhodopsin mutants: light-driven proton transport involves protonation changes of aspartic acid residues 85, 96, and 212. 27, 8516-8520 (1988).
- Gerwert, K., Souvignier, G., Hess, B. Simultaneous monitoring of light-induced changes in protein side-group protonation, chromophore isomerization, and backbone motion of bacteriorhodopsin by time-resolved Fourier-transform infrared spectroscopy. Proc. Natl. Acad. Sci. U. S. A. 87, 9774-9778 (1990).
- Gerwert, K., Hess, B., Soppa, J., Oesterhelt, D. Role of aspartate-96 in proton translocation by bacteriorhodopsin. Proc. Natl. Acad. Sci. U. S. A. 86, 4943-4947 (1989).
- Lórenz-Fonfría, V. A., Kandori, H., Padrós, E. Probing specific molecular processes and intermediates by time-resolved Fourier transform infrared spectroscopy: application to the bacteriorhodopsin photocycle. J. Phys. Chem. B. 115, 7972-7985 (2011).
- Ellis, R. J., Minton, A. P. Cell biology: join the crowd. Nature. 425, 27-28 (2003).
- Furutani, Y., Kimura, T., Okamoto, K. Development of a rapid Buffer-exchange system for time-resolved ATR-FTIR spectroscopy with the step-scan mode. Biophysics. 9, 123-129 (2013).
- Rammelsberg, R., Boulas, S., Chorongiewski, H., Gerwert, K. Set-up for time-resolved step-scan FTIR spectroscopy of noncyclic reactions. Vib. Spectrosc. 19, 143-149 (1999).
- Rödig, C., Siebert, F. Monitoring fast reactions of slow cycling systems with time-resolved FTIR spectroscopy. Vib. Spectrosc. 19, 271-276 (1999).
- Rödig, C., Siebert, F. Distortion of the L→M transition in the photocycle of the bacteriorhodopsin mutant D96N: a time-resolved step-scan FTIR investigation. FEBS Lett. 445, 14-18 (1999).
Reprints and Permissions
Request permission to reuse the text or figures of this JoVE article
Request Permission