A novel Upflow Anaerobic Solid State (UASS) reactor was used for biogas production from fibrous feedstock. Digestate from UASS reactor was hydrothermally carbonized into HTC biochar in a pressurized batch reactor. The integration of the two bioenergy concepts was applied in this study to increase overall bioenergy production.
Method Article
Evaluation of Integrated Anaerobic Digestion and Hydrothermal Carbonization for Bioenergy Production
In This Article
Summary
Abstract
Lignocellulosic biomass is one of the most abundant yet underutilized renewable energy resources. Both anaerobic digestion (AD) and hydrothermal carbonization (HTC) are promising technologies for bioenergy production from biomass in terms of biogas and HTC biochar, respectively. In this study, the combination of AD and HTC is proposed to increase overall bioenergy production. Wheat straw was anaerobically digested in a novel upflow anaerobic solid state reactor (UASS) in both mesophilic (37 °C) and thermophilic (55 °C) conditions. Wet digested from thermophilic AD was hydrothermally carbonized at 230 °C for 6 hr for HTC biochar production. At thermophilic temperature, the UASS system yields an average of 165 LCH4/kgVS (VS: volatile solids) and 121 L CH4/kgVS at mesophilic AD over the continuous operation of 200 days. Meanwhile, 43.4 g of HTC biochar with 29.6 MJ/kgdry_biochar was obtained from HTC of 1 kg digestate (dry basis) from mesophilic AD. The combination of AD and HTC, in this particular set of experiment yield 13.2 MJ of energy per 1 kg of dry wheat straw, which is at least 20% higher than HTC alone and 60.2% higher than AD only.
Introduction
Finding renewable and sustainable energy sources are major concerns in the world’s energy sector. Recently, the United Nations reported that up to 77% of the world’s energy in 2050 will be expected from renewable sources1. Lignocellulosic biomass such as straw, grasses, rice hulls, corn cobs have no conflicts with the food versus fuel issue. Moreover, biomass is probably the only renewable energy source with structural carbon, compared to other renewable energy sources such as wind, solar, and water2. However, handling characteristics, lower bulk density, high ash content, and lower energy content hinder the use of lignocellulosic biomass for energy production2.
Anaerobic digestion (AD) is one of the prime examples of producing bioenergy from waste biomass.3 In general, there are four degradation steps involve in anaerobic digestion as shown in Figure 14. In first three consecutive steps, the polysaccharides of the biomass are converted into organic acids. In the final step, methanogenic organisms produce biomethane. Traditional AD is a time and energy consuming process. The continuous stirring reduces overall economics of AD, especially for AD of lignocellulosic biomass. A novel upflow anaerobic solid-state (UASS) reactor has the potential to overcome the stated shortcomings (Figure 2)4. Spontaneous solid-liquid separations is one of the significant advantages of UASS, since the designed facilitates biogas bubbles to lift unreacted solid residues upwards5. This eliminate the use of stirrer and therefore reduces the consumption of on-site power. Moreover, liquid circulation ensures distribution of microorganisms and metabolites throughout the reactor as well5. Compared to solid biofuels, biogas is easier to handle, and leaves little or no residue. In fact, the specific energy density of biogas is several times higher raw biomass4. However, AD favors simple polysaccharides like starch, fatty acids, and hemicellulose1. As a result, cellulose, and lignin, major portion of fibrous lignocellulosic biomass like wheat straw, remains as a solid digestate after AD5. Although, biogas production varies from the feedstock, type of microorganisms, reaction temperature, and reaction time, a huge amount of digestate is usually produced.
While biogas is used for energy, digestates (up to 90% water) are usually stored in a fermentation residue-depot to collect remaining methane emissions. Afterwards these are dried and spread on the cropland to improve soil fertility and water retention capacity. High inorganic content often hinder digestate directly for fuel, as high amounts of slag might corrode the equipment6. Hydrothermal carbonization (HTC) is a thermochemical treatment process especially designed for wet feedstock, where biomass (with 80-90% water) is heated up to 200-260 °C at water saturation pressure and hold for 0.5-6 h (Figure 3)7,8.Subcritical water has the maximum ionic product at 200-260 °C, which means water under these conditions is reactive and behaves as a mild acid and a mild base simultaneously9. Hemicellulose, along with other extractives, degrade around 180-200 °C, while cellulose reacts around 220-230 °C, and lignin reacts at relatively higher temperature (>250 oC), but much slower than cellulose and hemicellulose10. Due to significant dehydration and decarboxylation, HTC results solid product named HTC biochar, with mass yield (dry HTC biochar/dry feed) of 40-80%, liquor containing carboxylic acids, furan derivatives, phenolic substances, and sugar monomers, and 5-10% CO2 rich gaseous product11. During HTC, oxygen containing volatile substances are significantly reduced and thus leave a carbon-rich solid. HTC biochar is also stable, hydrophobic, and friable compare to raw moist feedstock12,13. Due to its hydrophobic characteristics, dewateribility of HTC biochar increases several times compared to raw digestate or even raw biomass.14-18 Moreover, HTC biochar has fuel values similar to lignite coal16,17. However, cellulose and lignin partially degrade in the HTC environment18.
Now hemicellulose and cellulose in the biomass contribute to biogas during AD, while cellulose and lignin mostly contribute to solid HTC biochar4,5. Thus, the combination of AD-HTC can potentially increase overall bioenergy yield. Hoffmann et al. simulated a similar combination but using AD and HTL (hydrothermal liquefaction) rather than AD-HTC19. HTL is a common method of liquefying biomass fraction and liquid product has high fuel value [43.1 MJ/kg]. However, HTL requires very high pressure (250 bar) compare to HTC (10-50 bar), which implies a high installation and operation costs than HTC. Again, the combination sequence of AD and HTC can be questioned as Wirth et al. recently reported AD of HTC process liquid20. However, an effective AD depends on the sugar concentration in the feedstocks. Sugars in HTC process liquid, produced during hydrolysis, often degrade rapidly under subcritical water. That’s why AD before HTC is more favorable in terms of bioenergy. However, AD of HTC process liquid can produce additional bioenergy, in which case, the combination sequence would be AD-HTC-AD.
The aim of the work was to evaluate the integration of AD and HTC processes for bioenergy production (Figure 3). The biogas production potential for thermophilic and mesophilic AD from UASS reactor was evaluated at a continuous operation of more than 200 days. Subsequently, HTC biochar production from digestate was also studied. The mass and energy balance of the cascaded AD-HTC was carried out and compared with the individual processes.
Protocol
1. Anaerobic Digestion of Wheat Straw
Note: For anaerobic digestion in 39 L UASS reactors, use 5-65 mm long raw wheat straw chops as feed. The organic dry matter content of the feedstock in this particular experiment was 85.9% and crude fiber fraction was 46.3%. The UASS reactors are made of stainless steel with an inspection window made of acrylic glass. Two 30 L anaerobic filter (AF) are combined with each 39 L UASS reactor. The AFs are built of transparent acrylic glass. The schematic of the reactor systems are shown in Figure 2 and architectural design described elsewhere4. Details on inoculating and starting up the reactors are given elsewhere5.
- Fill each AF with 325 barrel-shaped polyethylene biofilm carriers.
Note: The biofilm carriers used have a surface area of 305 m2/m3. - Set the water pumps for process liquid circulation in both mesophilic and thermophilic reactors for a flow rate of 1.15 L/hr.
- Set heating baths to the desired reactor´s temperature level, 37 °C for the mesophilic and 55 °C for the thermophilic reactor.
- For daily feeding of the UASS reactors, weigh 120 gFM of wheat straw (= 99.5 gVS) for each reactor to achieve an organic loading rate of 2.5 gVS/L·day.
- Open UASS´ feeding tube and remove the stamp.
- Pour wheat straw into the diagonal feeding tube and push it into the reactor´s bottom with the help of the feeding stamp. From there on, the straw will float up against a sieve and form the solid-state bed.
- Clean the sealing surface to make sure, it is gastight and then close the feeding tube.
- The pumps will run continuously, conveying 1.2 L/hr process liquor through the reactor system (UASS and AF).
- Measure biogas flow continuously using drum-type gas meters and store in a 20 L gas bag.
Note: Make an exit from the gas bag to the biogas analyzer. In the biogas analyzer, CH4, H2S, O2, CO2, and H2 are measured. First the biogas has to pass 3 different filters to remove the moisture, and other toxic compounds that are harmful for the detector. The analyzer needs to be calibrated once in a week for accurate biogas composition. - Measure biogas composition regularly using an industrial biogas analyzer. Note: The biogas analyzer can only measure the biogas when the biogas bag is at least half full. For measuring the biogas composition, the valve at the gas bag needs to be opened and wait for the steady biogas composition (it takes about 20-30 sec).
- For process control, measure pH and temperature online using installed pH meter and thermometer.
- Remove approximately 3 kg of digestate (80-90% wet) once a week, which gives a solids retention time (SRT) of 2-3 weeks. Use this digestate as the feed for HTC process. The biogas produced afterwards is sufficient to extrude any air and establish anaerobic conditions within few hours.
- Analyze process liquor and digestate on a weekly basis for their chemical properties (pH, EC, TS, VS, fatty acids, CHNS, ammonia, trace elements, and crude fiber).
2. Hydrothermal Carbonization of Wheat Straw Digestate
Note: For hydrothermal carbonization of digestate from step 1, an 18 L batch stirred reactor is used. The controlling and timing of process is effected via reactor controller 4848 and the software SpecView 32 849, running on a computer. In the program, the reactor temperature, heating jacket temperature, pressure, and stirring rate can be shown. Moreover, the program for the process parameters (start temperature, set temperature, heating rate, stirring rate) can be set for each HTC experiments.
- Weigh 2.5 kg of straw digestate using a balance with the accuracy of 0.1 g and transfer to the reactor vessel.
- Use the same balance to measure 10 kg makeup water, and pour it into the reactor vessel as well. This will maintain digestate, water ratio 1:4.
- Before pneumatically closing, stir manually the reactor content to prevent blockage of propeller stirrer. Close the reactor and secure it by crosswise tightening the bolts with a force of 50 Nm.
- Set the reaction by the following ramp soak:
- Reach the start temperature of 30 °C in 15 min from room temperature.
- Set the heating time for reaction temperature of 230 °C is 100 min.
- Hold the final reaction temperature for 6 hr.
- After 6 hr of holding time, cool the reactor 15 hr from 230 °C to room temperature.
- Stir the reactor content at 30 rpm throughout the complete HTC process.
- Switch off the stirrer after the cooling phase and purge the gas in a 20 L gas bag.
- Make sure the gas passes through a condensate trap as well as an activated carbon filter.
- Store the gas for further analysis.
- After gas sampling, drain the slurry from the vessel to a container through a high temperature, high pressure ball valve and then filter it through a mesh with a pore size of around 0.5 mm.
- Collect the fluid and tare the produced HTC biochar to determine the amount of HTC-produced char compared to feedstock.
3. Elemental Analysis of Raw, Digestate, and HTC Biochar of Wheat Straw
Note: For any solid fuel analysis, an elemental analyzer or CHONS analyzer is often used. The elemental composition of atomic carbon, hydrogen, oxygen, nitrogen, and sulfur can be obtained from this analysis. From CHONS, one can estimate the higher heating value or energy value of the fuel. Moreover, the atomic sulfur content will also indicate the quality of the fuel. In this study, an elemental analyzer will be used to determine the fuel value of HTC biochar, raw wheat straw and digestate. As the analyzer only allows a very small sample size, analyze each sample at least three times for better reproducibility.
- In a sample pan (tin, 6 x 6 x 12 mm), weigh 30 mg of tungsten(VI) oxide using the specific balance in the elemental package. Note: The precision of such a balance is usually 1 µg. Tungsten(VI) oxide works as a catalyst in the elemental analyzer.
- Weigh 5-10 mg of dry sample and put into the same sample pan, mix it, and wrap it. The wrapped sample pan size should be around 2 x 2 x 5 mm3.
- Place the samples in the autosampler. Note the position of each sample and use sulfonic acid in this elemental analysis as a reference
- Start the Vario software in the computer connected to the Elemental analyzer, define the conditions, samples gas flow, temperatures of the 2 ovens (the 2 ovens are at 1,150 and 850 °C, respectively). Then, define the sample names according to autosampling positions. Start the program. The machine works automatically, performs the analysis, and stores the results in the computer.
Note: Elemental CHNS are the output of the elemental analyzer and usually are reported directly on the computer screen.
Results
Anaerobic digestion
The biogas experiments revealed that the UASS system is capable of utilizing 38% and 50% of the methane forming potential at mesophilic (37 °C) and thermophilic (55 °C) operation, respectively. At thermophilic AD, the UASS system yields an average of 165 LCH4/kgVS (VS: volatile solids) and 121 LCH4/kgVS at mesophilic AD for a 200 days of continuous operation (Figure 4). Those performance values have been calculated from the quantitative and qualitative analysis of the biogas related to the dry feedstock basis.
The biomethane potential for the wheat straw was determined (following VDI Guideline 4630) to be 304.3 LCH4/kgVS for thermophilic and 244.2 LCH4/kgVS for mesophilic operation, respectively, and presented in Figure 5 21. In terms of quality, biogas produced by UASS contained between 41% and 61% of methane (Figure 5).
HTC of digestate
Figure 6 shows dry straw, dry digestate derived from straw by AD, and HTC biochar derived from dry digestate by HTC. Dry digestate looks similar to the dry straw, which is only a bit darker in color. For this work, digestate from thermophilic conditions were considered for HTC. As shown in Table 1, 63% of the total mass remains in the digestate (Table 1). Dry HTC biochar is lighter than dry raw straw, probably due to the degradation of monomers and simple polymers by thermophilic microorganisms during AD.
Figure 7 shows the hydrophobic behavior, and softness of HTC biochar. During HTC, the fibrous crystalline structures are destroyed and produce a soft amorphous carbon-rich HTC biochar16,17,28. It can be seen from Table 1 that the mass yield of digestate and raw straw derived HTC biochar are 43.4%, and 38.3%, respectively. The solid product, HTC biochar is very hydrophobic12; it can stay in contact with water for a prolonged time13. Also it is very soft, as it barely requires any pressure to pulverize it. For coal-to-power industry, maintaining softness of the feedstock is very important, as this can eliminate the expansive pulverizing steps.
Elemental analysis
From elemental compositions presented in Table 1, it can be seen that elemental carbon and hydrogen remain the same in the solid throughout the anaerobic digestion. Elemental carbon increases and hydrogen decreases during HTC. Most of the elemental nitrogen remains in the solid since the elemental nitrogen content is increased during both digestion and HTC processes. Since sulfur in wheat straw is trace, the concentration of elemental sulfur is not presented in the results. Elemental oxygen content was calculated by subtracting C, H, and N from 100% and also presented in Table 1, assuming the feedstock consists of CHONS only. The oxygen concentration decreased dramatically during HTC, while it remains similar during digestion.

Figure 1. Basic concept and steps of anaerobic digestion. This figure describes the basic concepts of anaerobic digestion. In this figure, four general steps (hydrolysis, acedogenesis, acetogenesis, and methanogenesis) of anaerobic digestion are presented
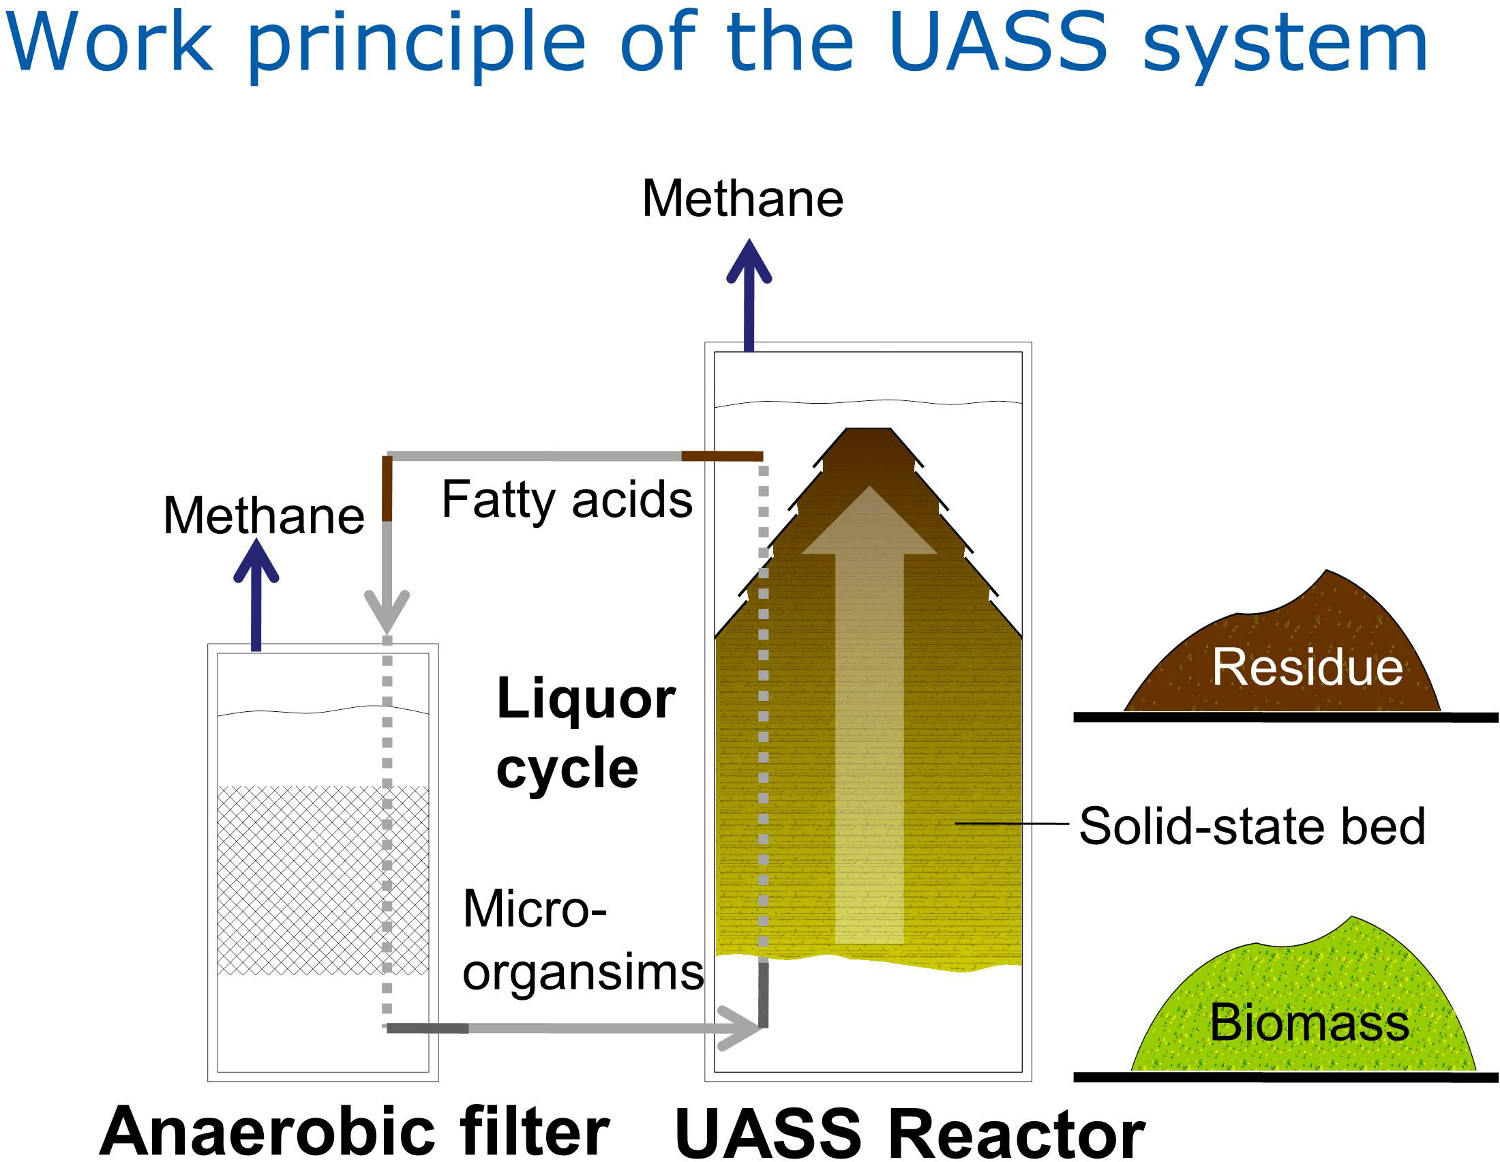
Figure 2: Schematic diagram of the laboratory scale UASS reactor for anaerobic digestion. This is the schematic of UASS reactor system. Here the UASS reactor and anaerobic filter (AF) are shown connected by a liquid stream, where fatty acids produced in the UASS reactor come to AF and methane is produced. From the bottom of the AF, another liquid stream is drawn to UASS, where microorganisms are going from AF to UASS reactor.
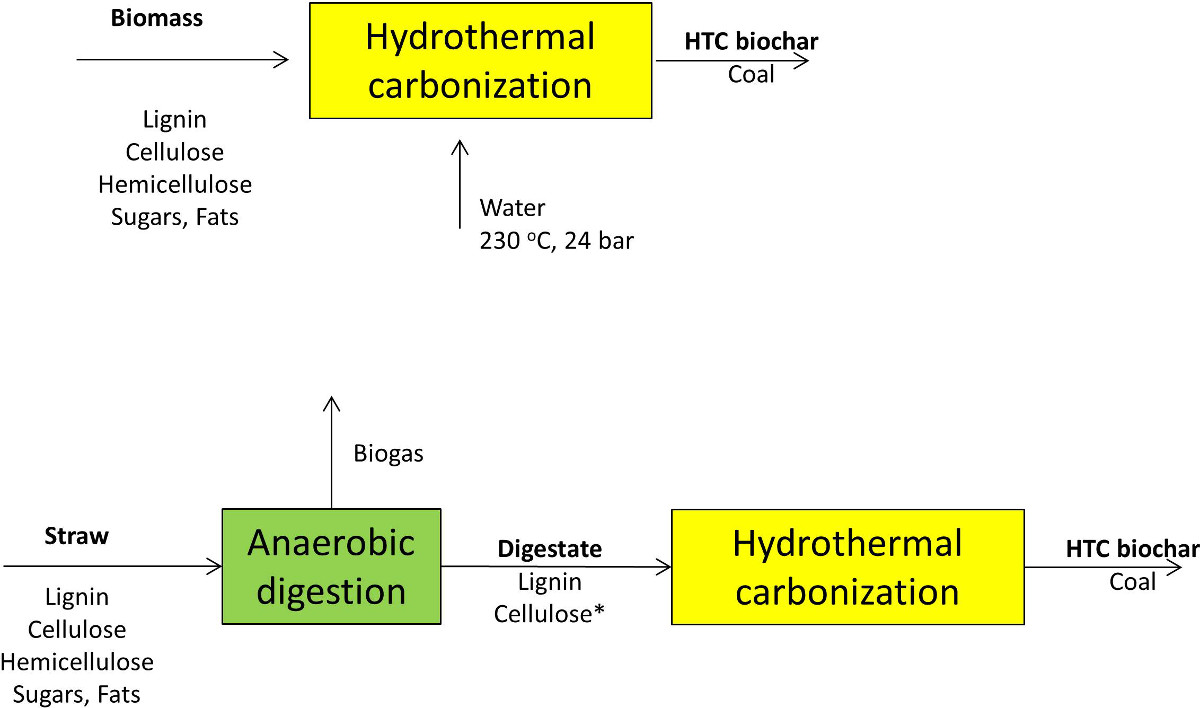
Figure 3. (top) Concept of HTC of lignocellulosic biomass, (bottom) integration concept of anaerobic digestion and HTC *cellulose will be partially reacted24 . In this block diagram, it can be seen that different fiber components come into contact with subcritical water and are converted into HTC biochar (Coal type).
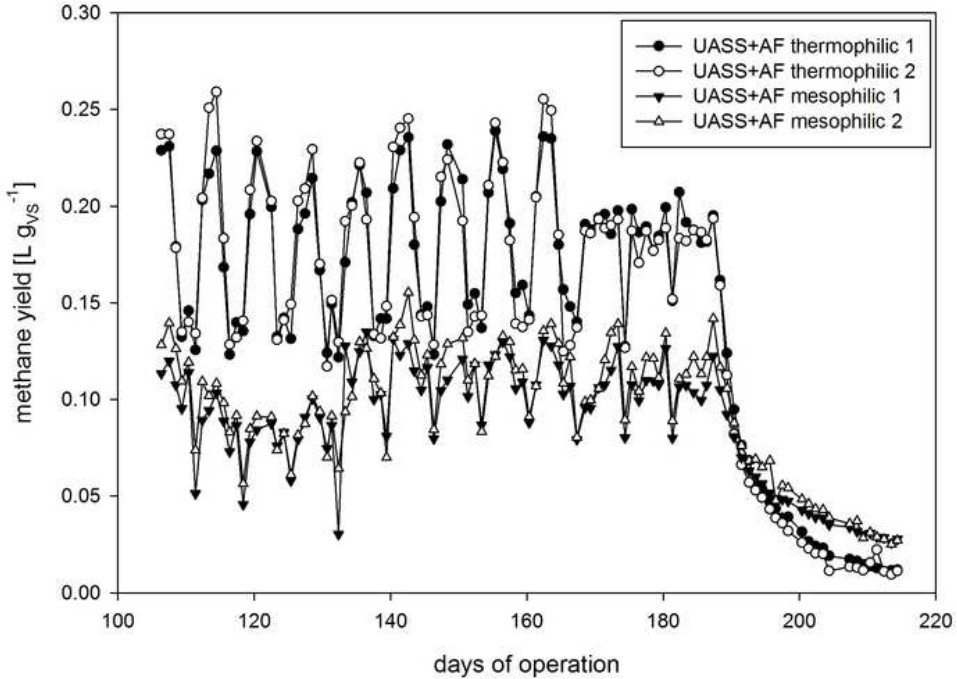
Figure 4. Methane production from UASS reactor in both thermophilic and mesophilic conditions with the anaerobic filter. These are experimental results of UASS reactor for 210 days of operation for both thermophilic and mesophilic conditions. The X-axis is days of operation, while the Y-axis is the methane yield (LCH4/kgVS) compared to volatile solid (VS).
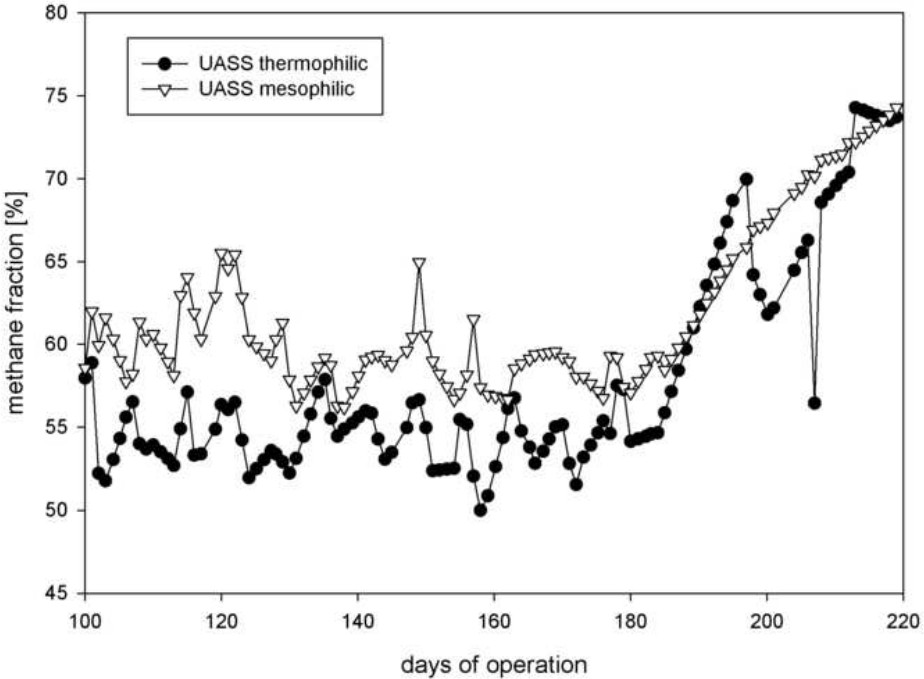
Figure 5. Methane fraction of biogas from UASS reactor in both thermophilic and mesophilic conditions. These are experimental results of UASS reactor for 210 days of operation under both thermophilic and mesophilic conditions. The X-axis is days of operation, while Y-axis is the methane fraction (%) in the biogas. Values given are averages from duplicates.
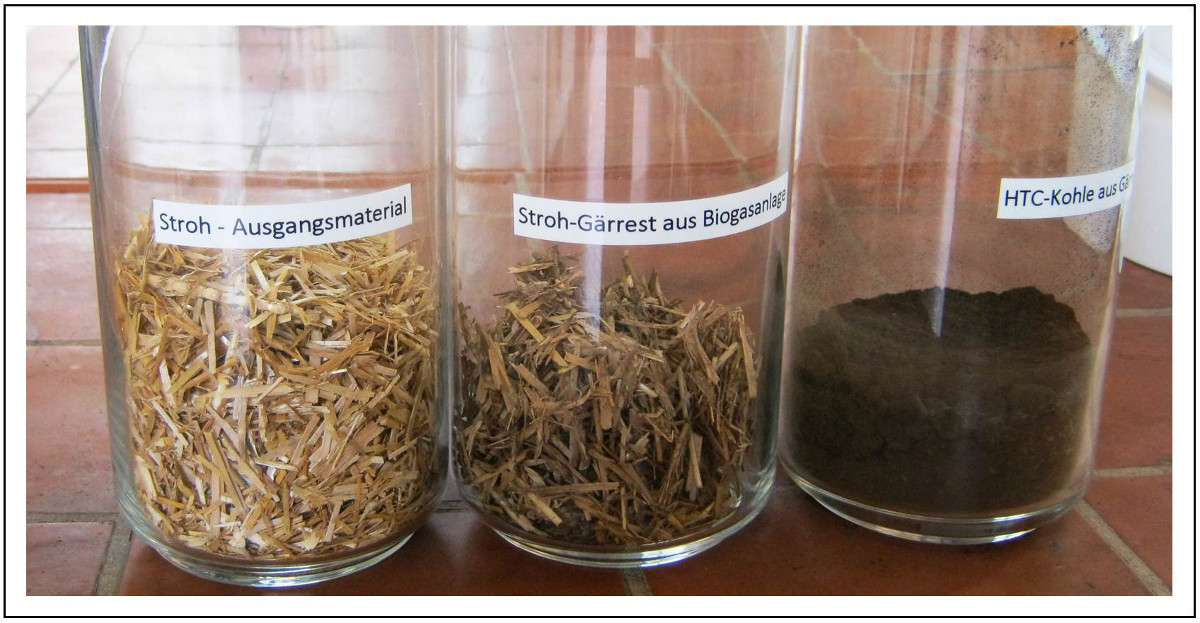
Figure 6. (Left to right) Dry wheat straw, dry wheat straw digestate, and HTC biochar of wheat straw digestate. This is the real time image of the different states of wheat straw. Here in this figure, the effect of anaerobic digestion (AD) and HTC can be visible. The fiber structure is still visible in the digestate, while it becomes powdery after HTC.
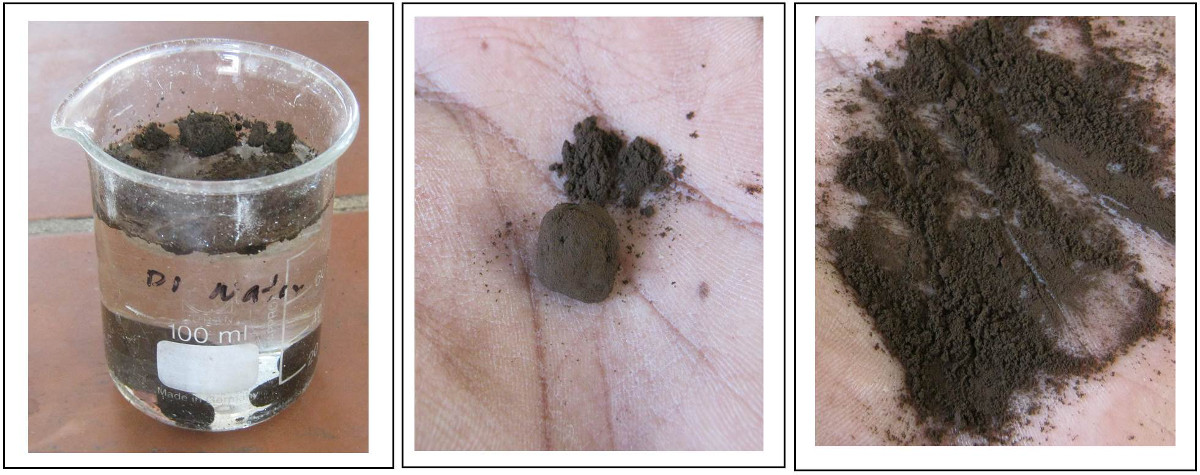
Figure 7. Hydrophobicity of the HTC biochar (left), friability of the HTC biochar (right). This is again the real time image of hydrophobicity and friability of HTC biochar. In the first image, HTC biochar is sunk under the water, while the next two images the condition of biochar before and after hard-crushing are shown.
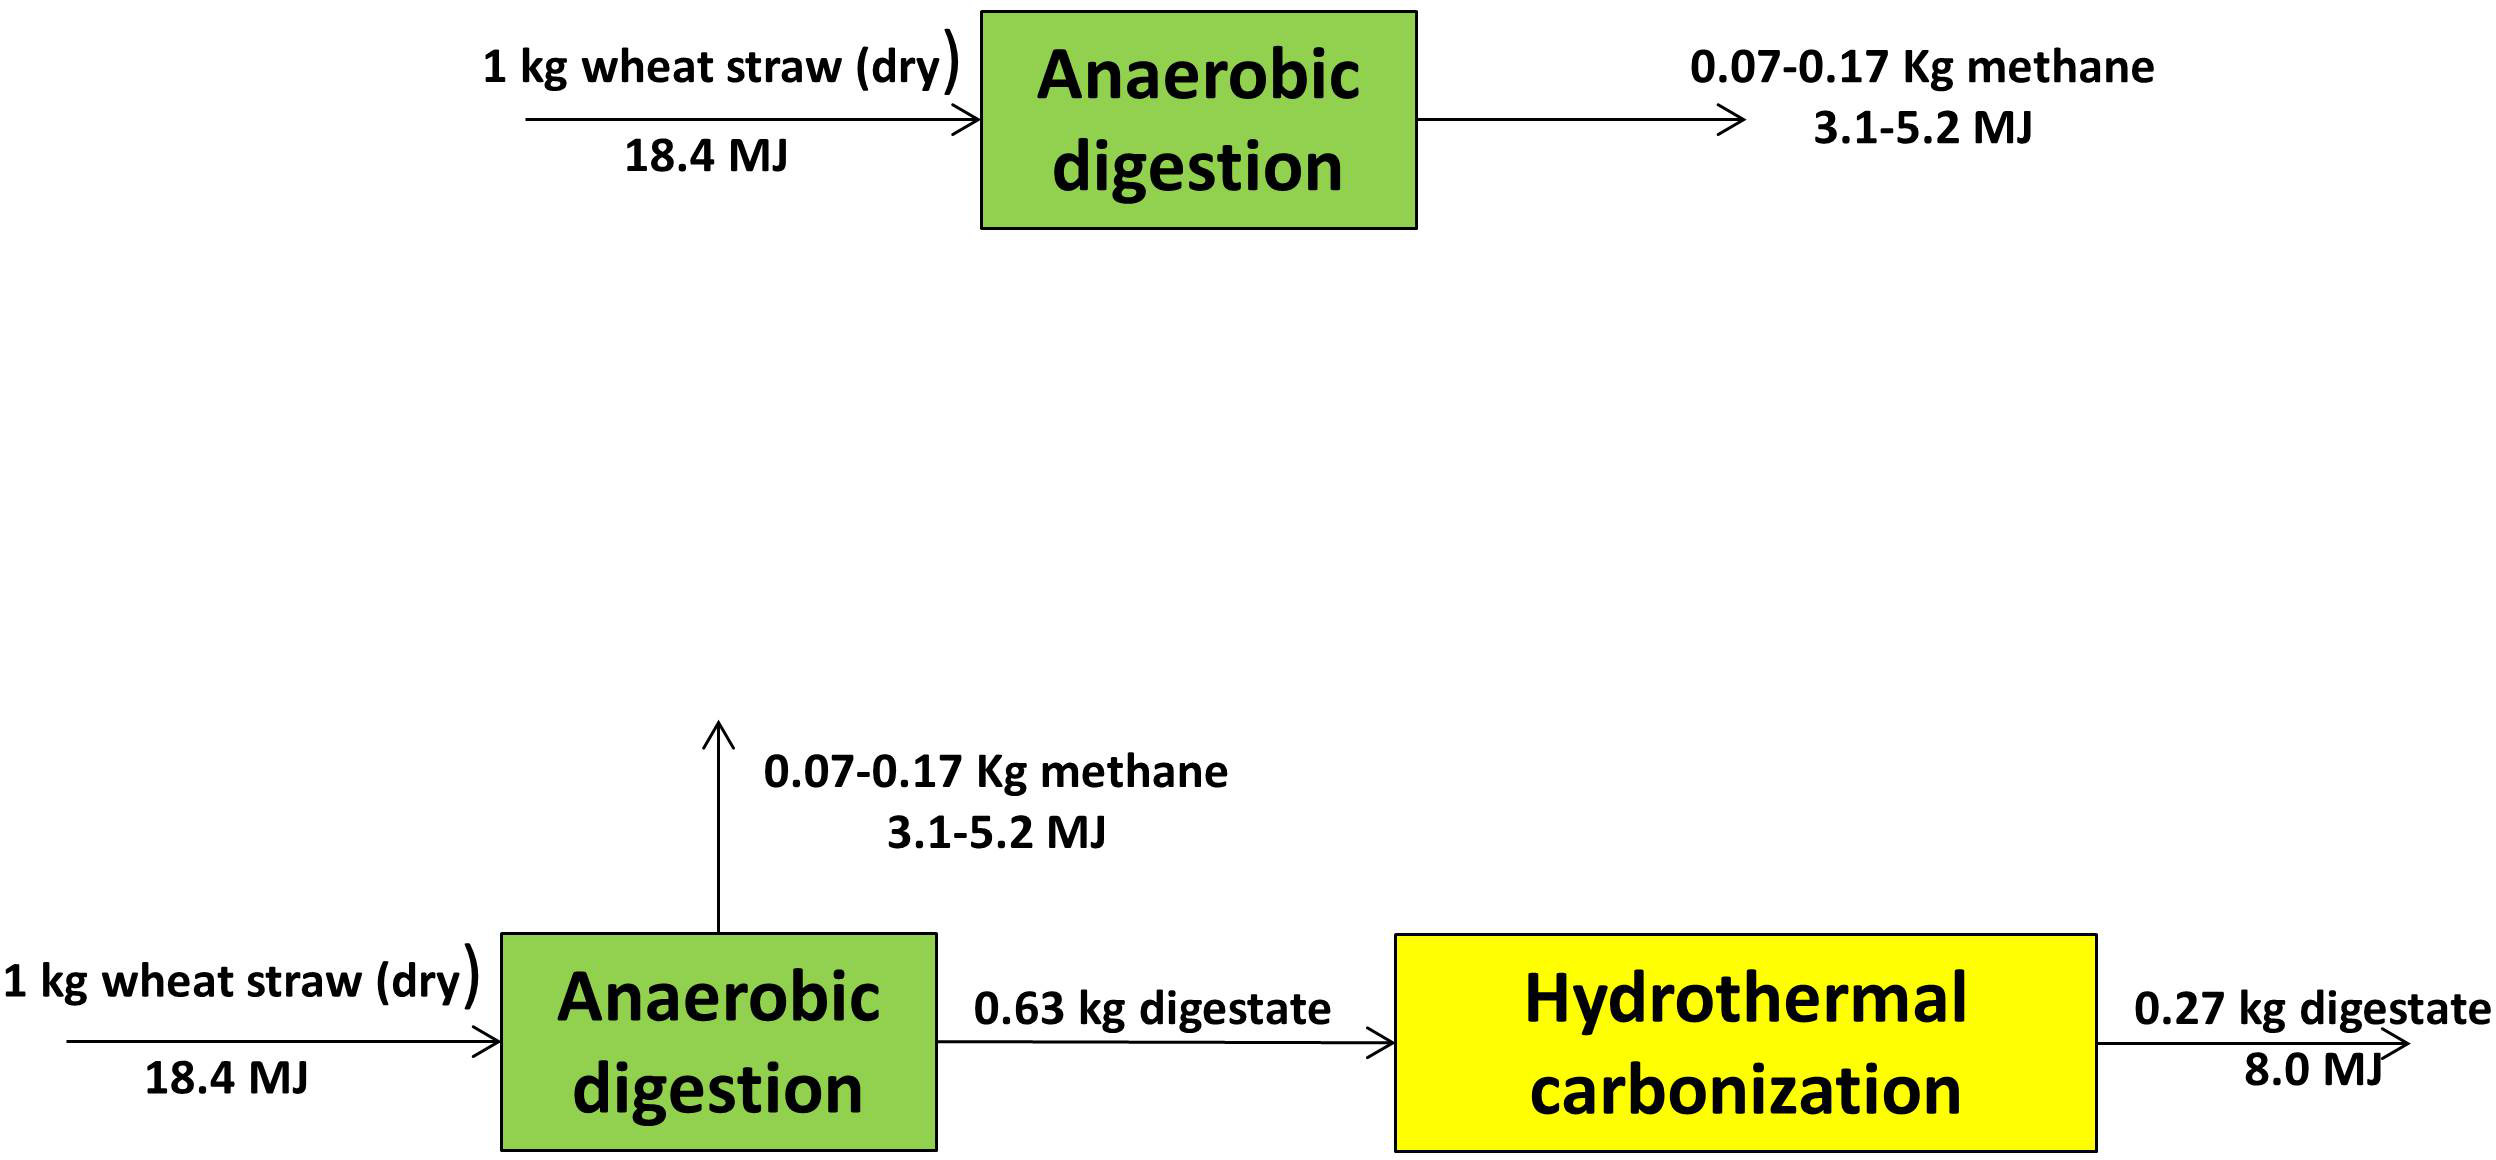
Figure 8. (top) Bioenergy potential by anaerobic digestion (AD) from 1 kg of raw wheat straw and (bottom) bioenergy potential by integrating AD-HTC from 1 kg of dry wheat straw. This is a figure to evaluate the necessity of combination concepts. The block diagram shows how much energy is extracting by AD and HTC from the feedstock.

Table 1. Elemental analysis, HHV, mass yield, and fiber analysis of raw wheat straw, digestate (thermophilic), and corresponding HTC biochar. HHV is calculated from CHNS composition as shown in literature18,24. Table 1 is the experimental results of elemental analysis, and mass yield after AD and HTC. Lignin, cellulose and hemicellulose are measured by van Soest fiber analysis [12]. Note: n.a is not analyzed. Please click here to view a larger version of this table.
Discussion
UASS reactors are capable to mitigate the shortcomings discussed in introduction. However, there is much room for improvement. Feeding system and digestate withdrawing are still manual. The UASS system faces problems handling feedstocks larger than 60 mm. The system works better with fibrous feedstocks as they float across the liquid, but other feedstocks like animal manure and sludge might not favor the UASS system. The UASS system is designed in such a way that the process liquor circulates from reactor to AF to the reactor again. However, even 2-5% solid in the circulating liquid was proven to be problematic, as they deposit in the AF or block the pipe entrance and hinder liquid circulation. Chemical analysis of the process liquid is important, as the production of free fatty acid and nitrogen can change the microbial system resulting in uncharacteristic biogas production. The UASS system is robust, and can run more than 200 days without showing any significant problems. The tubes connecting from pumps to reactors to AFs need to be replaced every alternative month. The water level in the waterbath needs to be checked on a weekly basis and refilled if necessary.
HTC of wet digestate is very effective for waste treatment as well as producing solid biofuel. The dewateribility of the solid product will also be facilitated by the HTC process as shown in the Figure 7. However, HTC of digestate needs to be performed as soon as possible, preferably the same day that the digestate is removed. Otherwise, the digestate starts degrading biologically, which is not favorable for HTC. As HTC is a high temperature (200-260 °C) and high pressure (20-50 bar) process, taking necessary precautions throughout the HTC procedure is very important. All the connections are checked at least once a month to make sure they are gas-tight. HTC process liquid has a higher concentration of furfural, 5-HMF, and phenolic compounds, which are rated as toxicants. So, it is recommended to use a face mask and gloves while handling HTC process liquid, especially when HTC process liquor is drained from reactor vessel to another container. Although HTC has many advantages for handling wet feedstock like digestate, it is still a batch process. In an economic evaluation, HTC batch process will be hard to justify. More research is thus required to facilitate continuous operation of HTC.
Elemental analysis is an effective method for homogeneous solid substrates, but not for heterogeneous substrates. As solid biofuel is usually heterogeneous and elemental analyzer only allows 5-10 mg of sample size, it is recommended to perform at least three replicates and use average. Another limitation of elemental analysis is measuring solid substrates with high ash content. Elemental analyzers only measure CHONS, and no other inorganics. So, elemental analysis of high ash solid substrates might not reveal the actual CHONS concentrations. Sample preparation in elemental analysis is vital, as sample needs to be wrapped precisely, otherwise, there will be an inconsistency in analyses. Fuel value of the solid fuel can be estimated from CHONS, but it is recommended to use a bomb calorimeter for precise fuel value determination.
About 92-161 L of methane was produced per kilogram of volatile solid in the feed. The volatile solid or organic total solid of the dry wheat straw was 86.9%. Dry digestate has lower atomic oxygen and hydrogen concentration, which is another indication of degradation of polysaccharides and simple sugar degradation during anaerobic digestion22,23. Moreover, lower H, and O concentrations increase the HHV of the digestate24. HHV of dry digestate is 22% higher than dry raw feedstock. The similar results are obtained with a detailed statistical analysis by Pohl et al23.
Digestates from anaerobic digestion contains 80-90% water6. These are hydrophilic and water is partially bound in microbial or plant cells. As a result dewatering or drying of digestates is cumbersome and very energy intensive. For example, 2 kg of dry digestate binds 8 kg of water (80% wet), which requires 20.7 MJ of heat to dry digestate. Moreover, it tends to bio-degrade relatively quickly in ambient conditions, loses plant nutrients, and releases GHG (greenhouse gas) emissions such as N2O and CH4. So, despite higher energy potential, fresh digestate cannot be used directly as a solid fuel. It would need to be dried right after the digestion20.
From Table 1, it can be shown that the dry digestate has a similar atomic carbon content as raw straw, and they are visually similar before and after anaerobic digestion (Figure 6). This suggests that lignin and lignin-encrusted cellulose are mostly unreacted. However, a mass yield of 63% observed, meaning processed straw is 37% lighter than dry raw straw. Similar elemental carbon concentration means no carbonization occurred during anaerobic digestion22. As shown in Figure 7, HTC biochar from digestate (thermophilic) is very stable and soft. Because of the significant increase in hydrophobicity, it can literally submerge into water for months without its physical and chemical structure being affected12,25. The hydrophobicity also enhances dewatering of HTC biochar14. Structure of the straw is not discernable in the HTC biochar anymore, which means that cellulose might have been reacted. A significant carbonization is observed in HTC biochar along with the reduction of atomic oxygen. This is another indication of cellulose being reacted rather than lignin. Atomic carbon concentration in lignin is much higher than that of cellulose24-29. As a result, HTC biochar has an HHV of 29.6 MJ/kg, which are 61% higher than raw straw and 32% higher than dry digestate, respectively.
HHV of HTC processed straw is 28.8 MJ/kg, which is also similar to that of HTC processed straw digestate (29.6 MJ/kg). However, mass yield is 40.7% higher in HTC straw than that of HTC digestate with comparing to raw feedstock. As a result, if 1 kg of raw straw (18.4 MJ) is hydrothermally carbonized, HTC straw biochar will have the potential of 11.0 MJ. Otherwise, if same amount is applied to AD and HTC, a total 13.2 MJ bioenergy, in forms of biomethane (5.2 MJ) and HTC biochar from digestate (8.0 MJ), can be produced (Figure 8). Also, liquid phase of the UASS process is a potential liquid fertilizer. Moreover, HTC biochar might have higher potential on high value material use or use as soil amendment. For the carbon sequestration or carbon cycle point of view, material use of HTC biochar is more feasible that energy production.
Anaerobic digestion combined with hydrothermal carbonization can yield more bioenergy than the individual processes. However, a cascaded design is needed for better efficiency. The overall energy balance, followed by an economic evaluation, is required to validate this process. Future research should include use of HTC liquor and post-treatment (chemical or biological) of HTC biochar. Also, automation of both UASS and HTC systems will be needed. This study was carried on using a lab-scale UASS and HTC reactor, but scale-up of the process would be necessary if the process is to be commercialized.
Disclosures
The authors have nothing to disclose.
Acknowledgements
This research was supported by the German Federal Ministry of Research and Education to Project Management Julich (PtJ). The authors thank Mr. Ulf Lüder, for technical support in the biochar laboratory. The authors are also thankful to Ms. Maria Sanchez, and Mr. Jonas Nekat for their volunteer activities in the biogas, and analytical laboratory, respectively. Marcel Schmidt and Antje Schmidt are also acknowledged for their valuable efforts on videography and editing.
Materials
| Name | Company | Catalog Number | Comments |
|---|---|---|---|
| UASS reactor | Patented design | ||
| Balance | KERN | 440-55N | 0.2 g precision |
| Biofilm carrier | RVT Process Equipment GmbH, Germany | Bioflow 40 | Establish 305 m2/m3 |
| Heating bath | Lauda-Konigshofen, Germany | Lauda Ecoline 011 | Ensure mesophilic and thermophilic temperature |
| Recirculation pump | Heidolph pumpdrive | 5201 | |
| Wheat straw | Dittmannsdorfer Milch GmbH, Germany | 5-65 mm length | |
| Biogas analyzer | Pronova, Germany | SSM 6000 | |
| Gas meter | Ritter, Germany | Drum type | |
| HTC reactor | Parr instrument, Moline, IL USA | Parr 4555 | 5 gallon volume |
| HTC Temperature controller | Parr instrument, Moline, IL USA | 4848 | K type thermocouple |
| Balance | KERN FKB | 0.1 g precision | |
| Heating system | Parr | A1600EEE | Band heater, 2 °C/min |
| Software | SpecView | 32849 | Digital monitoring and programming interface |
| Catalyst | Tungsten(VI) oxide | Elemental analyzer | |
| Balance | Mettler Toledo | SN-1128123281 | 1 µg precision |
| Sample pan | Elemental Analyssystem GmbH | Tin 6 x 6 x 12 mm pan | Elemental analysis |
| Drying oven | Binder GmbH, Germany | FP 115 | 105 °C oven |
| Elemental analyzer | Vario | EL III | CHNS analyzer |
References
- Edenhofer, O., Pichs-Madruga, R., Sokona, Y., Seyboth, K., Arvizu, D., Bruckner, T. IPCC Special Report on Renewable Energy Sources and Climate Change Mitigation- Summary for Policy Makers. , Cambridge University Press. Cambridge, UK. (2011).
- Karlsson, M. Sustainable Bioenergy: A Framework for Decision Maker. UN-Energy report. , (2007).
- Eastman, J. A., Ferguson, J. F. Solubilization of particulate organic-carbon during the acid phase of anaerobic-digestion. Journal of Water Pollution Control Federation. 53, 352-366 (1981).
- Mumme, J., Linke, B., Toelle, R. Novel upflow anaerobic solid state (UASS) reactor. Bioresource Technology. 101, 592-599 (2010).
- Pohl, M., Mumme, J., Heeg, K., Nettmann, E. Thermo- and mesophilic anaerobic digestion of wheat straw by the upflow anaerobic solid-state (UASS) process. Bioresource Technology. 124, 321-327 (2012).
- J Mumme,, et al. Hydrothermal carbonization of anaerobically digested maize silage. Bioresource Technology. 102, 9255-9260 (2011).
- Funke, A., Ziegler, F. Hydrothermal carbonization of biomass: A summary and discussion of chemical mechanisms for process engineering. Biofuels Bioprod Bioref. 4, 160-177 (2010).
- Yan, W., Hastings, J. T., Acharjee, T. C., Coronella, C. J., Vasquez, V. R. Mass and energy balance of wet torrefaction of lignocellulosic biomass. Energy Fuels. 24, 4738-4742 (2010).
- Bandura, A., Lvov, A. The ionization constant of water over wide range of temperature and density. Journal of Physical Chemistry. 35, 793-800 (2006).
- Tal Reza, M., et al. Reaction kinetics and particle size effect on hydrothermal carbonization of loblolly pine. Bioresource Technology. , 139161-139169 (2013).
- Reza, M. T., Uddin, M. H., Lynam, J. G., Hoekman, S. K., Coronella, C. J. Hydrothermal Carbonization: Reaction chemistry and water balance. Biomass Conv. Bioref. , (2013).
- Reza, M. T., Lynam, J. G., Vasquez, V. R., Coronella, C. J. Pelletization of biochar from hydrothermally carbonized wood. Environmental Progress & Sustainable Energy. 31 (2), 225-234 (2012).
- Acharjee, T. C., Coronella, C. J., Vasquez, V. R. Effect of thermal pretreatment on equilibrium moisture content of lignocellulosic biomass. Bioresource Tech. 102, 4849-4854 (2011).
- Escala, M., Zumbuhl, T., Koller, C. h, Junge, R., Krebs, R. Hydrothermal carbonization as an enegry-efficient alternative to establish drying technologies for sewage sludge: A feasibility study on a laboratory scale. Energy Fuels. 27 (1), 454-460 (2012).
- Berge, N., Ro, K., Mao, J., Flora, J., Chappell, M., Bae, S. Hydrothermal Carbonization of Municipal Waste Streams. Environmental Science & Technology. 45 (13), 5696-5703 (2011).
- Hoekman, S., Broch, A., Robbins, C. Hydrothermal Carbonization (HTC) of Lignocellulosic Biomass. Energy Fuels. 25, 1802-1810 (2011).
- Reza, M. T., et al. Hydrothermal carbonization for energy and crop production. Applied Bioenergy. 1, 11-28 (2014).
- Reza, M. T., Becker, W., Sachsenheimer, K., Mumme, J. Hydrothermal Carbonization (HTC): Near Infrared spectroscopy and Partial Least-Squares Regression for determination of Selective Components in HTC Solid and Liquid Products Derived from Maize Silage. Bioresource Technology. 161, 91-101 (2014).
- Hoffmann, J., Rudra, S., Toor, S. S., Nielsen, J. B. H., Rosendahl, L. A. Conceptual design of an integrated hydrothermal liquefaction and biogas plant for sustainable bioenergy production. Bioresource Technology. 129, 402-410 (2013).
- Wirth, B., Mumme, J. Anaerobic Digestion of Waste Water from Hydrothermal Carbonization of Corn Silage. Applied Bioenergy. 1, 1-10 (2013).
- VDI Department of Energy Conversion and Application. VDI 4630 Fermentation of organic materials - Characterisation of the substrate, sampling, collection of material data, fermentation tests. Verein Deutscher Ingenieure (VDI), VDI-Society Energy and Environment. 56, Düsseldorf. (2006).
- Rehl, T., Müller, J. Life cycle assessment of biogas digestate processing technologies. Resources. Conserv. Recycling. 56, 92-104 (2011).
- Pohl, M., Heeg, K., Mumme, J. Anaerobic digestion of wheat straw - performance of continuous solid-state digestion. Bioresource Technology. 146, 408-415 (2013).
- Funke, A., Mumme, J., Koon, M., Diakite, M. Cascaded production of biogas and hydrochar from wheat straw: energetic potential and recovery of carbon and plant nutrients. Biomass Bioenergy. 58, 229-237 (2013).
- Reza, M. T., Uddin, M. H., Lynam, J. G., Coronella, C. J. Engineered pellet from HTC and torrefied biochar blend. Biomass Bioenergy. 49, 86-94 (2013).
- Funke, A., Ziegler, F. Hydrothermal carbonization of biomass: A literature survey focusing on its technical application and prospects. 17th European Biomass Conference and Exhibition. , Hamburg, Germany. (2009).
- B Wirth,, et al. Hydrothermal carbonization: influence of plant capacity, feedstock choice and location on product cost. Proceedings of the 19th European Biomass Conference and Exhibition. , Berlin. (2011).
- Peterson, A. A., Vogel, F., Lachance, R. P., Fröling, M., Antal, M. J. Thermochemical biofuel production in hydrothermal media: A review of sub- and supercritical water technologies. Energ Environ Sci. 1, 32-65 (2008).
- Lynam, J. G., Reza, M. T., Vasquez, V. R., Coronella, C. J. Effect of salt addition on hydrothermal carbonization of lignocellulosic biomass. Fuel. 99, 271-273 (2012).
Reprints and Permissions
