Intact class I HLA/peptide complexes are shed by cancer cells, representing a potential relevant cancer biomarker. Utilizing label-free sensor technology and T-cell receptor mimicking monoclonal antibodies, detection of shed MIF/HLA-A*02:01 complexes in MDA-MB-231 cell supernatants, spiked human serum, and patient plasma is demonstrated, enabling development of a novel cancer diagnostic platform.
Method Article
Detection of Human Leukocyte Antigen Biomarkers in Breast Cancer Utilizing Label-free Biosensor Technology
In This Article
Summary
Abstract
According to the American Cancer Society, more than 200,000 women will be diagnosed with invasive breast cancer each year and approximately 40,000 will die from the disease. The human leukocyte antigen (HLA) class I samples peptides derived from proteasomal degradation of cellular proteins and presents these fragments on the cell surface for interrogation by circulating cytotoxic T lymphocytes (CTL). Generation of T-cell receptor mimic (TCRm) monoclonal antibodies (mAbs) which recognize breast cancer specific peptide/HLA-A*02:01 complexes such as those derived from macrophage migration inhibitory factor (MIF19-27) and NY-ESO-1157-165 enable detection and destruction of breast cancer cells in the absence of an effective anti-tumor CTL response. Intact class I HLA/peptide complexes are shed by breast cancer cells and represent potentially relevant cancer biomarkers. In this work, a breakthrough biomarker screening system for cancer diagnostics incorporating T-cell receptor mimic monoclonal antibodies combined with a novel, label-free biosensor utilizing guided-mode resonance (GMR) sensor technology is presented. Detection of shed MIF/HLA-A*02:01 complexes in MDA-MB-231 cell supernatants, spiked human serum, and patient plasma is demonstrated. The impact of this work could revolutionize personalized medicine through development of companion disease diagnostics for targeted immunotherapies.
Introduction
The class I Human Leukocyte antigen (HLA) samples peptides of 8-11 amino acids in length derived from the proteasomal degradation of the intracellular protein repertoire and presents these peptides on the surface of every nucleated cell1,2. The HLA complex is “nature’s biomarker”, indicating the health of each cell (Figure 1) to circulating cytotoxic T lymphocytes (CTL). Recognition of disease associated peptides results in elimination of the offending cell by CTL. Thus, the adaptive immune response is highly effective at eliminating viral infection and tumor. However, the immune system exerts pressure which often promotes selection for viruses or tumor capable of evading an effective CTL response. T-cell receptor mimicking (TCRm) monoclonal antibodies (mAbs) which recognize specific peptide/HLA-A*02:01 complexes such as those derived from breast cancer associated proteins, macrophage migration inhibitory factor (MIF19-27)3 and NY-ESO-1157-165, enable detection and destruction of breast cancer cells in the absence of an effective anti-tumor CTL response4,5. This representative work is focused on the HLA-A*0201 molecule, which is expressed by up to 30% of the population. However, the identification of other relevant HLA/peptide complexes, followed by the production of TCRm enables the development of targeted immunotherapies and companion disease diagnostics, expanding the utility of this work to a much broader population.
A portion of the peptide/HLA complexes bound for the cell surface is released into the plasma. Due to the highly complex nature of peptide/HLA pools, current methods for mining the immunopeptidome for HLA associated biomarkers are time consuming. This process requires the affinity purification of soluble HLA from plasma, separation of HLA associated peptides by reverse phase high pressure liquid chromatography (RP-HPLC) and peptide sequencing by tandem mass spectrometry (MS/MS)6,7. Although this process is a viable option for the discovery of novel therapeutic targets, it is a cumbersome process as a companion diagnostic tool for HLA associated targets already in the therapeutic vaccine or biopharmaceutical pipeline8-10. TCRm directed against these targets provide the tools for rapid companion diagnostic development aimed at stratifying patients into relevant clinical trials and provide more informed therapeutic options.
In this work, a breakthrough biomarker screening system for cancer diagnostics is presented which utilizes TCRm and a label-free bioassay system that monitors biological interactions with minimal processing steps. The label-free bioassay system is based on a method, which utilizes the guided-mode resonance (GMR) effect that occurs in dielectric waveguide gratings11-14. When broadband light contacts the diffractive grating in the plates required for this system, two specific wavelengths are reflected. The binding interaction between an immobilized receptor and its ligand is monitored in real time by tracking the resonance wavelength shift with a spectrum analyzer12. Separate resonance peaks occur for incident TE (electric vector normal to the plane of incidence) and TM (magnetic vector normal to the plane of incidence) polarization states providing multiple data points that can potentially increase detection accuracy11,14. Using antibody pre-sensitized plates in this label-free assay system, the assay run time with data analysis is approximately 45 min. In addition, multiple patient samples can be interrogated in a 96- or 384-well format, a clear advantage over an HPLC-MS/MS based format.
Protocol
Ethics statement: De-identified human tissue and plasma samples were obtained from Hendrick Medical Center under an Institutional Review Board approved protocol.
1. Addition of Biotinylated Antibody
NOTE: Monitoring of this step is optional. See alternative protocol if not monitoring.
- Obtain commercially available avidin derivative coated plates (see Materials and Equipment Table).
- Add 50 µl phosphate buffered saline (PBS) pH 7.2 to wells.
NOTE: Preincubate PBS at 28 °C to minimize temperature related resonance shifts. - Open bioassay scanner software and follow the Setup Wizard to define the experimental procedure which includes selection of blanks, standards and samples in the plate layout, temperature setting (28 °C), number of scans per min (1), and length of experiment (150 min to accommodate for preparative steps).
- Insert the prepared assay plate into the label free bioassay scanner and start the first scan. When the first scan is complete, select “self reference to start”. The baseline is the initial set of scans collected at the start of the experiment. If this is the first read performed on this specific plate, allow the scanner to run to equilibrate temperature and eliminate drift in baseline. See Figure 2 for a screenshot of a baseline followed by sample addition.
- After the baseline has stabilized, or at least 5 scans, pause the read and eject the plate.
- Remove PBS by dumping in the sink and add 50 µl RL21A biotinylated antibody at [10 µg/ml in PBS pH 7.2] to all but control wells on the plate. Add 50 µl PBS to the control wells.
- Insert the plate back into the bioassay scanner and resume reading until saturation is reached, approximately 1.5 hr.
- Pause the read and eject the plate.
- Wash the plate 3 times with 200 µl/well phosphate buffered saline + 0.05% Tween 20 (PBST) followed by 3 rinses with 200 µl/well PBS pH 7.2. Repeat with PBS. Tap excess PBS from plate on paper towels prior to moving to the next step.
NOTE: This step can be performed on an automatic plate washer or wash the plate 3 times with 200 µl PBST by dumping liquid into a sink and replacing PBST with a pipette. - Add 50 µl PBS pH 7.2 to all active wells.
- Insert the plate back into the bioassay scanner and resume reading to monitor post-wash resonance.
- Stop the read and eject the plate.
Alternative protocol for Step 1:
- Add 50 µl RL21A biotinylated antibody at [10 µg/ml PBS] to all wells.
- Incubate at room temperature for 1.5 hr or overnight at 4 °C.
- Wash the plate 3 times with 200 µl/well PBST followed by 3 rinses with 200 µl/well PBS as in step 1.9.
2. Addition of Analyte
- Remove the PBS and add 50 µl per well of appropriate assay buffer. For this assay, commercially available normal human serum was used diluted 1:20 in PBS.
- Open bioassay scanner software and follow the Setup Wizard to define experimental procedure.
- Insert the plate into the bioassay scanner and begin a baseline read. If this is the first read performed on this specific plate, let the scanner run to equilibrate temperature and eliminate drift in baseline.
- After the baseline has stabilized, or at least 5 scans, pause the read and eject the plate.
- Remove the assay buffer from the wells.
- Spike controls with HLA A*02:01 monomer bearing relevant (FLSL) or irrelevant (SLLV, YLEV, or KVL) peptides at concentrations ranging from [0.625-10 µg/ml] in assay buffer. Add 50 µl of standards to the control wells of the plate
- Add 50 µl of analyte in assay buffer to the sample wells of the plate. For this assay, spiked commercially available human serum was used.
- Insert the plate back into the bioassay scanner and resume reading until saturation is reached, approximately 30-60 min.
- Pause the read and eject the plate.
- Wash the plate 3 times with 200 µl/well PBST followed by 3 rinses with 200 µl/well PBS as in step 1.9.
- Add 50 µl assay buffer to all active wells.
- Insert the plate back into the bioassay scanner and resume reading to monitor post-wash resonance.
- Stop the read and eject the plate.
NOTE: The assay buffer could be PBS, Tissue culture media, or human serum diluted 1:20 in PBS depending on the goal of the assay.
3. Data Analysis
- Analyze using the bioassay scanner software or export raw data files to preferred statistical analysis software. The bioassay scanner software automatically generates the binding curve based on the plate layout provided during experimental setup.
NOTE: If not using the bioassay scanner software for analysis, follow steps 3.2-3.4. - Subtract the baseline and negative control from each subsequent data point.
- Calculate the mean and standard deviation for replicate wells at each time point.
- Generate a graph of the binding curve or select end point data for bar graphs.
Results
A representative set of experiments was performed using the well-characterized TCRm, RL21A, a murine IgG2a monoclonal antibody which specifically recognizes a peptide (MIF19-27 or FLSL) within the context of the HLA-A*02:01 molecule3. The cognate peptide/HLA monomer, as well as irrelevant HLA monomer15, was used to demonstrate the described procedure. Figure 3 illustrates the assay format.
RL21A is specific for the FLSL/HLA monomer with little cross reactivity with other peptide/HLA complexes3. This specificity is recapitulated using the label-free bioassay system (Figure 4). The sensitivity of the label free bioassay system for this experiment is in the low nanomolar range as determined by titration of the RL21A antibody on immobilized FLSL/HLA monomer (Figure 5). Although the background signal is significantly increased in serum samples, specific detection of FLSL/HLA monomer in spiked human serum is achieved in Figure 6 and a concentration gradient is readily discernable in these samples. Finally, supernatants from the MDA-MB-231 cell line, previously shown to present the FLSL/HLA-A*02:01 molecule, are shown to contain soluble FLSL monomer using this label free assay platform (Figure 7). Subsequent addition of FLSL/HLA monomer increases the signal on RL21A (Figure 7). Due to the sensitivity of the system, well to well variation including negative resonance shifts can occur as a result of temperature fluctuations as seen as a function of the standard deviations in Figures 4 and 5. These variations can be reduced dramatically by pre-incubation of all samples and the bioassay plate reader at a temperature in slight excess of room temperature (i.e., 28 °C).
In Figure 8, briefly, 96-well polystyrene plates were coated with [10 µg/ml] of RL21A for 2 hr at room temperature, washed with PBST, blocked with 0.5% low fat milk, washed with PBST, and incubated for 2 hr at room temperature with serial dilutions of FLSL HLA monomer in normal human serum diluted 1:10 in PBS to generate a standard curve or patient plasma diluted 1:10 in PBS. The plate was washed with PBST, incubated 1 hr at room temperature with rabbit anti-human β2 microglobulin [1:5,000] to detect intact HLA, and washed in PBST. Plates were then incubated for 30 min with goat anti-rabbit IgG [1:10,000] and washed with PBST. Colorimetric detection was performed using ABTS (2,2’-Azinobis [3-ethylbenzothiazoline-6-sulfonic acid]-diammonium salt) substrate with a 15 min incubation time and observed at 405 nm on a microplate reader. FLSL/HLA was detected in three patient samples.
In Figure 8B, patient plasma RL.064 was diluted 1:20 in PBS and then added to the plate and monitored on the label-free detector for 60 min. Specific detection of FLSL/HLA complex in patient serum was accomplished. Student’s t test was performed using graphing and statistics software (p <0.05).
In Figure 8C, tissue sections were stained at 1 µg/ml with mouse anti-HLA-A2 (BB7.2) as a positive control, RL21A, IgG2b and IgG2a respectively as negative controls. Staining was detected using an anti-mouse detection kit, DAB (diaminobenzadine), and hematoxylin QS for nuclear staining as directed by the manufacturer. Staining of tumor tissue by RL21A confirms presentation of FLSL/HLA complexes.
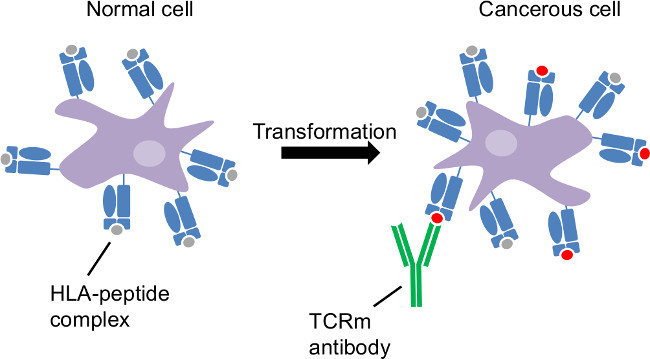
Figure 1: Tumor antigen presentation by the class I human leukocyte antigen. Cancerous transformation is an intracellular disorder. HLA sample intracellular proteins and reveal cancer-related changes at the cell surface. CTL and TCRm are able to recognize cancerous cells through HLA-peptide complexes distinct to those cells.
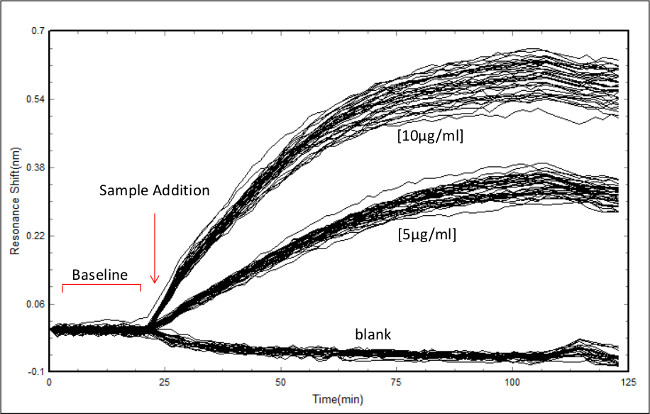
Figure 2: Screenshot of data acquisition in the bioassay scanner software. Example of data acquisition showing the initial baseline scan followed by RL21A antibody addition to a plate coated with 10 µg/ml of FLSL/HLA complex. Concentrations of antibody are as indicated. Each line represents an individual well monitored over time.
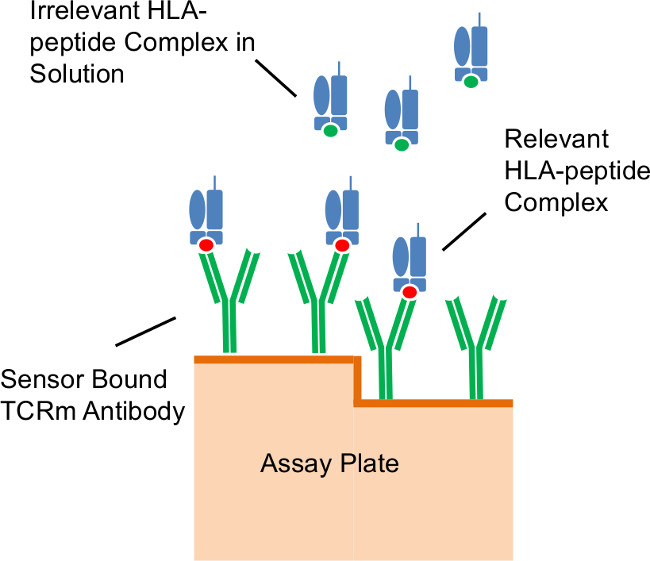
Figure 3: Assay format. Illustration of antibodies immobilized on the diffractive grating surface of the assay plate capturing relevant peptide/HLA complexes in solution.
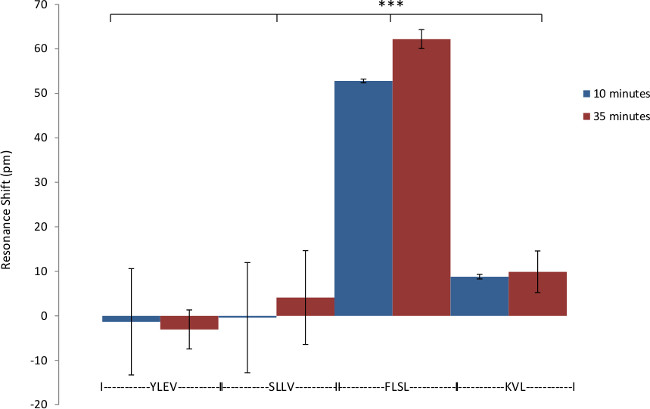
Figure 4: Specificity of RL21A for FLSL/HLA complex. Demonstration of the specificity of biotinylated RL21A TCRm for its relevant (FLSL) HLA monomer compared to irrelevant HLA monomer (YLEV, SLLV, and KVL). Biotinylated RL21A TCRm [10 µg/ml] was immobilized on the avidin coated assay plate surface and detection was performed using unlabeled relevant or irrelevant HLA monomer [10 µg/ml] in PBS. RL21A was specific for FLSL/HLA Complex. Two-way ANOVA was performed using graphing and statistics software (p <0.001).
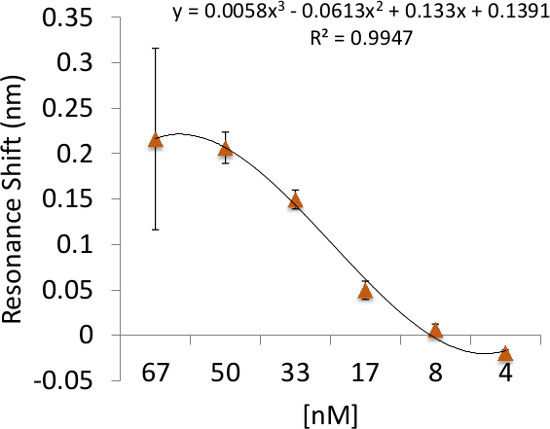
Figure 5: Binding sensitivity of RL21A to its cognate peptide/HLA complex. Illustration of the detection limit and binding sensitivity of RL21A to the FLSL/HLA complex. Biotinylated HLA Monomer FLSL [10 µg/ml] was immobilized on the assay plate surface and unlabeled RL21A was added to the plate in serial dilutions in PBS as indicated. Detection for this system was in the low nanomolar range.
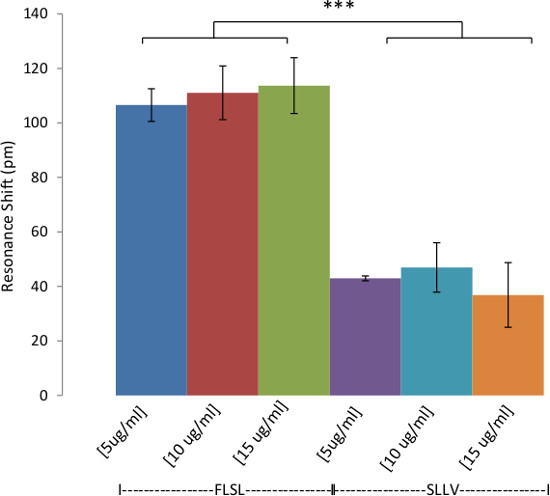
Figure 6: Detection of HLA Complexes in Spiked Human Serum. Demonstration of the detection of HLA in human serum. Biotinylated RL21A TCRm [10 µg/ml] was immobilized on the avidin coated assay plate surface. Pooled normal human serum spiked with relevant (FLSL) or irrelevant (SLLV) HLA monomer was diluted 1:20 in PBS and then added to the plate and monitored on the label-free detector for 60 min. Specific detection of FLSL/HLA complex in human serum was accomplished. In general, background signal (irrelevant SLLV monomer) is higher for diluted serum samples compared to purified analytes in PBS (see Figure 4). Two-way ANOVA was performed using graphing and statistics software (p <0.0001).
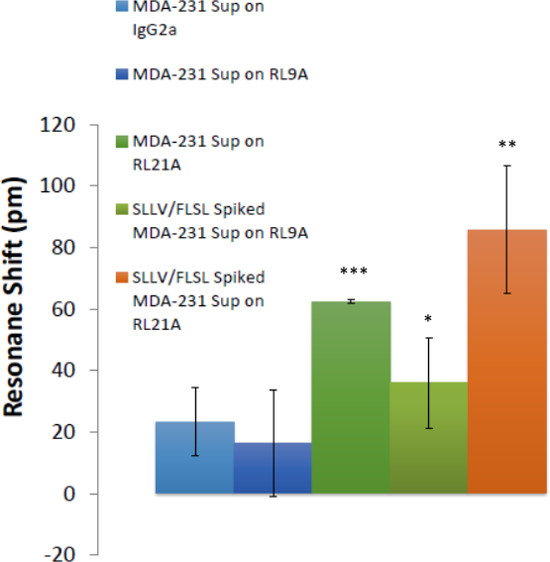
Figure 7: Soluble HLA complexes were detected in breast cancer cell culture supernatants. The ability to detect HLA in breast cancer cell supernatants is demonstrated. Biotinylated RL21A TCRm, RL9A TCRm (negative control), and an isotype control were immobilized on the assay plate surface. Spiked [5 μg/ml] and unspiked MDA-231 cell culture supernatants were added and binding was monitored for 60 min on the label-free detector. FLSL and SLLV HLA monomer spiked samples represent positive controls for RL9A and RL21A binding. One-way ANOVA was performed using graphing and statistics software (p <0.0001).
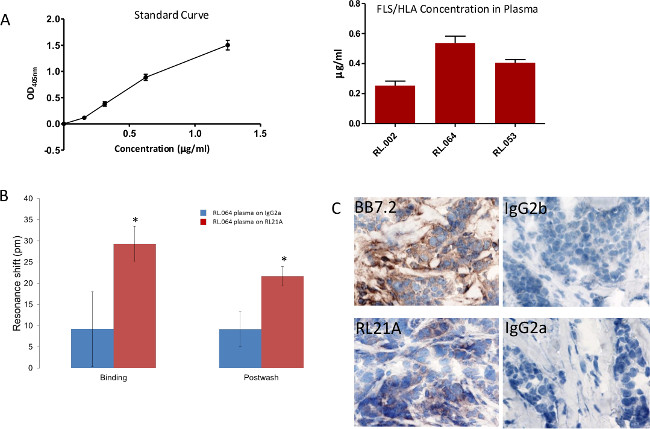
Figure 8: Specific detection of FLSL/HLA complexes in patient samples. (A) A traditional Enzyme Linked Immunosorbent Assay (ELISA) was utilized to detect FLSL/HLA specific complexes in patient plasma. (B) Biotinylated RL21A TCRm or IgG2a [10 µg/ml] was immobilized on the avidin assay plate. (C) Breast tumor tissue from patient RL.064 was stained as previously described3 to verify tumor presentation of the FLSL/HLA complexes. Please click here to view a larger version of this figure.
Discussion
The method described herein introduces a biomarker screening system for cancer diagnostics that would enable rapid detection of soluble peptide/HLA complexes in patient serum, plasma, urine or saliva samples in a high throughput 96- or 384-well format. This assay system utilizing T cell receptor mimicking monoclonal antibodies and a label-free detection system cuts the analysis time to less than 1 hr compared to 3.5 hr by conventional ELISA. This high-throughput approach enables rapid stratification of patients to clinical trials for therapeutic cancer vaccines or biopharmaceuticals. Current methods for the detection of these disease targets require affinity purification and HPLC-MS/MS of individual patient samples, a cumbersome and time consuming process. Although this method is amenable to conventional ELISA techniques, there is concern that secondary detection reagents such as the anti-β2 microglobulin antibody could alter the structure of the nascent HLA molecule and inhibit binding to the TCRm limiting detection. Label-free detection alleviates these concerns. This procedure could be modified for use on other label-free systems such as a surface plasmon resonance system. However, this would greatly reduce the higher throughput capabilities compared to the bioassay system used in this study.
This protocol can be effectively modified for the detection of non-HLA biomarkers in patient serum and plasma with adherence to a few critical steps. Monitoring of the initial antibody coating process is recommended for optimization of the surface, as a <200 pm shift will likely result in low signal for the subsequent detection step. The baseline and post-wash reads are useful for the endpoint analysis as the abundance of serum proteins may mask binding of low concentration analyte. Finally, temperature variation of samples can result in well to well variation. It is recommended that all samples be pre-incubated and the label free biosassay unit temperature controller be set at 2-3 °C above room temperature. Refrigerated samples should be allowed enough time to reach the operating temperature.
Future modifications of this protocol will include multiplexing of TCRm on the plate surface. The bioassay system is currently amenable to spotting of wells at a density of at least 8-plex. By introducing 4-8 TCRm to each well, per test sample volumes are reduced and enable the collection of increasingly complex data per patient. This capability could further inform patients with regard to therapeutic options.
Disclosures
The authors, Debra Wawro Weidanz and Robert Magnusson, are respectively Chief Executive Officer and Chief Technology Officer at Resonant Sensors Incorporated, which produces the bioassay plate reader and assay plates used in this article.
Acknowledgements
These studies were supported in part by the Development Corporation of Abilene which provides laboratory space and salary support for Experimmune, a Center for Immunotherapeutic Development at Texas Tech University Health Sciences Center and Resonant Sensors Incorporated.
Materials
| Name | Company | Catalog Number | Comments |
|---|---|---|---|
| ResoSens Label-free Bioassay Detection System | Resonant Sensors Incorporated | ||
| Avidin Sensitized Bionetic 96-well Plates | Resonant Sensors Incorporated | ||
| ResoVu software | Resonant Sensors Incorporated | ||
| RL21A Biotinylated TCRm mAb | PureMHC, LLC | ||
| RL9A Biotinylated TCRm mAb | PureMHC, LLC | ||
| FLSL HLA-A*02:01 Monomer | Experimmune | full peptide sequence: FLSELTQQL | |
| SLLV HLA-A*02:01 Monomer | Experimmune | full peptide sequence: SLLMWITQV | |
| YLEV HLA-A*02:01 Monomer | Experimmune | full peptide sequence: YLEPGPVTV | |
| KVL HLA-A*02:01 Monomer | Experimmune | full peptide sequence: KVLEYVIKV | |
| Pooled Normal Human Serum | ThermoFisher | BP2657100 | |
| MDA-MB-231 Cell Supernatant | ATCC | HTB-26 | Cells grown in IMDM , 10% FBS and 1% penn/strep. Supernatants harvested from 3 day confluent cultures. |
| Iscove's Modification of Dulbecco's Medium (IMDM) | Life Technologies | 12440-053 | |
| Fetal Bovine Serum (FBS) | Life Technologies | 10082-147 | |
| Penicillin/Streptomycin | Life Technologies | 15070-63 | |
| Sodium Hydroxide | ThermoFisher | 5318-1 | |
| Phosphate Buffered Saline (PBS) | ThermoFisher | BP665-1 | |
| Phosphate Buffered Saline + 0.05% Tween 20 (PBST) | ThermoFisher | BP337-500 | |
| 2,2’-Azinobis [3-ethylbenzothiazoline-6-sulfonic acid]-diammonium salt (ABTS) | ThermoFisher | 37615 | |
| rabbit anti-human β2 microglobulin | Dako | A0072 | |
| Peroxidase conjugated goat anti-rabbit IgG | Jackson Immunoresearch | 111-035-144 | |
| Nunc microplates | ThermoFisher | 439454 | |
| Synergy 2 microplate reader | Biotek | ||
| Immpress Reagent Kit | Vector | MP-7402 | |
| Immpact DAB | Vector | SK-4105 | |
| Hematoxylin QS | Vector | H3403 | |
| IgG2a | MP BioMedicals | 50328 | |
| IgG2b | MP BioMedicals | 50330 | |
| anti-HLA-A2 (BB7.2) | Experimmune | ||
| Prism 5 | Graphpad |
References
- Shastri, N., Schwab, S., Serwold, T. Producing nature's gene-chips: the generation of peptides for display by MHC class I molecules. Annu Rev Immunol. 20, 463-493 (2002).
- Peaper, D. R., Cresswell, P. Regulation of MHC class I assembly and peptide binding. Annu Rev Cell Dev Biol. 24, 343-368 (2008).
- Hawkins, O., et al. An HLA-presented fragment of macrophage migration inhibitory factor is a therapeutic target for invasive breast cancer. J Immunol. 186 (11), 6607-6616 (2011).
- Verma, B., et al. TCR mimic monoclonal antibody targets a specific peptide/HLA class I complex and significantly impedes tumor growth in vivo using breast cancer models. J Immunol. 184 (4), 2156-2165 (2010).
- Verma, B., et al. TCR mimic monoclonal antibodies induce apoptosis of tumor cells via immune effector-independent mechanisms. J Immunol. 186 (5), 3265-3276 (2011).
- Bassani-Sternberg, M., et al. Soluble plasma HLA peptidome as a potential source for cancer biomarkers. Proc Natl Acad Sci U S A. 107 (44), 18769-18776 (2010).
- Hickman, H. D., Yewdell, J. W. Mining the plasma immunopeptidome for cancer peptides as biomarkers and beyond. Proc Natl Acad Sci U S A. 107 (44), 18747-18748 (2010).
- Neethling, F. A., et al. Assessing vaccine potency using TCRmimic antibodies. Vaccine. 26 (25), 3092-3102 (2008).
- Mittendorf, E. A., et al. Clinical trial results of the HER-2/neu (E75) vaccine to prevent breast cancer recurrence in high-risk patients: from. US Military Cancer Institute Clinical Trials Group Study I-01 and I-02. Cancer. 118 (10), 2594-2602 (2012).
- Winter, H., Fox, B. A., Ruttinger, D. Future of cancer vaccines. Methods Mol Biol. 1139, 555-564 (2014).
- Magnusson, R., Wawro, D., Zimmerman, S., Ding, Y. Resonant photonic biosensors with polarization-based multiparametric discrimination in each channel. Sensors. 11 (2), 1476-1488 (2011).
- Kaja, S., et al. Detection of novel biomarkers for ovarian cancer with an optical nanotechnology detection system enabling label-free diagnostics. J Biomed Opt. 17 (8), 081412-081411 (2012).
- Magnusson, R., Wang, S. S. New principle for optical filters. Appl. Phys. Lett. 61, 1022-1024 (1992).
- Wawro, D., Tibuleac, S., Magnusson, R., Liu, H. Optical fiber endface biosensor based on resonances in dielectric waveguide gratings. Proc. SPIE. 3911, 86-94 (2000).
- Altman, J. D., et al. Phenotypic analysis of antigen-specific T lymphocytes. Science. 274 (5284), 94-96 (1996).
Reprints and Permissions
