A highly reproducible model for myocardial infarction in mice with minimal invasive manipulations is described. The model can be easily performed, resulting in a high reproducibility and survival rate. Thus, the described model will reduce the number of required animals as requested by the 3R principle (Replacement, Refinement and Reduction).
Method Article
Minimal Invasive Surgical Procedure of Inducing Myocardial Infarction in Mice
In This Article
Summary
Abstract
Myocardial infarction still remains the main cause of death in western countries, despite considerable progress in the stent development area in the last decades. For clarification of the underlying mechanisms and the development of new therapeutic strategies, the availability of valid animal models are mandatory. Since we need new insights into pathomechanisms of cardiovascular diseases under in vivo conditions to combat myocardial infarction, the validity of the animal model is a crucial aspect. However, protection of animals are highly relevant in this context. Therefore, we establish a minimally invasive and simple model of myocardial infarction in mice, which assures a high reproducibility and survival rate of animals. Thus, this models fulfils the requirements of the 3R principle (Replacement, Refinement and Reduction) for animal experiments and assure the scientific information needed for further developing of therapeutical strategies for cardiovascular diseases.
Introduction
Myocardial infarction is one of the main causes of death in industrialized countries. Despite undeniable progress of diagnostic and therapeutic approaches, cardiovascular diseases are still the major cause of mortality. Given the improved life expectancy and life-related risks, a continuous increase in the incidence of cardiovascular diseases is expected in the future. Therefore, there is a strong need to establish and validate novel approaches for the treatment of cardiovascular disease. The information of human studies suffer from its limitations, these studies generally are insufficient to explain and understand the mechanisms at the molecular level, being unable to provide solutions to these major health problems.
Moreover, basic research has been limited due to complexity and difficulty to reproduce the mechanisms of cardiovascular disease in the laboratory. Therefore, to increase our knowledge about the pathophysiology of cardiovascular diseases, it is essential to validate animal models1,2. However, to identify all cascades of molecular events involved in the healing after myocardial infarction, analysis at different time points is necessary, causing a large number of animals experiments.
Myocardial infarction experiments are often performed by using animal models. Inducing myocardial infarction in small animals3-11 is the most suitable and efficient model employed to investigate cellular and molecular events than large animal models. Moreover, no other species presents the availability of transgenic or knockout strains as mice12. These mouse models are highly useful in other diseases, including cardiovascular pathologies (such as atherosclerosis, in stent restenosis)13,14. In addition, the low pregnancy period and the high number of progenies qualify mouse models as most attractive system to study molecular mechanisms of myocardial infarction12.
Nevertheless, the size of the heart in mice expects high precision of manipulation during microsurgery. Teaching such qualified and skilled surgery personnel is a time-consuming and work-intensive process. Therefore, we herein present a detailed microsurgery procedure, including tips and tricks to guide collaborators even with average qualifications, such as students or technicians to perform the complex myocardial infarction model in mice.
Initially, intubation is performed by means of a short cannula without using the tracheotomy. The thoracic incision is located in the intercostal area, avoiding injury of ribs or/and surrounding tissue. This sub-step is highly relevant to assure fast recovery and healing15. The ligature is made differential for chronic ischemia and ischemia/reperfusion models, for a high survival rate while still maintaining a significant infarction size. Our experience shows that using silk suture assures a higher reproducibility compared to cryo-injuries16.
In conclusion, the method described here is applicable in both chronic ischemia and ischemia/reperfusion models in small animals. The tips and tricks presented in this procedure are meant to enable personnel with even low or average qualification to apply it in small animal models.
Protocol
NOTE: Experiments presented in this paper are performed accordingly to the German low and to the European animal care guidelines. The animals are bred in the Animal facility of Institute for Laboratory Animal Science, Universiy hospital Aachen, Germany, under supervision of Prof. Dr. R. Tolba and Dr. A. Teubner (animal welfare officer).
1. Animal Care
- Keep the mice in a specialized care unit, assuring proper access to food and specialized veterinary control and treatment. If the animals are moved or purchased from outside, please assure one-week accommodation before undergoing the procedure.
2. Intubation
- Anesthetize 8-10 weeks old male C57Bl/6 wild type mice, 25-27 g using intraperitoneal injection of 100 mg/kg ketamine and 10 mg/kg xylazine. Monitor the level of anesthesia by toe pinch reflexes. Place vet ointment on the eyes to prevent dryness during the procedure.
- Manage pain therapy with buprenophine 0.1 mg/kg body weight subcutaneously before starting the surgical procedure, following the animal care guidelines of your institution.
- Assure the maintenance of sterile conditions to avoid infections during surgery by using sterile materials and instruments.
- Place the anesthetized mouse in a supine position on a heated surgery table. Remove the hair from both ventral neck area and left half of the thorax using a small razor and disinfect with 70% alcohol prior to incision.
- Perform a small median incision of 0.5 cm using surgery scissors in the center of the neck. Under the skin, go through the 2 fatty bodies with sterile curved forceps and visualize the trachea under stereomicroscope through the transparence of the covering muscle.
- Introduce orally the intubation cannula into the trachea under view by using the stereomicroscope (Figure 1A). Distinguish the metal cannula through the transparent tissue. And check, the position and location during the operation at any moment (Figure 1B).
- Connect the cannula to the small animal ventilator and adjust ventilation settings according manufactures guidelines (tidal volume between 100-150 µl and a respiration rate between 100-150 per min).
3. Myocardial Infarction Induction
- Perform a skin incision less than 0.5 cm in the middle of a line between xyphoid and left axila. Use forceps to separate the muscle layer from the underlying ribs.
- Perform a small incision between ribs by using a small scissor until the thoracic cavity is opened17. For chronic infarction, perform the incision in the 5th intercostal space (Figure 1C) and/or for the ischemia/reperfusion model, in the 4th intercostal space (Figure 1D): for an easier approach number from below the 2th and the 3th intercostal space, respectively).
- Place the retractors into the incision to open thoracic cavity and to visualize the heart.
- Carefully remove the pericardium to prevent excessive fibrotic processes.
- Visualize the left descending coronary artery (LAD) as a deep positioned light red vessel. If the LAD cannot be visualized, consider some reference points to increase the reproducibility.
- For chronic infarction model, place the ligature in the middle of the ventral side of the heart (between the auricle and apex), having as reference the vein as shown in Figure 1C. Bind both branches of the artery using 0/7 silk suture to obtain a transmural anterior and posterior infarction. The gray color indicates the position of the ligature and can be repeated if needed (Figure 1C).
- For ischemia/reperfusion model, place the ligature under the auricle, over the main body of LAD (Figure 1D). The ligature is located over a silicon tube to protect the integrity of the vessel. The gray color indicates the infarcted area and should appear in the entire heart (Figure 1D). Place temporal sutures on the ribs during the ischemia period and moisten using a compress to avoid tissue drying. After ischemia, remove the silicon tube and cut the suture with small scissors to visualize the reperfusion.
- Beside the anesthetics and analgesics used at the beginning of procedure (steps 2.1 and 2.2), use 0.5% isoflurane during surgery to ensure the proper comfort of the animal, or follow the animal care guidelines of your institution.
4. Suture and Recovery
- Eliminate the residual air from thorax by filling with warm isotonic salt solution.
- Close the thorax with 3 sutures 0/6 (as shown in Figure 2A and 2B). Position the medial sutures at an angle of 90°, to assure a sealed closure of the ribs, as shown in Figure 2 (Figure 2A, B).
- Close the muscle layer with 2 sutures (Figure 2C) and the skin with 3-4 sutures 0/6 (Figure 2D). Perform these sutures separately to obtain a proper window for further echocardiographic measurement.
- Disconnect the intubation cannula from the ventilator and allow spontaneous breath. For later identification, mark the mouse using the local system (ask the animal welfare officer from your institution).
- Lay down the mouse on the left side under the red lamp until it wakes up. Do not leave an animal unattended until it has regained sufficient consciousness. Do not allow an animal that has undergone surgery to be in the company of other animals until fully recovered.
- Manage pain therapy with buprenophine 0.1 mg/kg body weight, subcutaneously for the next 3 days, following the animal care guidelines of your institution.
5. Analysis of the Myocardial Infarction
- Regularly monitor the heart function by means of echocardiography (Figure 3A): the ejection fraction, fractional shortening, cardiac output and heart dimensions.
- Anesthetize the animals using intraperitoneal injection of 100 mg/kg ketamine and 10 mg/kg xylazine. Confirm proper anesthetization prior to surgery by the lack of reflexes.
- Open the thoracic cavity and excise the heart, placing it in sterile PBS solution washing extensively the remaining blood.
- If needed, collect the blood directly from the heart by avoiding the injury of the infracted regions, or after removal of the heart, from the thoracic cavity.
- After washing, stop the heart in diastola in saturated KCl solution (steril filtered 3M KCl in PBS). For histological analysis fix the heart in 10% formalin and proceed with Step 5.7.
- If necessary, measure the viability of the cardiac cells by Evans-Blue/ Triphenyl tetrazolium chloride (TTC) staining. After rebuilding the ligature at the initial place, perfuse the heart with 200 µl 1% Evans Blue Solution using an aortic cannula and freeze the heart in a small plastic bag at -20 °C, without washing.
- After 2 hr, perform 5 transversally slides using a sharp scalpel and incubate them for 10-15 min in TTC solution at 37 °C, as described by manufactured. Fix the slides for 10 min in 10% formalin and put them between the microscopic slides for further analysis.
- Embed the heart tissue in paraffin, by positioning the heart on the tip, to perform transversal sectioning. Perform serial section of 5 µm. Collect the first 20 sections and discard the next 300 µm. Continue the section protocol until the mitral valve level has been reached (Figure 3A, B). Serial sections, 400 µm apart along the entire heart are collected and can be stained for the qualitative and quantitative analysis.
- Measure the infarction size using Gomori's one-step staining6-8.
- Analyze angiogenesis, collagen content or inflammatory cells recruitment in serial section using usual immunohistological staining.
Results
The myocardial infarction procedure occurs within 25-30 min and shows a mortality rate of 10%. After surgery, the mice recover from anesthesia within the next 15 min. No physical impairment was observed to the operated mouse. However, there is a higher risk of heart rupture one week after post-chronic myocardial infarction, if the repairing processes are disturbed during the inflammatory phase. Since heart is able to change significantly its dimensions during the pumping, it is important for all the collected hearts to be stopped in the same position, for example in diastola. This can be achieved by perfusing the heart with saturated KCl solution. Increased extracellular K+ concentration blocks the ionic pumps, decreases the membrane resting potential of cardiac cells, resulting in a diastolic arrest of cardiac activity.
The infarction area can be seen in ultrasound analysis (Figure 3A, lower panel). In comparison to the normal myocardium, ischemic regions appear thin and hypokinetic (Figure 3A, upper panel). Depending on the model used, the infarction size will differ. The chronic infarction model induces circular, transmural infarction of the apex (Figure 3B), while the ischemia/reperfusion induces a thin, middle-wall and throughout all heart (Figure 3C). There are many methods to determine infarction size. If the aim is to analyze the direct effect on cardiac viability, an Evans-Blue/TTC staining18 is indicated to be performed at least 2 hours after reperfusion, to be able to see any changes in the myocardium. Sections can be analyzed immediately (Figure 3B, middle panel) after staining or can be kept between glass slides in formalin for 2-3 days (Figure 3C, middle panel). The blue area represents the healthy myocardium, not affected by ischemia. The red area represents the viable myocardium inside the ischemic area (risk myocardium), and the white area represents the dead tissue. Usually, the infarction size is expressed as percent from the risk area.
The mature scar resulting after remodeling processes can be easily measured by immunohistolgy using Gomori's one-step staining. Blue-stained infarcted and red-stained healthy ventricular areas (Figure 3B and C, right panels) are determined in the first section from each level until the mitral valve. To avoid the variation due to binding of LAD at different levels, the infarction from all section is considered and expressed as a percentage of total left ventricular volume. An infarction volume of 15-20% in chronic infarction model and of 10-15% after ischemia/reperfusion model can be achieved. Further, the chronic infarction model will induce an accentuated dilatation, not observed in the ischemic/reperfusion model (Figure 3B and C right panel).
Conventional staining procedures can be used, such as: CD31 staining used to reveal the angiogenesis (red, Figure 4A) or smooth muscle actin staining to determine myofibroblasts (green, Figure 4B). Double fluorescence staining can also be applied to identify different target molecules in the infarction area, since the absence of cardiomyocytes gives no auto-immunofluorescence (Figure 4C).
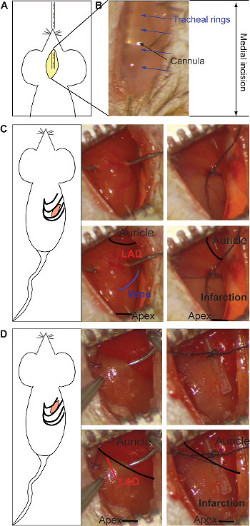
Figure 1: Medial incision and insertion of the intubation's cannula (A). The stereomicroscopic visualization of the metal cannula through the transparence of the tissue (B). The tracheal rings (blue arrows) and the cannula (black arrow) are pointed out. The intercostal incision for the chronic infarction model and the ligature of LAD (C). The ligature is located at middle of the heart (between the auricle and apex, black in lower panel), taking as reference the end of the vein (schematic in blue, lower panel). Both branches of the artery should be bound (red in lower panel). The gray color indicates infarcted area and it appears in the lower half part of the heart (right lower panel). The ligature for the ischemia/reperfusion model is made under the auricle, binding the main body of LAD (red in lower panel) over a silicon tube (right side) (D). The gray color indicates the infracted area, which is present on the entire heart (right lower panel). Please click here to view a larger version of this figure.
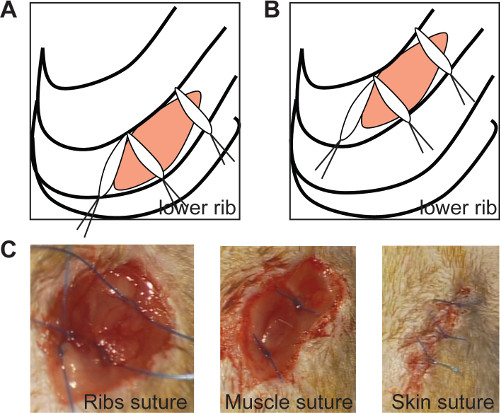
Figure 2: The ribs suture seals the thoracic incision if the medial sutures are positioned at an angle of 90° in both chronic (A) and ischemia/reperfusion model (B, left panel). In vivo imaging of ribs suture (C, left panel), muscle suture (C, middle panel) and skin suture (C, right panel). Please click here to view a larger version of this figure.
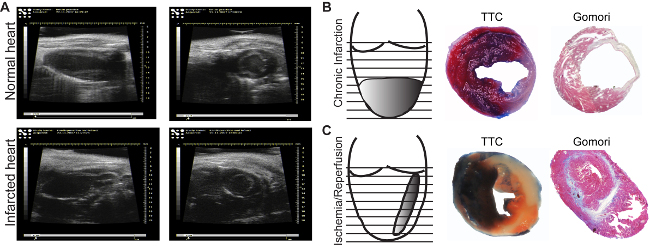
Figure 3: Echocardiographic images. Images of normal (A, upper panel) and infarcted areas (A, lower panel), are acquired in the long axis (longitudinal, left panels) or in the short axis (transversal, right panels).. Infarction induced by chronic ligature (B) and by one hr ischemia followed by reperfusion (C). Evans Blue/TTC Staining allows identification of perfused (blue)/non-perfused areas as well as the viable (red)/dead (white) myocardium (B, C, middle panels). Gomori's one-step staining allows the identification of infarcted areas (blue), and differentiates them from the normal regions (red) (B, C, right panels). Please click here to view a larger version of this figure.
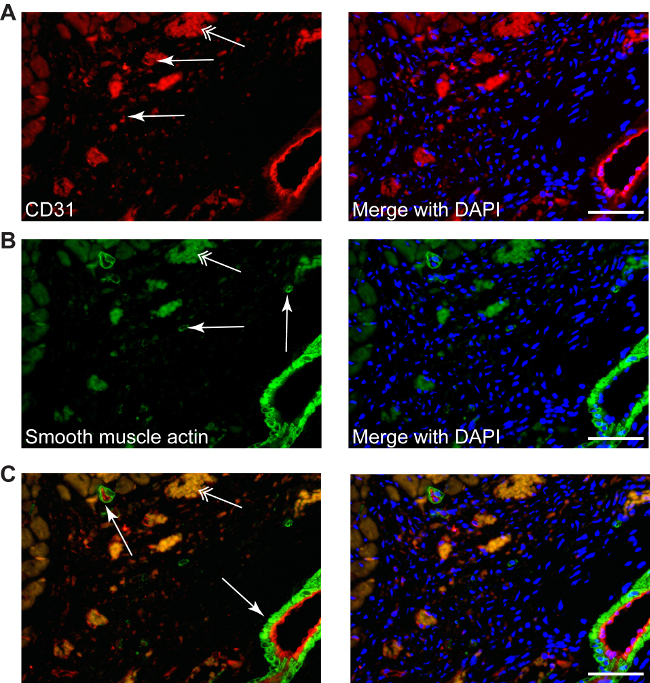
Figure 4: Different stainings can be performed in infracted area, such as CD31 to described neo-angiogenesis (A, red, simple arrows), or smooth muscle actin for myofibroblasts (B, green, simple arrows), as well as double staining (C, CD31-red/smooth muscle actin-green), counterstained with DAPI for nuclei (blue). Myofibroblasts can be differentiated easily from smooth muscle cells from small or big arteries, which are always accompanied by a endothelial layer (C, arrows). Double arrows point the erythrocytes autofluorescence. Scale bars 50 µm.
Discussion
During the procedure, there are some critical points to be noted: the intubation, the opening the thoracic cavity and the LAD ligature. The first critical step is the intubation of the animal before experiements. Many groups are using a vertical support for fixing the mouse and a source of light to insert the cannula directly into the trachea. This method has uncertainty concerning the correct insertion of the cannula into the trachea and is the most prone to failure by the novices. Making a small incision, the position of the cannula can be controlled during the entire maneuver, thus decreasing the default rate. Moreover, the tracheotomy is surpassed, thus decreasing complications and reducing the time of operation.
The next critical step is the opening of the thoracic cavity. The median sternotomy represents a high-risk maneuver delaying the recovery of the animals. The lateral left incision implying the cutting of 2-3 ribs15, leads to deficient recovery and increased mortality. We used in the model small, discrete incision between the ribs offering minimal burden. The animals recover very quickly after the surgery and do not present defects or disturbed healing. The lower inter-costal space is taken as a reference point. Considering this, the proper and differentiated access to the ligature place for chronic and ischemia/reperfusion model, does not raise serious problems.
The ligature itself represents the most critical step. The left descending coronary artery is hard to be visualized, and often needs to be bound without view. Therefore, some anatomic reference points are pointed out to help the surgeon to perform the correct ligation. For the chronic infarction model, the ligature is placed in the middle of the ventral side of the heart, between the auricle and the apex, above the ending of the major anterior vein (Figure 2B). The efficiency can be controlled by visualizing the appearance of the grey color in the affected areas. If the infarcted area appears anterior and does not include the posterior wall, a new suture can be placed to the left of the first suture. The main root of LAD is always visible under the auricle18, and therefore does not present serious problems in detecting this part. However, the auricle presents the major risk of bleeding and needs to be handled carefully.
The procedure is limited by existence of appropriate equipment. A ventilator and appropriate anesthesia system for the small animals are expensive and require connections to gas and ventilation system of the room. Further, a close supervision of the animals is necessary in the first week after procedure to detect the possible clinical. To examine the heart function during the experiment, high-resolution ultrasound, complex Langendorf perfusion-system, or small intraventricular catheter measurements are required, involving high costs and additional expertise.
Considering the myocardial infarction, there is no alternative methods available to reproduce the complexity of the events in vitro. Depending on the point of interest, ex vivo perfusion of an isolated heart in Langendorff system provides information about the contractility, heart function and myocardial viability in response to different stimuli or drugs. However, it excludes all interferences of blood components and immune system, and it is not indicated for long-studies of remodeling and healing after myocardial infarction.
After performing the myocardial infarction procedure, all other functional analysis can be carried out, like intraventricular pressure measurements, ultrasound (small animal ultrasound systems) or isolated heart Langendorff-perfusion. Moreover, all biological and molecular analysis can be performed to identify cells, proteins, mRNAs, microRNAs, genes or other biomarkers, which can be used as therapeutic targets to develop new treatment strategies for myocardial infarction.
Disclosures
The authors have nothing to disclose.
Acknowledgements
This work was supported by Interdisciplinary Centre for Clinical Research IZKF Aachen (junior research group to E.A.L.) within the faculty of Medicine at RWTH Aachen University. We are grateful Dr. Rusu and Ashley Christina Vourakis for critical review of the manuscript and Mrs. Roya Soltan for the professional help with immunohistochemistry staining.
Materials
| Name | Company | Catalog Number | Comments |
|---|---|---|---|
| Stereomicroscope | Olympus | SZ/X9 | |
| Mouse ventilator | Harvard Apparatus | 730043 | Model Minient 845 |
| Dual Anesthesia System (Tabletop Version) | Harvard Apparatus | Selfcontained isofluranebased anesthesia unit for use on lab tables, with a compact 8" x 11" footprint. | |
| Intubation cannula | Harvard Apparatus | 732737 | |
| Forceps | FST, Germany | 9119700 | standard tip curved 0.17 mm x 0.1 mm |
| Scissors | FST, Germany | 9146011 | straight |
| Vannas scissor | Aesculap, Germany | OC 498 R | |
| Retractors | FST, Germany | 1820010 | 2.5mm wide |
| Retractors | FST, Germany | 1820011 | 5 mm wide |
| Wire handles | FST, Germany | 1820005 | 10 cm |
| Wire handles | FST, Germany | 1820006 | 14 cm |
| Ketamine 10% | CEVA, Germany | ||
| Xylazine 2% | Medistar, Germany | ||
| Bepanthene eye and nose cream | Bayer, Germany | ||
| Silicon tube | IFK Isofluor, Germany | custommade product | diameter 500 µm |
| section thickness 100 µm | |||
| polytetrafluorethylene catheter | |||
| PROLENE Suture 6/0 | ETHICON | 8707H | polypropylene monofilament suture, unresorbable, needle CC1, 13 mm, 3/8 Circle |
| 7/0 Silk | Seraflex | IC 1005171Z | |
| Ultrasound | Vevo, Canada | 770 Vevo |
References
- Liehn, E. A., Postea, O., Curaj, A., Marx, N. Repair after myocardial infarction, between fantasy and reality: the role of chemokines. J Am Coll Cardiol. 58 (23), 2357-2362 (2011).
- Liehn, E. A., Radu, E., Schuh, A. Chemokine contribution in stem cell engraftment into the infarcted myocardium. Curr Stem Cell Res Ther. 8 (4), 278-283 (2013).
- Alexander, S., et al. Repetitive transplantation of different cell types sequentially improves heart function after infarction. J Cell Mol Med. 16 (7), 1640-1647 (2012).
- Liehn, E. A., et al. Compartmentalized protective and detrimental effects of endogenous macrophage migration-inhibitory factor mediated by CXCR2 in a mouse model of myocardial ischemia/reperfusion. Arterioscler Thromb Vasc Biol. 33 (9), 2180-2186 (2013).
- Liehn, E. A., et al. Ccr1 deficiency reduces inflammatory remodelling and preserves left ventricular function after myocardial infarction. J Cell Mol Med. 12 (2), 496-506 (2008).
- Liehn, E. A., et al. A new monocyte chemotactic protein-1/chemokine CC motif ligand-2 competitor limiting neointima formation and myocardial ischemia/reperfusion injury in mice. J Am Coll Cardiol. 56 (22), 1847-1857 (2010).
- Liehn, E. A., et al. Double-edged role of the CXCL12/CXCR4 axis in experimental myocardial infarction. J Am Coll Cardiol. 58 (23), 2415-2423 (2011).
- Oral, H., et al. CXC chemokine KC fails to induce neutrophil infiltration and neoangiogenesis in a mouse model of myocardial infarction. J Mol Cell Cardiol. 60, 1-7 (2013).
- Projahn, D., et al. Controlled intramyocardial release of engineered chemokines by biodegradable hydrogels as a treatment approach of myocardial infarction. J Cell Mol Med. 18 (5), 790-800 (2014).
- Schuh, A., et al. Novel insights into the mechanism of cell-based therapy after chronic myocardial infarction. Discoveries. 1 (2), e9(2014).
- Schuh, A., et al. Effect of SDF-1 alpha on Endogenous Mobilized and Transplanted Stem Cells in Regeneration after Myocardial Infarction. Curr Pharm Des. 20 (12), 1964-1970 (2013).
- Zaragoza, C., et al. Animal models of cardiovascular diseases. J Biomed Biotechnol. 2011, 497841(2011).
- Kanzler, I., Liehn, E. A., Koenen, R. R., Weber, C. Anti-inflammatory therapeutic approaches to reduce acute atherosclerotic complications. Curr Pharm Biotechnol. 13 (1), 37-45 (2012).
- Liehn, E. A., Zernecke, A., Postea, O., Weber, C. Chemokines: inflammatory mediators of atherosclerosis. Arch Physiol Biochem. 112 (4-5), 229-238 (2006).
- Kolk, M. V. V., et al. LAD-Ligation: A Murine Model of Myocardial Infarction. J. Vis. Exp. (32), 1438(2009).
- Ryu, J. H., et al. Implantation of bone marrow mononuclear cells using injectable fibrin matrix enhances neovascularization in infarcted myocardium. Biomaterials. 26 (3), 319-326 (2005).
- Frobert, A., Valentin, J., Cook, S., Lopes-Vicente, J., Giraud, M. N. Cell-based Therapy for Heart Failure in Rat: Double Thoracotomy for Myocardial Infarction and Epicardial Implantation of Cells and Biomatrix. J. Vis. Exp. (91), e51390(2014).
- Xu, Z., Alloush, J., Beck, E., Weisleder, N. A Murine Model of Myocardial Ischemia-reperfusion Injury through Ligation of the Left Anterior Descending Artery. J. Vis. Exp. (86), e51329(2014).
Reprints and Permissions
