High-density electroencephalography (dEEG) is being used increasingly to study brain development and plasticity in the early years of life. Here we present an application of sophisticated analysis techniques that builds on traditional EEG recording to understand the oscillatory dynamics of rapid auditory processing in the infant brain.
Method Article
Infant Auditory Processing and Event-related Brain Oscillations
In This Article
Summary
Abstract
Rapid auditory processing and acoustic change detection abilities play a critical role in allowing human infants to efficiently process the fine spectral and temporal changes that are characteristic of human language. These abilities lay the foundation for effective language acquisition; allowing infants to hone in on the sounds of their native language. Invasive procedures in animals and scalp-recorded potentials from human adults suggest that simultaneous, rhythmic activity (oscillations) between and within brain regions are fundamental to sensory development; determining the resolution with which incoming stimuli are parsed. At this time, little is known about oscillatory dynamics in human infant development. However, animal neurophysiology and adult EEG data provide the basis for a strong hypothesis that rapid auditory processing in infants is mediated by oscillatory synchrony in discrete frequency bands. In order to investigate this, 128-channel, high-density EEG responses of 4-month old infants to frequency change in tone pairs, presented in two rate conditions (Rapid: 70 msec ISI and Control: 300 msec ISI) were examined. To determine the frequency band and magnitude of activity, auditory evoked response averages were first co-registered with age-appropriate brain templates. Next, the principal components of the response were identified and localized using a two-dipole model of brain activity. Single-trial analysis of oscillatory power showed a robust index of frequency change processing in bursts of Theta band (3 - 8 Hz) activity in both right and left auditory cortices, with left activation more prominent in the Rapid condition. These methods have produced data that are not only some of the first reported evoked oscillations analyses in infants, but are also, importantly, the product of a well-established method of recording and analyzing clean, meticulously collected, infant EEG and ERPs. In this article, we describe our method for infant EEG net application, recording, dynamic brain response analysis, and representative results.
Introduction
Across a wide spectrum of developmental disorders, it is becoming increasingly clear that the key to early identification and ultimately remediation lies in understanding the early mechanisms that come into play as the developing brain assembles functional networks. Thus, there is increased interest in understanding the temporal dynamics of neural patterns that impact cognition. In particular, specific cognitive functions to be differentially correlated with oscillatory activity in specific frequency bands (e.g., cyclic fluctuations single-cell or population membrane potentials) 1. Previous studies have established that oscillatory dynamics play a crucial role in the activity-dependent self-organization of developing networks2-4, control neuronal excitability5,6 and integrate sensory inputs7,8. Oscillatory brain activity is thought to be metabolically beneficial9,10, increasing the efficiency of a variety of sensory processing functions and coordination of higher-level functions such as cognition and language. However, systematic investigation of the role of neural synchrony across age and links with behavioral outcomes in human infants has yet to be accomplished. An important step toward this objective is to achieve a deeper understanding of the emergence and maturation of the temporal dynamics and oscillatory mechanisms that support developing cognitive processes including early language.
A crucial component of language development is the ability to accurately process and categorize acoustic signals that change rapidly: often on the order of as little as tens of milliseconds. For example, the acoustic dynamics of the words “dad” and “bad” differ acoustically only over the first 40 msec of the syllable, yet the two have very different meanings and associations. Previous studies show a maturational trajectory of receptive ability for acoustic and linguistic differences. As early as 2 months of age, infants show the ability to discriminate rapid frequency changes (e.g., < 100 msec); suggesting that the “hardware” for detecting the difference between two acoustically similar syllables is in place. Over the next few months, babies can discriminate increasingly smaller differences, develop categorical perception, and exhibit cortical specialization for sounds of the native language syllables11-14. Because complex sound perception relies on the function of basic processing mechanisms, it is thought that deficits in the ability to perceive rapidly changing acoustic differences – even for simple sounds such as tones – may be early indicators15 of later language impairment.
Previous work from Choudhury and Benasich in this laboratory strongly supports this hypothesis, showing that an infant’s ability to process very rapid changes in simple sounds (e.g., tones) can predict 3- and 4-year language and cognitive abilities16,17. These data verify that the brain responses of pre-lingual infants can provide a quantifiable indicator of auditory processing and developmental progress. The study and methods presented here probe key aspects of the underlying mechanism of this relationship. Several lines of research now indicate that peak latency and amplitude of ERP waves arise from the summation of spectrotemporal dynamics in EEG oscillations of multiple generators18-23. Spectrotemporal analysis also allows the separation of phase and power information. Phase-locked activity reflects the part of the neuronal response that is evoked by the stimulus. This type of information is similar to what can be extracted from the ERP, since responses are averaged relative to a time-locked event. However, the timing of some neuronal activity may vary from trial to trial. In ERP analysis, this activity is “averaged out”; however in analysis of power changes from trial to trial, this information can be recovered and analyzed. Therefore, spectrotemporal analysis of phase and power may give additional information about the neuronal response, relative to the conventional ERP. Regarding infant development, there is considerable evidence that oscillations contribute to the development of neural circuits in animal models2,3 but these mechanisms are only beginning to be investigated in the human population. Work from this laboratory has shown theta and gamma oscillatory correlates of native language specialization at 6-months24. This highlights the functionality of oscillatory hierarchies in infancy.
The global hypothesis, based on the evidence presented above, is that synchrony of evoked oscillations in auditory cortices supports infant brain development. As a first step in testing this hypothesis, a “baseline” of processing in early infancy was obtained; namely, 4-months-of-age, which is currently thought to precede “perceptual narrowing” for native language specialization25,26. Accordingly, we performed single-trial frequency analysis on infant EEG data recorded during passive listening to pitch-variant and pitch-invariant tone pairs presented in an “oddball paradigm” consisting of two rate conditions (Control condition: 300 msec inter-stimulus interval; Rapid condition: 70 msec inter-stimulus-interval).
Here we illustrate this method using stimuli from studies focusing on rapid auditory processing. In these studies, an “oddball paradigm”, was used to assess neuronal activity to unpredictable, but recognizable events. In this paradigm, the brain response to unpredictable or “odd” stimuli are often called “Deviant” responses, whereas the response for the predictable stimulus, presented most of the time, is usually called the “Standard” brain response. Responses to stimuli presented in an oddball paradigm can be automatically elicited without focused attention, making this paradigm easy to use with very young infants. All of the auditory stimuli are presented via free-field speakers at intervals, which vary depending on the study. As mentioned previously, in the current study sounds that index rapid auditory processing (RAP) abilities were used: that is, sounds containing tens-of-milliseconds of acoustic change16,17,27,28. It may be noted that many other stimulus types are useful for testing neurophysiological discrimination, including consonant-vowel (CV) sounds as well as deviants reflecting changes in Frequency or Duration, with an interposed Gap, and/or ascending or descending frequency Sweeps. Finally, we also recommend recording spontaneous EEG during “quiet play” in which no auditory stimulus is presented. These data may then be used to measure oscillatory coupling and coherence in the absence of repeated stimulation.
Recording EEG activity from an infant population poses a set of unique challenges. For example, cooperation with placement of the electrodes and leaving them in place for the duration of the experiment, minimizing movement to prevent EEG artifacts, and keeping the baby engaged and distracted with silent toys all represent challenges. Additionally, infant data do not easily lend themselves to straightforward applications of protocols developed with adult/older child data. In many instances the relationship between components observed in infant EEG and event-related potentials (ERPs) is not as clear cut nor does it always map on to what is accepted in the adult. While developmental research holds a powerful potential for understanding the genesis of typical and disordered brain function, recording reliable and interpretable brain responses from human infants requires a high level of proficiency in both technical and interpersonal realms. These challenges, however, can be overcome and reliable EEG and ERP data can be recorded from infants of different ages using a variety of paradigms. Here we describe a general method of analysis utilizing commercially available ERP recording and analysis software in combination with a free, open-source ERP analysis package that works in the MATLAB environment29.
The application of oscillatory analysis methods to infant brain response recordings allows exploration of more mechanistic questions of neuronal synchrony development in relation to language acquisition and putative underlying mechanisms when that synchrony is compromised. Related efforts using other stimuli, such as speech syllables24, and analysis of spontaneous or “resting” oscillations1 in longitudinal analyses or in combination with early training paradigms, offer windows into the temporal, spatial, and spectral dynamics of typical and disordered developmental trajectories. It is hoped that these efforts will increase our understanding of the bases of auditory development and plasticity, and aid in identification and remediation strategies for developmental language disorders.
Protocol
All work with human subjects requires Institutional Review Board approval and oversight. Methods reported here, when used in research, have been reviewed and approved by the Human Subjects Protection Program through the Rutgers Arts and Sciences Institutional Review Board (IRB).
1. Preparation
- Schedule the baby for 1 hr of testing in a sound-attenuated and electrically-shielded chamber. The study protocol presented in this article that produced representative data includes 20 - 30 min of EEG testing.
- Allocate three people per testing session: one “primary tester”, one “net assistant” and one “entertainer”.
- For high-density infant EEG recording, use at least a 64-channel net. For the representative data presented here, a 128-channel sensor net was used.
2. Net Application
- Set up the following supplies in the recording chamber: Coban self-adherent wrap tape, measuring tape, marking pen, 2 towels, and pipettes. Calibrate sounds to testing level (e.g., dB SPL, HL, etc.).
- Make the electrolyte solution (distilled water, Potassium Chloride and baby shampoo) well before estimated family arrival time. To ensure that the net is not too cold on the baby’s head, warm 8 ounces of water to be added to the solution just before application.
- When the family arrives, obtain consent with IRB approved forms.
- In the testing chamber, sit the infant on the caregiver’s lap, and have the entertainer begin to play with the infant. If it is the first visit, explain the net application procedure.
- Measure the infant’s head circumference at the widest point of the head and choose the net size based on this measurement. To obtain the best fit, choose a smaller-sized net if the circumference is close to the minimum size for one age. Submerge the chosen net in the electrolyte solution.
- Measure nasion-to-inion and mark the scalp at ½ of the total measurement. Do the same for the ear-to-ear measurement. The final mark is Cz (vertex).
- Remove excess solution from the net by placing it on a dry towel. Have the net assistant invert the net and grasp the Cz electrode; holding the net so that the primary tester can position their fingers at the front of the net.
- Flip the net over and place the net on the infant head as the net assistant moves the chinstrap and colored front threads (connecting the nasion electrode and chinstrap) outside of the net.
- Adjust the net position on the infant’s head, placing Cz at the vertex scalp mark. Position/align each of the electrodes starting from the back and working toward the front, making sure that there is a right angle between each electrode and the head surface.
- Collect the wires, adjust the chinstrap, secure wires with Coban tape, and plug in the net connector.
- Measure the electrode impedance with a threshold of < 50 KOhms, or according to system instructions. If some electrodes have high impedance, re-soak the electrode with an electrolyte-filled pipette and gently move the hair from beneath the electrode.
3. Stimuli Presentation and EEG Recording
- Present auditory stimuli in free-field with speakers equidistant from the infant’s head.
NOTE: The representative study stimulus parameters were as follows: 70 msec tone-pairs with a fundamental frequency of either 800 or 1,200 Hz and 15 harmonics (6 dB roll-off per octave) are presented in two blocks (70 or 300 msec inter-stimulus interval). The low-high pairs (800 Hz - 1,200 Hz) are presented as deviants (15% = 125 trials) among low-low (800 Hz - 800 Hz) standards (85% = 708 trials). - Record the EEG according to hardware and software instructions. Use the following parameters for the representative data: Sampling rate: 250 Hz, Low-pass Hardware filter: 100 Hz, Elliptical, High-pass filter: 0.1 Hz, Auto: set to Nyquist, Board gain: 1.
- Provide a calm, quiet, mildly engaging environment for the infant during recording. Engage the infant by playing an age-appropriate silent video or with quiet toys (e.g., blow bubbles, point to pictures in books, puppet play). Providing the caregiver with earphones to listen to music avoids inadvertent caregiver interference with the infant response. If the infant is restless, impacting the EEG, pause stimulus presentation and EEG recording until a calm environment can be restored.
- After the experiment is completed, gently remove the net and dry the infant’s hair and head.
- Save and backup the raw, unfiltered EEG data before closing the programs at the end of the testing session.
4. Data Processing - ERPs
Visually inspect the raw EEG data and reject segments with high-amplitude artifact.
NOTE: Reject channels with high amplitude and interpolate. Maximum percent of rejected channels should be set at 30%. Alternative methods (e.g., ICA, PCA, see also reference 30) may be employed to reduce or reject artifacts present in the data.
- Filter the data with pre-established parameters that accord with cortical activity. For infants, use an off-line bandpass filter of 1 - 15 Hz.
- Segment the continuous data to create epochs around “Time 0” (stimulus onset) according to software instructions. For segmentation, include sufficient pre-stimulus time to establish baseline activity and post-stimulus time to capture the entire response.
- Reject noisy epochs according to an appropriate rejection criteria (e.g., +/- 200 µV for infants). Set maximum percent of rejected epochs at 30%.
- Average the epochs for each individual and each condition and combine these averages according to group and condition for grand averages.
- If the number of epochs contained within each average varies across subjects, weight the number of epochs so that subjects with more/less epochs are equally valued.
- To weight the grand average, calculate the individual average from each condition as n times the waveform, where n equals the number of epochs that comprise the average, then divided by the total number of epochs for all subjects. This method gives each trial equal weight in the final average.
5. Data Processing – Source Localization
For infant data, co-register each individual and grand average ERP file with either an age-appropriate MR template or an individual MR scan (refer to previous publications 31,32).
NOTE: In the co-registration process, the electrode positions and reconstructed head are registered into a single coordinate system. Grand averages may be used to define the dipole model.
Estimate the number and location of underlying sources to be fitted to the data. For an auditory paradigm, use two dipoles with free location and rotation.
NOTE: Source estimation is then automatically guided through a minimization of a cost function that is a weighted combination of 4 residual fit criteria to obtain the “best fit” location to the time window of interest.
- Make sure age-appropriate parameters are used for scalp thickness, skull thickness, width of the subarachnoid space and bone conductivity as these factors change rapidly during development. For the representative data, parameters are: skull: 1.5 mm; scalp: 2.5 mm; subarachnoid space: 1.7 mm; bone conductivity: 0.0581.
- Beginning with a grand average ERP, choose a time window of interest corresponding to a peak. Conservative parameters are typically +/- 20 msec around the peak of interest 31.
- Check the “goodness of fit” for the dipole solution using the software outputs of residual variance. This is the amount of signal that remains unexplained on the given time window of fit by the current dipole model. Adjust the time window to minimize the residual variance. Use a distributed source model (CLARA) to check the solution within the extended activity region.
- Save the dipole-source solution and waveforms for each condition and peak.
- Repeat the procedure for every individual average file.
- For statistical analysis of source location, use values of peak latency, amplitude, and location coordinates in the X (medial-lateral), Y (anterior-posterior), and Z (superior-inferior) directions for each dipole from each individual average file solution. In the case presented here, 2X2 Repeated measures ANOVA (Stimulus (standard, deviant) X Hemisphere (Left, Right) for the amplitude and latency of the sources can be useful to look at strength and timing of the generators. Source coordinates can be evaluated in the same way (for review, 31,32).
6. Data Processing – Time-Frequency Analysis in Source Space
- Apply the dipole model solution to the raw, unfiltered, continuous EEG data.
- Apply the source solution (saved in step 5.6.) to the raw EEG data file as a virtual electrode montage.
NOTE: The use of the dipole model in this way applies a fixed spatial filter onto the surface channel recording (sensor space) to transform the continuous high-density EEG into a virtual 2-source montage (brain source space).
- Apply the source solution (saved in step 5.6.) to the raw EEG data file as a virtual electrode montage.
- Transform the time-domain single-trial source signal into the time-frequency-domain (Figure 1).
NOTE: Currently, several approaches can be utilized to transform single-trial data into the time-frequency domain, including wavelet analysis and application of a Hilbert transform to filtered data. While a comparison of these methods is outside the scope of this article, several published articles have thoroughly described these methods 33-36. The time-frequency analysis using the complex demodulation procedure found in a commercially available coherence software program 37, calculates the instantaneous envelope amplitude and phase of each brain activity as a function of frequency and time 37-39. This produces measures of instantaneous power shifts (Temporal Spectral Evolution, TSE) and phase-locking (Inter-trial Phase Locking, ITPL).- Use the following parameters: 1 Hz wide frequency bins from 2 to 80 Hz and 50 msec time resolution from -1,500 to 1,500 msec. The epoch time window should be long enough to allow filtering or processing at the lowest desired frequency without incurring artifacts 40,41.
- Visualize the frequency peaks of activity in EEG in order to avoid interpretation of possible spurious artifact-related or circular related oscillations 41,42.
- Perform permutation testing and cluster analysis to determine regions of significant differences across conditions and groups 24,43.
Results
Infant Event-related Potentials
Infant ERPs are generally larger than adult ERPs, and may have fewer or more peaks of activation, relative to mature responses, depending on the age 44. Here, we show representative Grand Average responses from twenty three 4-month-old infants 43 (Figure 2). The oddball paradigm allows us to determine whether the infant’s brain can recognize the difference between two events. In the representative results, the tone-variant, deviant response (DEV, 800-1,200Hz, red line) elicits an additional peak of activation, relative to the invariant tone pairs (STD, 800-800Hz, black line). This finding is apparent in both Control rate (300 msec ISI, left) and Rapid Rate (70 msec ISI, right) conditions. Example responses from electrodes of Fz (Frontal midline), C3 (Central, right) and C4 (Central, left) are shown. The computed difference wave (Deviant minus Standard) is also shown in gray lines. The additional peak of activation suggests that the infant brain at this age can discriminate the difference between the tones at both rate presentations.
Infant source waveforms
Source activity with little residual variance should follow the ERP peaks, signifying a “good fit” between the original data and the source localized transformed data. In the representative data, we show the location of the two-dipole best fit source model of the infant grand average ERP to the STD (tone-invariant) condition over the CLARA distributed model (Figure 3). The computation clearly shows left and right auditory activation in Control and Rapid Rate conditions.
Peaks of activity from the two-dipole model (Figure 4) corresponded to the ERP response very well. The peak timing and morphology of the ERP waveforms, shown in panel (i), match the timing and morphology of the source waveforms shown in panel (ii) (for more details, see original article, 43). Source waveforms from this experiment explained 97.9% of the variance in activity over the scalp electrodes. Statistical analysis of the source peak latencies showed that right hemisphere activity was faster than the left in both conditions, and responses in the rapid rate were later in both hemispheres than in the control condition. Hemispheric differences were not observed using the ERP data, suggesting that the source localization techniques enabled the retrieval of additional information from the responses.
Infant Event-related Oscillations
In general, time-frequency analyses of adult and animal data show that stimuli evoke a 1/f pattern of neuronal synchrony (e.g., decreasing power with increasing frequency). In the representative data, evoked by auditory tone pairs, we show that infants also express this pattern (Figure 5). Here, stimulus onset elicits synchronous bursts of theta (5-6 Hz), beta (20-25) Hz and gamma (35-45 Hz) power in both right and left auditory regions of the brain.
Animal models and adult experiments suggest that oscillatory synchrony, and in particular low- to mid-frequency oscillations (e.g., 1-8 Hz) are major contributors to evoked potentials 45. Analysis of instantaneous power shifts (Temporal Spectral Evolution, TSE) in infant oscillations from our previous publication 43 showed greater induced power to the variant tone in the theta band (6-8 Hz), relative to the invariant tone. This effect was observed in both rate conditions, particularly over the right auditory region in the Control rate condition (Figure 6). Rapid rate presentation yielded a more bilaterally symmetrical activity, suggesting enhanced left cortical involvement during auditory processing of rapidly occurring stimuli and in particular during acoustic change processing.
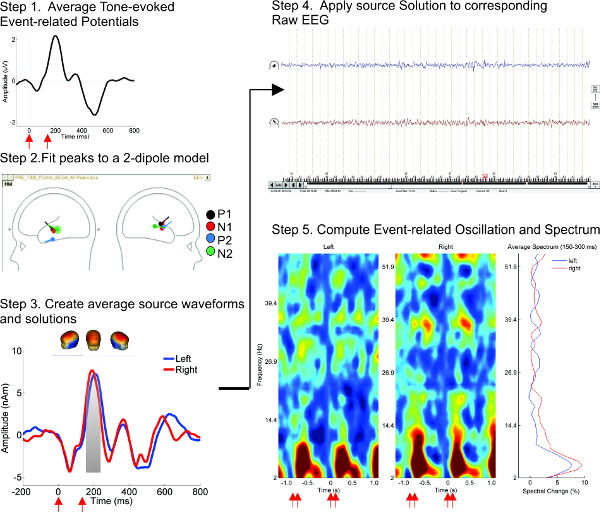
Figure 1. Steps of time-frequency analysis. Time-frequency analysis method is illustrated using grand average (n = 12) data from 4-month-old infants during the 70 msec ISI tone condition. Stimulus onsets are shown in red arrows beneath the time axis. Steps of analysis: (1) Averaged ERPs, shown in Cz electrode, are created for each channel. (2) Source location of ERP generators, shown in a sketch head, is obtained by using a 2-dipole model in data mapped onto an infant MRI template. (3) Individual and grand average source waveforms are obtained from the fit of the Left and Right dipoles. Infant head models show the voltage maps corresponding to the selected peak (in gray). (4) The source montage is applied to the 128 channel scalp data, and amplitudes are computed and saved for the two source channels. (5) Event related oscillations are calculated from single-trials and averaged over the response period. Please click here to view a larger version of this figure.
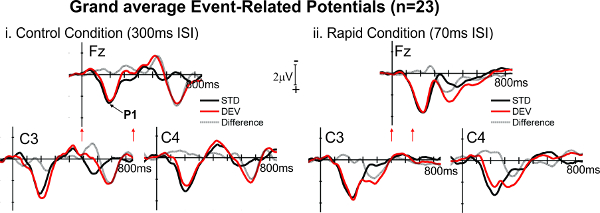
Figure 2. Event-related potential morphology. Grand Averages (n = 23) to Rapid (70 msec ISI) and Control (300 msec ISI) rate responses to standard (STD, black lines) and deviant (DEV, red lines) tone pairs are shown in frontal midline and central left and right electrodes. Negativity is plotted up. Stimulus onsets are shown in red arrows beneath the time axis at Fz. P1 is shown in the Fz panel with a black arrow. The difference wave (response to DEV minus response to STD) is shown in gray lines (Adapted from 43). Please click here to view a larger version of this figure.
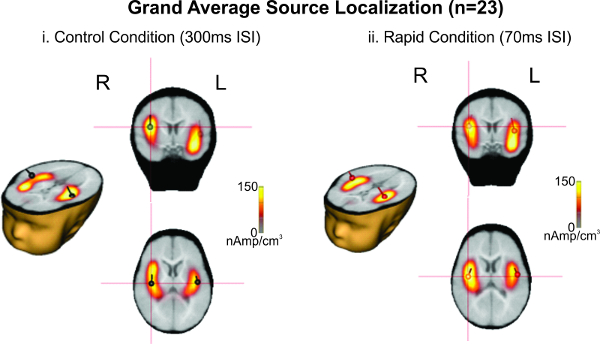
Figure 3. Source localization results. Two-dipole “best fit” source model is shown overlaid on distributed activity from the source model. Clear left and right activity can be seen over left and right temporal lobe regions. (Adapted from 43). Please click here to view a larger version of this figure.
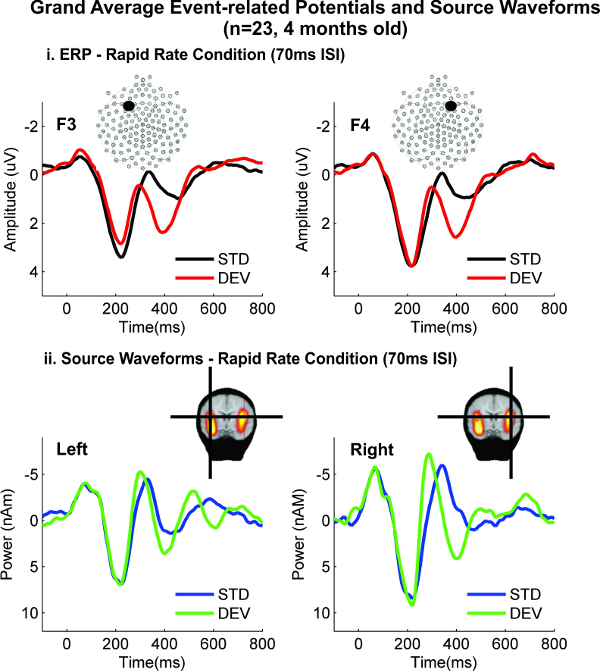
Figure 4. Event-related Potential and Source Waveform Comparison. (i) Example ERPs from frontal left and right electrodes (F3 and F4) show peaks of activation to tone pairs with invariant and variant fundamental frequencies (STD and DEV, respectively). A change in frequency elicits larger peaks ~ 400 msec (DEV, red line), relative to the when frequencies are unchanged (STD, black). (ii) The latency of peaks of activation is similar for the source-localized dipole activity, suggesting a good match between ERP and source waveform analysis. The large peak at 400 msec is particularly noticeable in the right hemisphere with the source-localized data. For simplicity, only the responses to the Rapid Rate condition are shown, however a similar match was also observed between ERP and source waveforms for the responses in the Control Rate condition. Please click here to view a larger version of this figure.
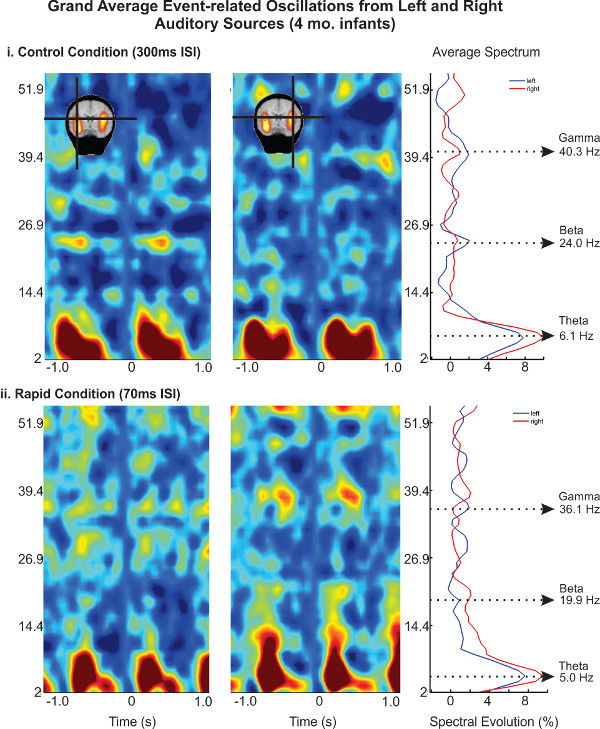
Figure 5. Pooled TSE maps are expressed in terms of percent spectral change over an epoch of -1 to 1 sec of time for left and right generators. (i) Tones in the 300 msec ISI condition elicit event-related oscillations in coherent frequency bands around stimulus onset (e.g., -1,140 msec and 0 msec). A long stimulus epoch is used in order to visualize more of the data and to provide a long enough sample for frequency decomposition. Right panel shows the average spectrum over the initial processing peak (150 - 300 msec). The average spectrum shows an overall 1/f spectrum with discrete peaks of synchrony at specific frequency bands. (ii) A similar pattern is observed for the 70 msec ISI condition. Please click here to view a larger version of this figure.
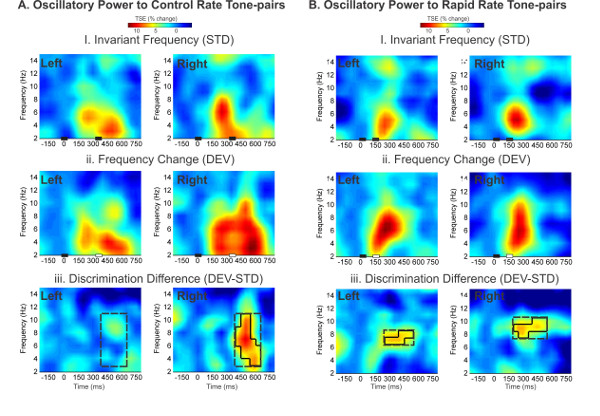
Figure 6. Time-frequency analysis of event-related oscillations in 4 month-old infants. Change in oscillatory power is shown inTemporal Spectral Evolution (TSE) grand average plots for 4-month-old infants in the Control (A) and Rapid Rate (B) conditions. Black bars on the x-axis illustrate tone onset and durations. Left and Right source activity is indicated in the top left corner of each graph. First row: (i) Responses to tone pairs with invariant frequency (STD) show power changes in the delta-theta range. Middle row: (ii) Responses to tone pairs with a frequency change in the second tone (DEV) show enhanced delta-theta power at the second tone, relative to STD responses, particularly in the Right auditory region in the Control condition. Third row: Difference plots between STD and DEV responses show a right lateralized increase in power in the Control Rate (A.iii) and bilateral power difference in the Rapid Rate (B.iii). Significant differences between STD and DEV response in the time-frequency domain are shown in black outline. (Adapted from 43). Please click here to view a larger version of this figure.
Discussion
The research method described here describes how to facilitate a deeper understanding of spectrotemporal dynamics and anatomical location of high-density auditory-evoked EEG and ERP brain responses in infants. There are four critical steps within this protocol that facilitate analysis. First, proper net application and positioning with minimal caregiver and infant distress is the foundation for recording clean EEG in non-sedated paradigms. Proper head measurement and net size selection as well as the use of a net assistant and entertainer during the application process is key to accomplishing this step. Second, it is important to establish a calm, quiet and playful atmosphere for the family during the testing session, a condition facilitated by the primary tester, net assistant and the entertainer, who engages the infant in quiet play. Third, for data analysis, it is critical that age-appropriate MRI head models be used for source localization. The head size, bone and skin and cerebrospinal space must be accurate for the age tested in order to obtain the most precise localization results. Finally, for cortical responses in general, it is also critical that a high-density net be used (e.g., at least 64 channels of data) in order to optimize the chances of obtaining low-artifact recordings.
One limitation of this technique is that source localization of EEG data is not the gold standard for site of activity tests. One must keep in mind that the forward model of localization even with the best head models and measurements are still estimates of activity location. Therefore, it is essential to design the experiment in such a way that information regarding source activity may be compared across experimental conditions or groups. In addition, infant testing in general and in particular, longitudinal study may be fraught with incomplete or missing data sets. Solutions to this problem are to a) maintain relationships with participating families; b) optimize a quiet, calm recording atmosphere for the infant and caregiver; and c) overestimate the subject pool. In our hands, with an experienced pediatric team, we have attained low dropout and minimal data loss rates. In a longitudinal sample of 211 infant recording sessions with 57 participants we show 98.6% data retention (e.g., 208 sessions that resulted in usable data) and a 10% drop out rate (e.g., 6 participants were unable to continue after beginning the experiment). An advantage of EEG over other techniques, such as MEG and NIRS, is that subcortically biased activity is accessible with different filter bands. In addition, it is easier to control for movement as the electrodes travel with the head.
Once this protocol is mastered, the experimental applications of infant EEG and oscillatory dynamics are abundant. It is clear that we must first understand typically developing cortical networks in order to identify those that are atypically organized. This suggests the need for the creation of a model in which the integrity of early auditory processing mechanisms (including oscillations) plays a role in the generation and plasticity of sound representation as auditory experiences are incorporated and, ideally, learned. According to this model, nonlinguistic processing deficits may be associated with symptoms years, or in some cases decades, before formal diagnosis occurs.
Future investigations are needed to understand further details, including the function of frequency-band-specific oscillatory dynamics, cross-frequency phase coupling and regional inhibitory/excitatory patterns across early development. In addition, subcortical activity and testing in different states, such as sleep, are needed to give a more complete picture of typical development. We believe research with this technique will provide important insight into the process by which 'neurotypical' and atypical oscillatory dynamics organize and interact with emerging cognitive and language abilities.
Disclosures
The authors have no disclosures to acknowledge.
Acknowledgements
The authors gratefully acknowledge support for this research by the Elizabeth H. Solomon Center for Neurodevelopmental Research and NSF grant #SMA-1041755 to the Temporal Dynamics of Learning Center, an NSF Science of Learning Center. Special thanks are also due to the families who participated, and to the members of the Infancy Studies Laboratory for their practical and intellectual contributions. Special thanks to Jarmo Hämäläinen for development of the source localization protocol and to Naseem Choudhury for her intellectual input.
Materials
| Name | Company | Catalog Number | Comments |
|---|---|---|---|
| EEG Amplifiers | EGI | 1301281 | |
| Sensor Nets | EGI | C-GSN-128-1011-110 | Sizes of nets vary with age, by month |
| EEG Recording Software | Net Station | 4604200 | |
| Presentation Computer | Dell | 4608161 | |
| Presentation Software | Eprime | 13102456-50 | |
| Baby bottle warmer | Avent | Target or any baby store | |
| Electrolyte solutuion (Potassium Chloride dry) | EGI | A-A-CC-KLL-1000-000 | |
| Coban self-adherent wrap tape | Coban | 595573 | |
| Measuring tape | Target or any baby store | ||
| Washable Markers | Target or any baby store | ||
| Pipettes | Comes with EGI amplifier setup | ||
| Analysis Computer | Dell | ||
| Analysis Software I | BESA | 3955054 | v5.3 |
| Analysis Software II | Brain Voyager | 3955054 | |
| Analysis Software III | EEGLAB/ERPLAB/ MassUnivariate Toolbox | Freeware MatLAB v2007b | |
| Analysis Software IV | BESA Statistics | 3956341 |
References
- Gou, Z., Choudhury, N., Benasich, A. A. Resting frontal gamma power at 16, 24 and 36 months predicts individual differences in language and cognition at 4 and 5 years. Behavioural brain research. 220, 263-270 (2011).
- Uhlhaas, P. J., Roux, F., Rodriguez, E., Rotarska-Jagiela, A., Singer, W. Neural synchrony and the development of cortical networks. Trends in cognitive sciences. 14, 72-80 (2010).
- Singer, W. Development and plasticity of cortical processing architectures. Science. 270, 758-764 (1995).
- Singer, W. Mechanisms of experience dependent self-organization of neuronal assemblies in the mammalian visual system. Archivos de biologia y medicina experimentales. 16, 317-327 (1983).
- Lakatos, P., et al. An oscillatory hierarchy controlling neuronal excitability and stimulus processing in the auditory cortex. Journal of neurophysiology. 94, 1904-1911 (2005).
- Jacobs, J., Kahana, M. J., Ekstrom, A. D., Fried, I. Brain oscillations control timing of single-neuron activity in humans. The Journal of neuroscience. 27, 3839-3844 (2007).
- Schroeder, C. E., Lakatos, P. Low-frequency neuronal oscillations as instruments of sensory selection. Trends Neurosci. 32, 9-18 (2009).
- Schroeder, C. E., Lakatos, P., Kajikawa, Y., Partan, S., Puce, A. Neuronal oscillations and visual amplification of speech. Trends in cognitive sciences. 12, 106-113 (2008).
- Basar, E. Oscillations in 'brain-body-mind'-A holistic view including the autonomous system. Brain Res. 1235, 2-11 (2008).
- Buzsaki, G. Large-scale recording of neuronal ensembles. Nature. 7, 446-451 (2004).
- Aslin, R. N. Discrimination of frequency transitions by human infants. The Journal of the Acoustical Society of America. 86, 582-590 (1989).
- Eilers, R. E., Morse, P. A., Gavin, W. J., Oller, D. K. Discrimination of voice onset time in infancy. The Journal of the Acoustical Society of America. 70, 955-965 (1981).
- Irwin, R. J., Ball, A. K., Kay, N., Stillman, J. A., Rosser, J. The development of auditory temporal acuity in children. Child development. 56, 614-620 (1985).
- Jusczyk, P. W., Pisoni, D. B., Walley, A., Murray, J. Discimination of relative onset time of two-component tones by infants. The Journal of the Acoustical Society of America. 67, 262-270 (1980).
- Bishop, D. V. M., Hardiman, M. J., Barry, J. G. Auditory Deficit as a Consequence Rather than Endophenotype of Specific Language Impairment Electrophysiological Evidence. Plos One. 7, e35851(2012).
- Benasich, A. A., et al. The infant as a prelinguistic model for language learning impairments: Predicting from event-related potentials to behavior. Neuropsychologia. 44, 396-411 (2006).
- Choudhury, N., Benasich, A. A. Maturation of auditory evoked potentials from 6 to 48 months: prediction to 3 and 4 year language and cognitive abilities. Clinical neurophysiology : official journal of the International Federation of Clinical Neurophysiology. 122, 320-338 (2011).
- Lakatos, P., et al. Timing of pure tone and noise-evoked responses in macaque auditory cortex. Neuroreport. 16, 933-937 (2005).
- Shah, A. S., et al. Neural dynamics and the fundamental mechanisms of event-related brain potentials. Cerebral cortex. 14, 476-483 (2004).
- Fries, P. A mechanism for cognitive dynamics: neuronal communication through neuronal coherence. Trends Cogn Sci. 9, 474-480 (2005).
- Buzsaki, G. Rhythms of the Brain. , Oxford University Press. New York. (2006).
- Buzsaki, G., Draguhn, A. Neuronal oscillations in cortical networks. Science. 304, 1926-1929 (2004).
- Whittingstall, K., Logothetis, N. K. Frequency-band coupling in surface EEG reflects spiking activity in monkey visual cortex. Neuron. 64, 281-289 (2009).
- Ortiz-Mantilla, S., Hämäläinen, J. A., Musacchia, G., Benasich, A. A. Enhancement of gamma oscillations indicates preferential processing of native over foreign phonemic contrasts in infants. The Journal of neuroscience : the official journal of the Society for Neuroscience. 33, 18746-18754 (2013).
- Palmer, S. B., Fais, L., Golinkoff, R. M., Werker, J. F. Perceptual narrowing of linguistic sign occurs in the 1st year of life. Child. 83, 543-553 (2012).
- Werker, J. F., Tees, R. C. Speech perception as a window for understanding plasticity and commitment in language systems of the brain. Dev Psychobiol. 46, 233-251 (2005).
- Benasich, A. A. Impaired processing of brief, rapidly presented auditory cues in infants with a family history of autoimmune disorder. Developmental neuropsychology. 22, 351-372 (2002).
- Benasich, A. A., Tallal, P. Infant discrimination of rapid auditory cues predicts later language impairment. Behavioural brain research. 136, 31-49 (2002).
- Lopez-Calderon, J., Luck, S. J. ERPLAB: an open-source toolbox for the analysis of event-related potentials. Front Hum. Neurosci. 8, 213(2014).
- Delorme, A., Sejnowski, T., Makeig, S. Enhanced detection of artifacts in EEG data using higher-order statistics and independent component analysis. NeuroImage. 34 (4), 1443-1449 (2007).
- Hämäläinen, J. A., Ortiz-Mantilla, S., Benasich, A. A. Source localization of event-related potentials to pitch change mapped onto age-appropriate MRIs at 6 months of age. NeuroImage. 54, 1910-1918 (2011).
- Ortiz-Mantilla, S., Hämäläinen, J. A., Benasich, A. A. Time course of ERP generators to syllables in infants: A source localization study using age-appropriate brain templates. NeuroImage. 59, 3275-3287 (2012).
- Canolty, R. T., et al. High gamma power is phase-locked to theta oscillations in human neocortex. Science. 313, 1626-1628 (2006).
- Delorme, A., Makeig, S. EEGLAB: an open source toolbox for analysis of single-trial EEG dynamics including independent component analysis. Journal of neuroscience. 134, 9-21 (2004).
- Delorme, A., et al. ERICA: new tools for advanced EEG processing. Computational intelligence and neuroscience. 2011, 130714(2011).
- Makeig, S. Auditory event-related dynamics of the EEG spectrum and effects of exposure to tones. Electroencephalography and clinical neurophysiology. 86, 283-293 (1993).
- Hoechstetter, K., et al. BESA source coherence: a new method to study cortical oscillatory coupling. Brain topography. 16, 233-238 (2004).
- Papp, N., Ktonas, P. Critical evaluation of complex demodulation techniques for the quantification of bioelectrical activity. Biomedical sciences instrumentation. 13, 135-145 (1977).
- Yoon, H., Yeom, W., Kang, S., Hong, J., Park, K. A multiple phase demodulation method for high resolution of the laser scanner. The Review of scientific instruments. 80, 056106(2009).
- Wang, Z., Maier, A., Leopold, D. A., Logothetis, N. K., Liang, H. Single-trial evoked potential estimation using wavelets. Comput Biol Med. 37 (4), 463-473 (2007).
- Kramer, M. A., Tort, A. B., Kopell, N. J. Sharp edge artifacts and spurious coupling in EEG frequency comodulation measures. J Neurosci Methods. 170 (2), 352-357 (2008).
- Kriegeskorte, N., Simmons, W. K., Bellgowan, P. S., Baker, C. I. Circular analysis in systems neuroscience: the dangers of double dipping. Nat Neurosci. 12 (5), 535-540 (2009).
- Musacchia, G., et al. Oscillatory support for rapid frequency change processing in infants. Neuropsychologia. 51, 2812-2824 (2013).
- Boer, T., Scott, L. S., Nelson, C. A. Infant EEG and Event-Related Potentials.Studies in Developmental Psychology. Hann, M. , Psychology Press. Washington D.C. 5-39 (2007).
- Basar, E., Schurmann, M., Demiralp, T., Basar-Eroglu, C., Ademoglu, A. Event-related oscillations are 'real brain responses' - wavelet analysis and new strategies. Int J Psychophysiol. 39, 91-127 (2001).
Reprints and Permissions
