Here we describe an optimized and efficient removal strategy for the collection of bio-particles present in ‘touch DNA’ samples, together with an enhanced amplification protocol involving a one-step 5 µl micro-volume lysis/STR amplification, to permit the recovery of short tandem repeat (STR) profiles of the bio-particle donor(s).
Method Article
Enhanced Genetic Analysis of Single Human Bioparticles Recovered by Simplified Micromanipulation from Forensic ‘Touch DNA’ Evidence
In This Article
Summary
Abstract
DNA profiles can be obtained from ‘touch DNA’ evidence, which comprises microscopic traces of human biological material. Current methods for the recovery of trace DNA employ cotton swabs or adhesive tape to sample an area of interest. However, such a ‘blind-swabbing’ approach will co-sample cellular material from the different individuals, even if the individuals’ cells are located in geographically distinct locations on the item. Thus, some of the DNA mixtures encountered in touch DNA samples are artificially created by the swabbing itself. In some instances, a victim’s DNA may be found in significant excess thus masking any potential perpetrator’s DNA.
In order to circumvent the challenges with standard recovery and analysis methods, we have developed a lower cost, ‘smart analysis’ method that results in enhanced genetic analysis of touch DNA evidence. We describe an optimized and efficient micromanipulation recovery strategy for the collection of bio-particles present in touch DNA samples, as well as an enhanced amplification strategy involving a one-step 5 µl microvolume lysis/STR amplification to permit the recovery of STR profiles from the bio-particle donor(s). The use of individual or few (i.e., “clumps”) bioparticles results in the ability to obtain single source profiles. These procedures represent alternative enhanced techniques for the isolation and analysis of single bioparticles from forensic touch DNA evidence. While not necessary in every forensic investigation, the method could be highly beneficial for the recovery of a single source perpetrator DNA profile in cases involving physical assault (e.g., strangulation) that may not be possible using standard analysis techniques. Additionally, the strategies developed here offer an opportunity to obtain genetic information at the single cell level from a variety of other non-forensic trace biological material.
Introduction
Touch DNA is a form of trace biological evidence which is the direct transfer of cellular material (e.g., shed skin cells) from an individual to an object or another individual during physical contact1. The ability to obtain DNA profiles from a variety of touched objects (documents, bedding, shoes, firearms, drinking containers, pens, briefcase handles) has been reported in the literature2-9.
A critical factor in the analysis of touch DNA evidence is the successful recovery of the trace biological material present. Touch DNA evidence is typically collected by swabbing the suspected area with a sterile cotton swab (referred to as “blind-swabbing”). Using this approach, the nature of the collected biological material is not known and sampling of a generalized area is performed. The presence of surface grooves or crevices may impede the successful recovery of the often already small amount of biological material present. Additionally, a ‘blind-swabbing’ approach will necessarily co-sample cellular material from the different individuals whose cells are present on the item, even if the individuals’ cells are located in spatially distinct locations on the item. The recovery of admixed DNA profiles, which are often challenging to resolve particularly with low template DNA samples, is frequently observed8,10,11 and in many instances will be a consequential artifact of the swabbing process itself. If only a small amount of material was present from one of the donors, standard extraction and analysis techniques may fail to recover a profile from the minor contributor. Additionally, the type of swab or whether it was used dry or wet (pre-moistened with sterile water) may influence the amount of biological material that is collected due to differences in absorptivity and adsorptivity and the efficiency of release of the biological material12. Standard extraction methods may result in additional sample loss due to required physical manipulation of the sample or sample transfer steps.
As described above, simple swabbing techniques for the recovery of biological material may result in the loss of trace amounts of biological sample as well as an increased occurrence of admixed profiles due to a failure to separate individual biological components. Therefore, we sought to develop more selective and efficient recovery strategies for collection of cellular microparticles present on touched objects. The developed strategy for the analysis of biological material from touch DNA evidence (referred to here as “bioparticles” due to the fact that a nucleus is not always visible since a majority of the cells found in the outer epidermal layer of skin are dead or dying keratinocytes13) involves the following: 1) collection of biological material (i.e., bioparticles) via gel-film from touched objects and surfaces, worn clothing items or direct human skin, 2) microscopic examination of the recovered biological material to ensure collection of potential human biological material, and 3) micromanipulation of single or few bio-particles using a water soluble adhesive, and 4) autosomal DNA-STR profiling of the collected bio-particles using a microvolume (5 µl) one-step lysis/amplification reaction.
This procedure offers numerous advantages over traditionally used analysis methods. Recovery of bioparticles using the gel-film permits a microscopic examination of the biological material present in the sample prior to analysis. While a majority of the bioparticles recovered from touch DNA evidence may not be nucleated cells making it more difficult to determine which or how many bio-particles should be selected, the microscopic examination of these samples prior to analysis provides to opportunity to search for nucleated cells thus maximizing the probability of DNA profile recovery. The collection of bioparticles using water soluble adhesive-assisted micromanipulation permits the direct transfer of targeted bioparticles into reaction tubes. This procedure is visualized under the microscope to ensure successful transfer of the biological material. The reduced or microvolume reaction increases sensitivity while reducing the cost of analysis per sample. This permits the analysis of increased numbers of samples from an individual piece of evidence. Due to the range in the genetic state of bio-particles in touch DNA evidence, multiple samplings from individual items are recommended.
Here, we demonstrate the successful use of the developed protocols to obtain highly probative genetic profiles of the donors of biological material in touch DNA evidence. The developed bioparticle collection and DNA profiling methods provide a comprehensive ‘smart’ (i.e., specific, measurable, attainable, realistic and timely) molecular based approach to the characterization, analysis and interpretation of trace biological material. While originally developed for application to forensic analysis of touch DNA evidence, the strategies developed here can be applied to other sources of biological material and offer an opportunity to obtain individual identifying information at the single cell level.
Protocol
NOTE: Body fluids were collected from volunteers using procedures approved by the University of Central Florida’s Institutional Review Board. Informed written consent was obtained from each donor.
1. Collection of Bioparticles from Touched Objects and Surfaces
- Cut the gel-film to the desired size. Ensure that it is the appropriate size for the glass microscope slide being used as the solid support. For example, for a 3” x 1” glass slide, use a gel-film size of 2” x 0.75”.
NOTE: The length and width of the material can be reduced, if desired, but should not exceed this size. - Remove the white backing from the gel-film and attach the gel-film to the microscope slide (Figure 1A). Press down firmly to ensure a complete attachment.
NOTE: There is a clear top protective layer that should not be removed to allow pressure to be applied along the piece of gel-film without contaminating the gel-film surface. Prepared gel-film slides (with protective layer attached) can be stored at room temperature until needed. - Remove the clear top protective film from the gel-film using sterile tweezers when ready to use (Figure 1B) the gel-film sample. Place the gel-film surface in direct contact with the desired touched object or surface (Figure 2). Apply a small amount of pressure to ensure efficient transfer of bio-particles to the gel-film.
NOTE: If too much pressure is applied, the glass slide could break.
NOTE: Multiple samplings from the same object or surface can be collected onto the same piece of gel-film. - Confirm the transfer of bio-particles onto the gel-film (Figure 3) by placing the slide on a stereomicroscope (trans- or epi-illumination can be used). Use magnification of ~20X for best viewing larger areas of the gel-film, and magnification of ~200X for best viewing individual bio-particles.
- Store the gel-film sample slide at room temperature in a covered slide box or use immediately for staining and/or bio-particle collection.
2. Optional Staining of Bioparticles to Aid in Visualization
- Place the gel-film sample slide prepared in Step 1 onto a slide-staining rack over a sink.
- Using a disposable transfer pipet, cover the entire gel-film surface with trypan blue stain (Figure 4A). Incubate at room temperature for 1-2 min.
- Remove excess stain by tilting the slide to allow the stain to drain off into the sink (Figure 4B).
NOTE: The slide can be rinsed by gentle flooding with sterile water using a disposable transfer pipet if needed (Figure 4C). - Allow the slide to air dry before proceeding to isolation of bio-particles. View the slide using a stereomicroscope (~20X for overall viewing and ~200-300X to view individual bioparticles) to ensure proper staining (Figure 4D-E).
NOTE: The slide can be stored at room temperature in a covered slide box.
3. Isolation of Bioparticles of Interest for Analysis
- Place the appropriate number of 0.2 ml PCR tubes in a rack and label the tubes appropriately.
- Prepare the STR amplification mix (see Materials List) in a designated PCR amplification hood or biosafety cabinet. Vortex the master mix well and briefly centrifuge in a mini-centrifuge.
- The volume of amplification mix needed per sample is 3.5 µl; prepare an appropriate volume of master mix for the desired number of samples.
- Pipet 3.5 µl of amplification mix into each 0.2 ml tube. Cap each tube loosely.
- Place a piece of double stick tape onto a clean glass microscope slide or directly onto a glass block.
NOTE: This will be used to hold the 0.2 ml tube in place during sample collection. - Place a piece of double stick tape onto a clean glass microscope slide. Place a piece of water-soluble wave solder tape on top of the double stick tape.
NOTE: This slide can be stored in a desiccator for future use. - Place the first 0.2 ml tube onto the double stick tape slide or block prepared in step 3.4. Set this tube aside until the sample is collected.
- Place the water-soluble wave solder tape slide under the microscope (low magnification). Using the tip of a tungsten needle, gently scrape the surface of the tape in order to collect a small amount (or “ball”) of adhesive at the end of the needle (Figure 5A).
NOTE: The size of the ball can be made small or large depending on the number of bioparticles that will be collected. - Carefully remove the tungsten needle with adhesive from under the microscope without disturbing the tip of the needle. The needle can be place in a rack if desired during sample placement.
- Place the prepared gel-film sample (from Steps 1 and 2) on the microscope stage. Adjust the focus and magnification until the bioparticles can be easily viewed. Identify the bio-particles that will be collected.
NOTE: A glass block can be used to support the slide if needed. - Retrieve the tungsten needle with adhesive ball, and place the needle over the gel-film surface where the bio-particles of interest are located. Press the tip of the needle (with adhesive) down so that it is in contact with the bio-particle (Figure 5B). Lift the needle up to ensure that the bio-particle has been collected. Repeat this process until the desired number of bio-particles has been collected.
- Place the prepared 0.2 ml PCR tube on the microscope stage. Adjust the magnification so that the bottom of the tube containing the amplification mix is in focus.
- Carefully insert the tungsten needle into the 0.2 ml PCR tube until the tip of the needle is in the amplification mix.
NOTE: This is best performed while viewing through the microscope. - Hold the needle in the amplification mix until the adhesive dissolves and the bioparticles are released into solution (Figure 5C). Remove the needle, place the 0.2 ml upright and loosely cap the tube.
- Repeat the collection procedure for additional samples. Clean the tungsten needle with pre-moistened alcohol (isopropanol) wipes in between samples.
4. Combined Microvolume Nucleic Acid Isolation (Direct Lysis) and Autosomal Short Tandem Repeat (STR) Profiling
- Prepare the lysis buffer (see Materials) in a designated PCR amplification hood or biosafety cabinet. Add 1.5 µl of the lysis buffer to each tube for a 5 µl total reaction volume. Close tube lids tightly.
NOTE: The 0.2 ml tubes already contain 3.5 µl of the amplification mix and the collection bio-particles from Step 3. - Place samples in the thermal cycler and amplify the samples using the following cycling conditions: 75 °C for 15 min; 95 °C for 11 min; 34 cycles of 94 °C for 20 sec and 59 °C for 3 min; 60 °C for 10 min; and 4 °C hold.
- Store amplification products at 4 °C for short term storage.
5. Product Detection – Capillary Electrophoresis (CE)
- In a 96 well plate, add 10 µl of CE running mix (9.7 µl deionized formamide and 0.3 µl size standard, see Materials). Add 1 µl of amplified product or allelic ladder to each well.
CAUTION: Formamide is a potential mutagen and should be handled in a chemical hood while wearing suitable personal protective equipment. - Use electrophoretic conditions specified by the manufacturer in the amplification kit manual or internally validated conditions.
- Analyze raw data with STR analysis software.
Results
Representative images of individual and clumped bioparticles that were recovered from a shirt collar (100% polyester) worn by a male donor are shown in Figure 6 (individual bioparticles) and Figure 7 (clumped bioparticles). The bioparticles were recovered from the shirt collar using the protocol described here: transfer of bioparticles from the shirt collar to gel-film through direct contact, staining of the recovered bioparticles with trypan blue, collection of bioparticle samples using a tungsten needle and water soluble adhesive and STR analysis using the 5 µl micro-volume lysis/STR amplification. Figures 6 and 7 represent a typical sampling of bioparticles that would be analyzed from an individual touch DNA item (20 single/individual bioparticles and 20 clumped bioparticles). The bioparticle(s) collected in each image are labeled with length and width measurements (in microns). The percentage of STR alleles recovered from each of the collected bioparticle(s) is provided on each individual image to demonstrate the variable degrees of success that can be expected to be obtained from bioparticles with this type of evidence. The bioparticles recovered from touch DNA samples are largely dead or dying keratinocytes and therefore a probative STR profile is not obtained from each bioparticle collected, as can be seen in Figures 6 and 7. For this shirt collar sample, STR profiles were obtained from 14/20 (70%) of the individual bioparticles and 15/20 (75%) clumped bioparticles. However, each of the recovered profiles ranges in probative value: 3-97% allele recovery for individual bioparticles profiles and 3-100% allele recovery for the clumped bioparticle profiles. Due to the variability in success rates, the collection of numerous bioparticles from each touch DNA item is recommended. This ensures a better chance of obtaining a highly probative STR profile.
The STR profile obtained from one of the individual bioparticle samples from the shirt collar is shown in Figure 8 (the bioparticle from which the profile originated is shown to the left). Almost a full STR profile (28 out of 30 alleles, one locus drop out, accuracy of the obtained profile verified by comparison to a reference profile) was obtained from this individual bioparticle. The obtained profile is of high quality with reasonably balanced inter-locus peak heights and no allelic drop out. Allelic drop out and unbalanced peak height artifacts are both frequently observed with low template DNA samples. The STR profile obtained from one of the clumped bioparticle samples from the shirt collar is shown in Figure 9. A full STR profile (30/30 alleles, accuracy of the obtained profile verified by comparison to a reference profile) was obtained. As mentioned previously, an STR profile is not recovered from every bioparticle collected. An example of unsuccessful DNA profiling of a single bioparticle (3% allele recovery, 1/30 alleles) is shown in Figure 10 (individual bioparticle). While this individual bioparticle was not successful, highly probative STR profiles of the donor of the bioparticles in this sample were obtained from other bioparticles recovered from the same sample. This illustrates the need to perform multiple single cell/clump samplings from the same object.
The developed “smart” analysis methods described here for touch DNA evidence have been used successfully to recover probative single source profiles from single and “clumped” bioparticles from various touched objects and clothing items (e.g., chair armrests, car steering wheels, cell phones, coffee cups, cigarettes, pens, shirts, shorts, and sweaters). However, importantly, this approach has also been used for the detection and profiling of male donor DNA (single source) in simulated physical contact/assault mixture samples (e.g., perpetrator grabbing a victim’s wrist, neck or clothing, or contact with victim’s bedding as in sexual assaults).
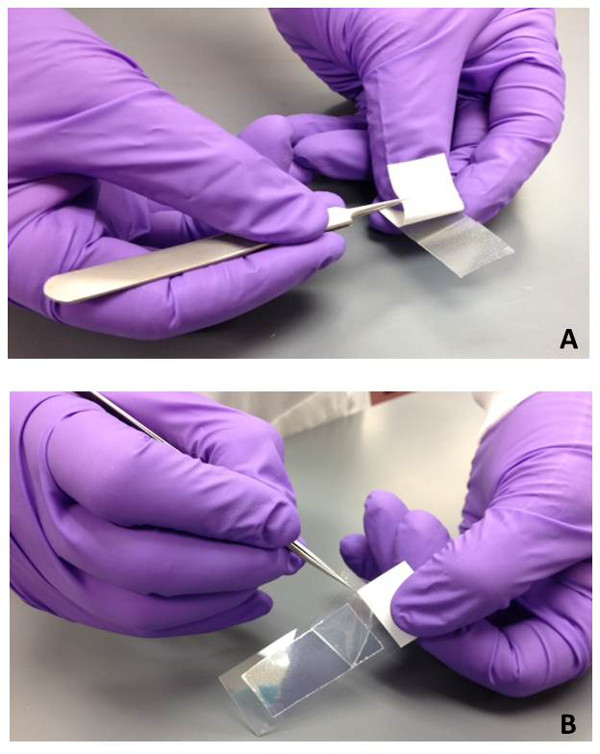
Figure 1: Preparation of gel-film slides for bioparticle collection. (A) The white back protective cover is removed using sterile tweezers from the piece of gel-film to expose the adhesive backing. The gel-film is then adhered to a glass microscope slide with firm pressure. (B) When the gel-film sample is ready to be used for bioparticle collection, the top clear protective film is removed using sterile tweezers.
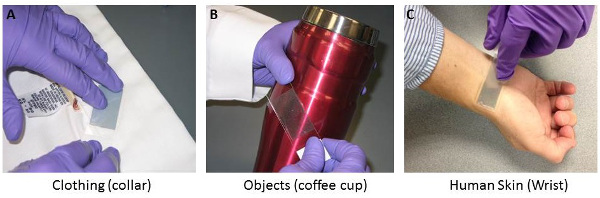
Figure 2: Bioparticle collection using gel-film from various substrates. The gel-film slides can be used to collect bioparticles from a variety of surfaces. The gel-film is placed in direct contact with the object or surface of interest. Gentle pressure is applied in order to transfer bioparticles onto the gel-film surface. Collection of bioparticles from (A) worn clothing items (coat collar), (B) touched objects (travel coffee cup), and (C) direct human skin (male wrist) are shown.
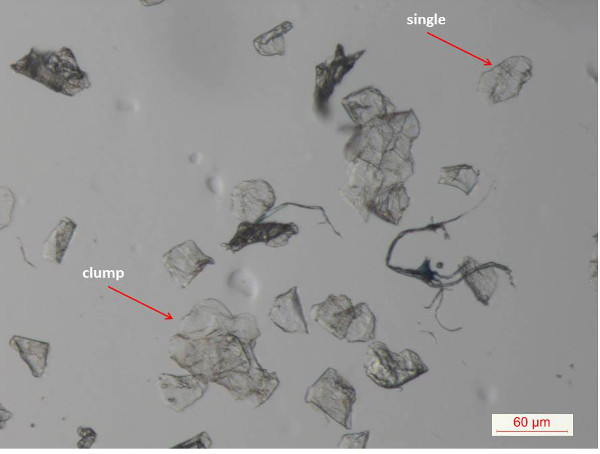
Figure 3: Bioparticles on a worn clothing item (inside pant leg). Bioparticles are transferred to gel-film through direct contact with the object surface. Bioparticles can be found as “clumps” or individual/single bioparticles (indicated with red arrows).
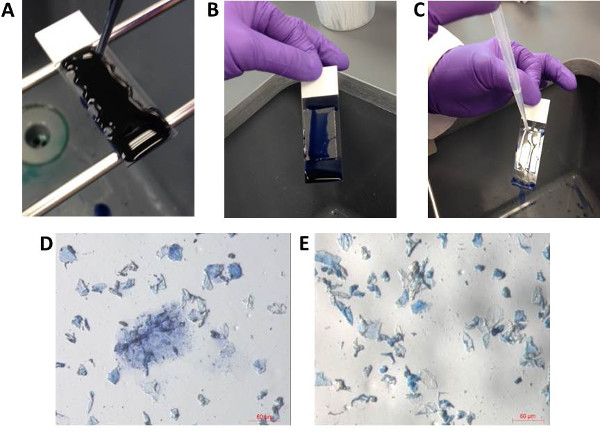
Figure 4: Optional staining of bioparticles on gel-film slides. For better visualization of bioparticles, gel-film samples can be stained with trypan blue stain. The entire surface of gel-film is covered by trypan blue (A). After 1-2 min of staining, the slide is gently tilted to allow excess stain to run off the slide (B). Gentle flooding with sterile water (C) can be used to remove excess stain. After the slide is air dried, the slide can be viewed under the microscope to ensure proper staining (D, E). Note: Not all bioparticles will appear stained (i.e., blue in color). Please click here to view a larger version of this figure.
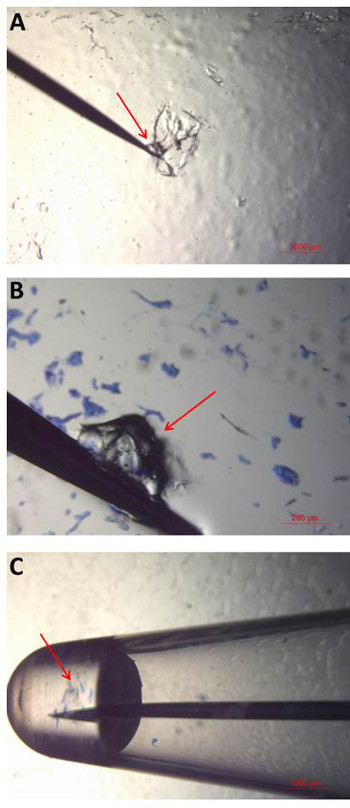
Figure 5: Bioparticle collection and analysis. (A) A small amount (or “ball”) of water–soluble wave solder tape (“adhesive”) is collected on to the tip of a tungsten needle by gentle scraping. (B) The adhesive is then touched to the gel-film surface in order to collect the bioparticles of interest. Individual or multiple bioparticles can be collected with a single adhesive ball. (C) Once the desired bioparticles have been collected, the tip of the needle is placed into amplification mix in a 0.2 ml PCR tube. The needle is held in the liquid until it dissolves and the release of bioparticles into solution is observed. All steps in the collection process are performed and viewed under the microscope to ensure successful bioparticle collection and transfer. Please click here to view a larger version of this figure.
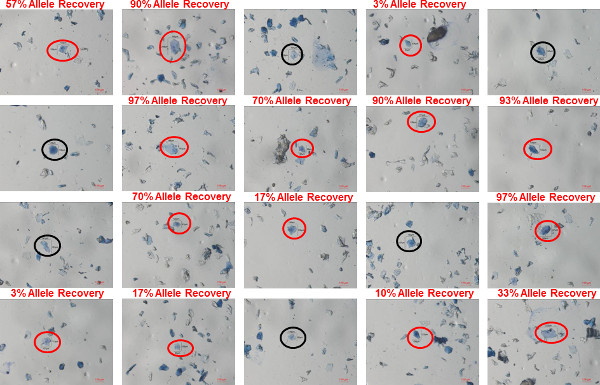
Figure 6: Individual bioparticles in a shirt collar sample. Bioparticles were recovered using gel-film from the inside of a shirt collar worn by a male donor. The bioparticles were stained using trypan blue and images of twenty different individual bioparticles identified in the sample are shown. In each image, the bioparticle that was collected is circled (red circles indicating bioparticles in which a profile was recovered; black circles indicating bioparticles in which a profile was not recovered). The percent allele recovery (number of observed alleles out of a possible 30) is shown above the image of bioparticle from which a profile was recovered. Please click here to view a larger version of this figure.
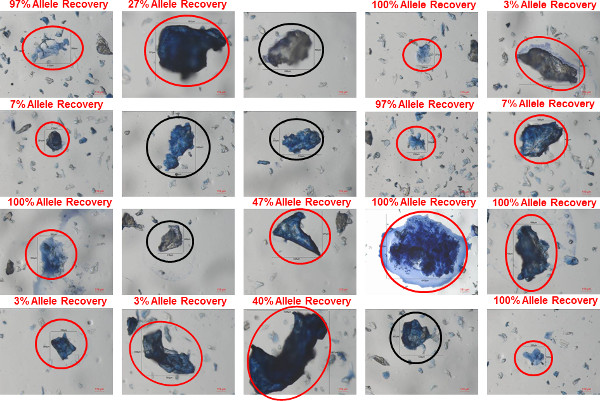
Figure 7: Clumped bioparticles in a shirt collar sample. Bioparticles were recovered using gel-film from the inside of a shirt collar worn by a male donor. The bioparticles were stained using trypan blue and images of twenty different clumped bioparticles identified in the sample are shown. In each image, the bioparticle that was collected is circled (red circles indicating bioparticles in which a profile was recovered; black circles indicating bioparticles in which a profile was not recovered. The percent allele recovery (number of observed alleles out of a possible 30) is shown for each bioparticle from which a profile was recovered. Please click here to view a larger version of this figure.
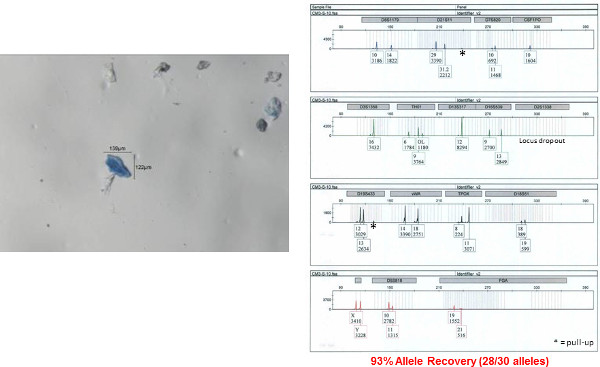
Figure 8: Autosomal STR profile obtained from a single bioparticle from a male shirt collar. An autosomal STR profile was obtained from a single bioparticle (shown on left) using the 5 µl direct lysis/amplification reaction. The accuracy of this profile was determined by comparison to a donor reference sample. Fifteen autosomal STR loci and amelogenin (sex determination) are co-amplified in a single reaction and separated by capillary electrophoresis. The results are displayed here as an electropherogram. Allele numbers are designation below each peak at each locus. The x-axis represents fragment size (base pairs, bp) and y-axis represents signal intensity (RFU relative fluorescence units; provided under each corresponding allele number). Please click here to view a larger version of this figure.
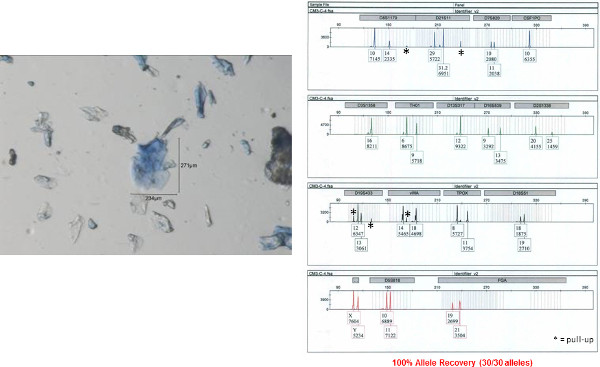
Figure 9: Autosomal STR profile obtained from a clumped bioparticle from a male shirt collar. An autosomal STR profile was obtained from a clumped bioparticle (shown on left) using the 5 µl direct lysis/amplification reaction. The accuracy of this profile was determined by comparison to a donor reference sample. Fifteen autosomal STR loci and amelogenin (sex determination) are co-amplified in a single reaction and separated by capillary electrophoresis. The results are displayed here as an electropherogram. Allele numbers are designation below each peak at each locus. The x-axis represents fragment size (base pairs, bp) and y-axis represents signal intensity (RFU relative fluorescence units; provided under each corresponding allele number). Please click here to view a larger version of this figure.
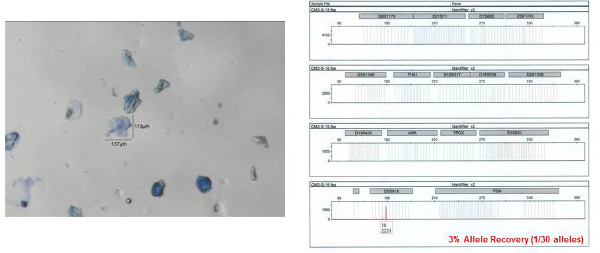
Figure 10: Example of a failure to obtain an autosomal STR profile obtained from a collected bioparticle. The individual bioparticle shown on left was collected from a shirt collar gel-film sample. As can be seen from the resulting STR profile (shown on right), only one allele (out of 30 possible) was obtained. Allele numbers are designation below each peak at each locus. The x-axis represents fragment size (base pairs, bp) and y-axis represents signal intensity (RFU relative fluorescence units; provided under each corresponding allele number). Please click here to view a larger version of this figure.
Discussion
Here we have described methods for the collection and enhanced genetic analysis of bioparticles recovered from touch DNA evidence. The developed approach involves the following: 1) collection of biological material (i.e., bioparticles) via gel-film from touched objects and surfaces, worn clothing items or direct human skin, 2) microscopic examination of the recovered biological material to ensure collection of potential human biological material, and 3) micromanipulation of single or few bioparticles using a water soluble adhesive, and 4) autosomal DNA-STR profiling of the collected bioparticles using a microvolume (5 µl) one-step lysis/amplification reaction. The use of a one-step closed tube reaction reduces the potential for contamination and sample loss from additional sample manipulations or transfer to other reaction tubes. The enhanced one-step microvolume (5 µl) lysis/STR amplification reactions permits the recovery of full or probative STR profiles of the donor of single or few bioparticles. This approach was developed to obtain single source STR profiles from single- and multi-source touch DNA evidence (e.g., worn clothing items and other household items, touched/handled objects and surfaces, skin/skin mixtures). It has successfully been used for the detection of the male donor in simulated physical assault mixture samples.
This approach could be further evaluated in additional body fluid/tissue mixture scenarios such as a victim scratching his/her assailant, in which only a few bioparticles from the assailant would be present amongst an overwhelming amount of biological material from the victim. Additionally, since this approach developed in the current study permits analysis at the single bioparticle level, it could be used to gain a better understanding of the nature and extent of secondary transfer14-19, in which an intermediary transfers a DNA profile on a surface, object or person to another surface object or person20. A blind-swabbing approach to the analysis of secondary transfer may fail to identify trace amounts of material from the secondary donor. The approach developed here permits the analysis of single or few bioparticles and therefore the results are not confounded by the presence of an overwhelming amount of biological material from the primary donor. The methodologies developed in this work may also have implications for the analysis of trace biological material in sexual assault cases such as those involving digital penetration of the vagina where positive identification of trace amounts of skin cells from the perpetrator could be crucial to establish that sexual contact occurred.
While the collection of bioparticles from gel-film sample does not involve difficult and complex manipulations, there are critical steps in this procedure that need to be performed with great care to ensure the successful transfer of bioparticles to the downstream reaction vessel. The collection of bioparticles with the water soluble adhesive must be viewed microscopically (i.e., stereomicroscope at high magnification (~200-300X) to ensure that only the bioparticles of interest are collected. Depending on the size of the adhesive “ball” used, there is the potential to collect additional surrounding material which may include both biological and non-biological material (e.g., fibers, other debris). The collection of unintended additional bioparticles may result in the recovery of admixed DNA profiles. The collection of non-biological material may introduce inhibitors into the micro-volume lysis/STR reactions. If multiple bioparticles are collected with the same adhesive “ball”, there is a potential for previously collected bioparticles to become unattached from the adhesive. This is not frequently observed, but can occur when larger numbers of bioparticles are collected (e.g., over 50) with a single adhesive “ball”. If a large number of bioparticles are targeted, it is recommended that multiple collections of fewer bioparticles are made but all transferred into the same 0.2 ml tube. Once bioparticles have been collected, care must be taken during the removal of the gel-film slide from the microscope stage and the placement of the 0.2 ml tube so that the tip of the needle is not disturbed. During placement of the tip of the needle into the amplification mix at the bottom of the 0.2 ml tube, the tip of the needle should not make contact with the sides of the tube in order to avoid loss of material on the sides of the tube. While the solubilization of the adhesive is typically rapid (~30 sec or less depending on the size of the adhesive “ball”) and can monitored during microscopic examination, the tip of the needle should be slowly removed from the amplification mix to ensure that complete solubilization of the adhesive has been achieved. If the adhesive has not completely dissolved, the needle can be returned to the liquid to allow complete dissolution.
The protocols described here have been optimized for use with bioparticles and human cells from forensic biological evidence. The lysis buffer selected is compatible with the selected DNA-STR amplification kit. While there may be suitable alternative lysis buffers, their efficiency in terms of cell lysis and compatibility with downstream analysis must be verified by the user. Additionally, the STR amplification kit and amplification cycle number described in this protocol have been optimized for use with single or few bioparticles. A next generation STR amplification kit with reported increased robustness and sensitivity was selected and has been demonstrated to result in the recovery of high quality STR profiles from single or few bioparticles. While numerous other STR kits, with varying recommended amplification cycle numbers, are available, they may not possess suitable sensitivity and therefore would need to be properly evaluated before use in these protocols.
Despite the successful use of the described methods for the recovery STR profiles from single or few bioparticles, the success rate of profile recovery will not be 100%. Therefore, for some samples a limited partial DNA profile or no profile may be observed. This cannot be avoided due to the inability to conclusively visually identify most bioparticles as cellular material, the potential degraded state of the nuclear material in the collected bioparticles or loss of sample material from the adhesive before transfer into the reaction vessel. Therefore, the analysis of a single bioparticle sample for each touch DNA item is not recommended. We frequently collect 20 sample sets from an individual gel-film sample and will collect additional sample sets as needed if a suitable STR profile is not obtained. The only limitation for collections is the amount of biological material present on the gel-film sample (and likely the cost of analysis, although the microvolume reactions provide the opportunity to collect additional samples for a similar or lower cost as a single standard reaction volume (e.g., 25 µl).
The developed DNA profiling methods describe here provide a molecular based approach to the characterization, analysis and interpretation of trace biological material recovered from touch DNA samples. However, there is additional genetic information that can be obtained from the recovered bioparticles in addition to determination of the donor (i.e., STR profile) of the donor of the biological material. The tissue or body fluid source of origin (e.g., skin versus saliva) may provide crucial contextual information to a criminal investigation. Without such a determination, the ambiguity of the tissue source of origin can be exploited as alternative circumstances of the crime (e.g., how the body fluid may have been deposited) could be suggested. The bioparticle collection and isolation protocols described here could be used to collect bioparticles or other cells (e.g., buccal, vaginal) for use in a tissue source identification (mRNA profiling21-30) strategy that involves micro-volume reverse transcription (RT) and amplification reactions. With further optimization it may also be possible to develop a DNA/RNA co-isolation strategy to permit cell type identification (RNA) and STR profiling from the same sample, including bioparticles from touch DNA evidence.
Disclosures
The authors declare that they have no competing financial interests.
Acknowledgements
The authors would also like to thank all participants who donated samples for this work. This work was funded by the Office of Justice Program, National Institute of Justice, Department of Justice under award number 2010-DN-BX-K139. The funding agencies had no involvement in the study design, in collection, analysis and interpretation of data, or in the writing of the report. Points of view in this document are those of the authors and do not necessarily represent the official positions of the U.S. Department of Justice.
Materials
| Name | Company | Catalog Number | Comments |
|---|---|---|---|
| SealRite 1.5 ml natural microcentrifuge tubes, sterile | USA Scientific | 1615-5510 | numerous alternative suppliers are available, but tubes should be sterile |
| 0.2 ml PCR tubes with flat cap, natural | Phenix Research | MPX-200F | or equivalent |
| Kimwipes | Fisher Scientific | 06-666 and/or 06-666-11C | |
| Alcohol prep pads | Fisher Scientific | 06-669-62 | alternative is 06-665-24 (Fisher Sci); canister of larger alcohol wipes rather than individual pads |
| Sterile water | 18.2 MΩ, autoclaved | ||
| Glass microscope slides, frosted, 3" x 1": 1 mm | Fisher Scientific | 12-544-3 | alternative brands or sizes are acceptable |
| Disposable transfer pipet | Fisher Scientific | 13-711-9D | alternatives are acceptable |
| Trypan blue solution | Sigma | T8154 | |
| Pipets: 0.2-2, 2-20, 10-100, 100-1,000 μl | various | ||
| Sterile, aerosol-resistant pipet tips | various | ||
| Mini-centrifuge | various | ||
| Stereomicroscope | Leica | M205C | others are suitable, but must be capable of magifications up to 350X |
| GeneAmp PCR system 9700 thermal cycle (silver or gold block) | Life Technologies | N8050200 or 4314878 | other models and manufacturers can be used, but performance with the STR amplification kit must be verified |
| 3130 Genetic Analyzer | Life Technologies | 3130-01 | alternatives: 310 or 3500 Genetic Aanlyzers (Life Technologies) |
| GeneMapper software | Life Technologies | various | various versions of the software are available and can be used |
| WF Gel-Film , x8 retention level | Gel-Pak | WF-40-x8-A | 4" x 4" wafer film; can be ordered in other size specifications |
| Double sided tape | various | ||
| Glass block, 3" x 1.5" x 3/8" | McCrone Microscopes and Accessories | 370-2 | or equivalent |
| [header] | |||
| Tungsten needle with holder | McCrone Microscopes and Accessories | 106 | |
| 3M water soluble wave solder tape, 5414 transparent | Allied Electronics | 70113977 | |
| Lysis buffer (forensicGEM Saliva, Zygem) | VWR | 95043-992 | Lysis buffer is prepared in 10 μl portions (prepare additional master mix portions as needed to accommodate the desired number of samples). 1.5 μl is used for each sample. To prepare 10 μl of lysis buffer (sufficient for ~6 samples): 6.9 μl sterile water, 2.1 μl 10x buffer - blue, 1 μl forensicGEM. |
| STR Amplification kit, AmpFlSTR Identifiler Plus PCR amplification kit | Life Technologies | 4427368 | Alternative STR amplification kits can be used, but performance would have to be verified by user. The amplification mix is prepared as follows (volumes per sample): 2.2 μl PCR reaction mix, 1.1 μl Primer set, 0.2 μl (1U) AmpliTaq Gold DNA polymerase. A master mix sufficient for the desired number of samples should be prepared. 3.5 μl of the prepared mix is added to the 0.2 ml tube for bioparticle collection. |
| AmpliTaq Gold DNA polymerase | Life Technologies | N808-0245 | |
| HiDi formamide | Life Technologies | 4311320 | |
| GeneScan 500 LIZ size standard | Life Technologies | 4322682 | |
| 96 well optical reaction plates | Life Technologies | N8010560 | |
| Plate septa, 96 well | Life Technologies | 4315933 | |
| Performance-optimized polymer, POP-7 | Life Technologies | 4363785 | Alternatives such as POP-4 are acceptable |
References
- Hanson, E. K., Ballantyne, J. Getting blood from a stone': ultrasensitive forensic DNA profiling of microscopic bio-particles recovered from 'touch DNA' evidence. Methods Mol.Biol. 1039, 3-17 (2013).
- Balogh, M. K., Burger, J., Bender, K., Schneider, P. M., Alt, K. W. STR genotyping and mtDNA sequencing of latent fingerprint on paper. Forensic Sci Int. 137 (2-3), 188-195 (2003).
- Barbaro, A., Cormaci, P., Teatino, A., La, M. A., Barbaro, A. Anonymous letters? DNA and fingerprints technologies combined to solve a case. Forensic Sci Int. 146, S133-S134 (2004).
- Bright, J. A., Petricevic, S. F. Recovery of trace DNA and its application to DNA profiling of shoe insoles. Forensic Sci.Int. 145 (1), 7-12 (2004).
- Castello, A., Alvarez, M., Verdu, F. DNA from a Computer Keyboard. Forensic Science Communications. 6 (3), (2004).
- Horsman-Hall, K. M., et al. Development of STR profiles from firearms and fired cartridge cases. Forensic Sci Int. Genet. 3 (4), 242-250 (2009).
- Petricevic, S. F., Bright, J. A., Cockerton, S. L. DNA profiling of trace DNA recovered from bedding. Forensic Sci. Int. 159 (1), 21-26 (2006).
- Oorschot, R. A., Jones, M. K. DNA fingerprints from fingerprints. Nature. 387 (6635), 767(1997).
- Sewell, J., et al. Recovery of DNA and fingerprints from touched documents. Forensic Sci Int.Genet. 2 (4), 281-285 (2008).
- Raymond, J. J., van Oorschot, R. A., Gunn, P. R., Walsh, S. J., Roux, C. Trace evidence characteristics of DNA: A preliminary investigation of the persistence of DNA at crime scenes. Forensic Sci Int Genet. 4 (1), 26-33 (2009).
- Wickenheiser, R. A. Trace DNA: a review, discussion of theory, and application of the transfer of trace quantities of DNA through skin contact. J.Forensic Sci. 47 (3), 442-450 (2002).
- Sweet, D., Lorente, M., Lorente, J. A., Valenzuela, A., Villanueva, E. An improved method to recover saliva from human skin: the double swab technique. J. Forensic Sci. 42 (2), 320-322 (1997).
- Molecular Biology of the Skin - the Keratinocyte. Darmon, M. M., Blumenberg, M. M. , Academic Press. San Diego, CA. (1993).
- Daly, D. J., Murphy, C., McDermott, S. D. The transfer of touch DNA from hands to glass, fabric and wood. Forensic Sci Int Genet. 6 (1), 41-46 (2012).
- Goray, M., Eken, E., Mitchell, R. J., van Oorschot, R. A. Secondary DNA transfer of biological substances under varying test conditions. Forensic Sci Int Genet. 4 (2), 62-67 (2010).
- Goray, M., Mitchell, R. J., van Oorschot, R. A. Investigation of secondary DNA transfer of skin cells under controlled test conditions. Leg.Med.(Tokyo). 12 (3), 117-120 (2010).
- Lowe, A., Murray, C., Whitaker, J., Tully, G., Gill, P. The propensity of individuals to deposit DNA and secondary transfer of low level DNA from individuals to inert surfaces. Forensic Sci Int. 129 (1), 25-34 (2002).
- Phipps, M., Petricevic, S. The tendency of individuals to transfer DNA to handled items. Forensic Sci Int. (2-3), 168-162 (2007).
- Zoppis, S., et al. DNA fingerprinting secondary transfer from different skin areas: Morphological and genetic studies. Forensic Sci Int Genet. 11, 137-143 (2014).
- Gill, P. Misleading DNA Evidence: Reasons for Miscarriages of Justice. , Academic Press - Elsevier. (2014).
- Haas, C., Hanson, E., Ballantyne, J. Capillary electrophoresis of a multiplex reverse transcription-polymerase chain reaction to target messenger RNA markers for body fluid identification. Methods Mol. Biol. 830, 169-183 (2012).
- Hanson, E., Ballantyne, J. RNA Profiling for the Identification of the Tissue Origin of Dried Stains in Forenic Biology. Forensic Sci Rev. , 22145-22157 (2010).
- Hanson, E., Haas, C., Jucker, R., Ballantyne, J. Specific and sensitive mRNA biomarkers for the identification of skin in 'touch DNA' evidence. Forensic Sci Int Genet. 6, 548-558 (2012).
- Hanson, E. K., Ballantyne, J. Highly specific mRNA biomarkers for the identification of vaginal secretions in sexual assault investigations. Sci Justice. 53 (1), 14-22 (2013).
- Juusola, J., Ballantyne, J. Messenger RNA profiling: a prototype method to supplant conventional methods for body fluid identification. Forensic Sci Int. 135 (2), 85-96 (2003).
- Juusola, J., Ballantyne, J. Multiplex mRNA profiling for the identification of body fluids. Forensic Sci Int. 152 (1), 1-12 (2005).
- Fleming, R. I., Harbison, S. The development of a mRNA multiplex RT-PCR assay for the definitive identification of body fluids. Forensic Sci Int Genet. 4 (4), 244-256 (2010).
- Haas, C., Klesser, B., Maake, C., Bar, W., Kratzer, A. mRNA profiling for body fluid identification by reverse transcription endpoint PCR and realtime PCR. Forensic Sci Int Genet. 3 (2), 80-88 (2009).
- Lindenbergh, A., et al. A multiplex (m)RNA-profiling system for the forensic identification of body fluids and contact traces. Forensic Sci Int Genet. 6 (2), 565-577 (2012).
- Richard, M. L., et al. Evaluation of mRNA marker specificity for the identification of five human body fluids by capillary electrophoresis. Forensic Sci Int Genet. 6 (4), 452-460 (2012).
Reprints and Permissions
