

Summary
The fenestrated liver sinusoidal endothelial cell is a biologically important filter system that is highly influenced by various diseases, toxins, and physiological states. These changes significantly impact on liver function. We describe methods for the standardisation of the measurement of the size and number of fenestrations in these cells.
Abstract
Liver sinusoidal endothelial cells are the gateway to the liver, their transcellular fenestrations allow the unimpeded transfer of small and dissolved substances from the blood into the liver parenchyma for metabolism and processing. Fenestrations are dynamic structures - both their size and/or number can be altered in response to various physiological states, drugs, and disease, making them an important target for modulation. An understanding of how LSEC morphology is influenced by various disease, toxic, and physiological states and how these changes impact on liver function requires accurate measurement of the size and number of fenestrations. In this paper, we describe scanning electron microscopy fixation and processing techniques used in our laboratory to ensure reproducible specimen preparation and accurate interpretation. The methods include perfusion fixation, secondary fixation and dehydration, preparation for the scanning electron microscope and analysis. Finally, we provide a step by step method for standardized image analysis which will benefit all researchers in the field.
Introduction
The liver sinusoidal endothelial cells (LSECs) are highly differentiated endothelial cells that line the wall of the hepatic sinusoid. LSECs are perforated with fenestrations that are non-diaphragmed, transcellular pores 50-250 nm in diameter. Up to 20% of the surface of LSECs is covered by fenestrations, which are usually in groups of tens to hundreds called sieve plates1-3 (Figure 1). Fenestrations allow transfer of plasma and nanosubstrates between blood and hepatocytes, creating a highly efficient ultrafiltration system. Fenestrations are dynamic structures - both their size and/or number can be altered in response to various physiological states, drugs, and disease. For example, fenestrations are larger in the fasted than in the fed state4; 2-di-iodoamphetamine increases fenestration number;5,6 and a reduction in size and number of fenestrations per cell occurs in ageing and many disease states7-13. Accurate measurement of the size and number of fenestrations is important for understanding how LSEC morphology is influenced by various disease, toxic, and physiological states; their impact on liver function; and for developing fenestration-modulating therapeutic interventions1.
The study of fenestrations is difficult. The diameter of fenestrations lies below the resolution of conventional light microscopy, so previously only observation using electron microscopy both in intact liver tissue or cultured LSECs has been possible. The scanning electron microscope (SEM) has most frequently been used to study fenestration size, frequency and porosity (the percentage of LSEC membrane that is perforated by fenestrations) because SEM allows for the observation of large areas of the endothelial surface and measurement of thousands, if not tens of thousands of fenestrations. Despite its utility, the results which are reported from SEM-based studies for LSEC parameters such as fenestration size, number, frequency and porosity vary widely in the literature (Table 1).
Fenestrations and sieve plates are fragile structures that contract, break, dilate or coalesce during specimen preparation, thus careful processing is needed to preserve their integrity. Elevated perfusion pressure14; incorrect osmolarity of the fixative and buffers15; inadequate fixation or fixation time; and speed of post-fixation dehydration and drying are all areas of processing for SEM that may produce artefacts that interfere with preservation of ultrastructure (Figure 2). Loss of fenestrations (‘defenestration’) and fenestration shrinkage can occur as a result of poor fixation, resulting in reduced fenestration diameter and cell porosity. Methods to improve the preservation of specimens for SEM analysis have been described previously 15-17 and will be discussed here with additional tips on how to improve specimen preservation. The main goals of the specimen preservation are to remove blood from the sinusoids so that the surface of the LSEC can be visualized and to avoid LSEC damage from either high pressure or delayed fixation. Whole liver perfusion of fixative via the portal vein is the preferred method for liver fixation. As described in detail elsewhere16,18 perfusion must be undertaken at low pressure (eg 10 cm of H20) to avoid pressure-related perfusion artefacts and damage to the LSEC, typically manifested as large gaps within in the cell membrane. However, reasonable fixation can often be obtained using needle perfusion of liver biopsies from humans and animals, as described in detail elsewhere19. This technique involves directly injecting fixative into the tissue until blood is flushed out of the sample and the tissue is firm and fixed. Fixation of samples for electron microscopy needs to be performed as quickly as possible following cessation of blood flow to prevent ultrastructural changes occurring as a result of the livers extremely rapid autolytic processes.
We also present a method of image analysis that minimizes the inclusion of artefacts, and standardizes the measurement of fenestrations. Variation in the selection of sinusoids for micrographs, image analysis of artefacts, and measurement of cell area for porosity and fenestration frequency have led to major discrepancies in published results. A standardized approach for evaluation and measurement of fenestrations and the minimum requirements for data presentation have not been clearly addressed in the literature previously4,10,20-31.
Subscription Required. Please recommend JoVE to your librarian.
Protocol
NOTE: All procedures involving the use of animals are carried out according to the local legislation. Our work is approved by the Sydney Local Health District Animal Welfare Committee. The allowed procedures are described in the project license documentation and follow guidelines that ensure the welfare of the animal at all times. Ensure adherence to the legislation on animal experimentation of the country where the work is performed.
1. Protocol for Preparing EM Fixative
- For 100 ml of fixative, prepare paraformaldehyde by adding 2 g of paraformaldehyde powder to 25 ml distilled water in a conical flask, heat to 65 ºC, stirring constantly with a magnetic stirrer.
NOTE: Glutaraldehyde, paraformaldehyde and sodium cacodylate buffer are all hazardous substances and must always be handled in fumehood. - Heat at 65 ºC for 2 min then allow to cool. If needed, add sodium hydroxide solution dropwise while stirring to clear solution completely.
NOTE: sodium hydroxide is hazardous, handle with care. - Add 10 ml of EM grade stock glutaraldehyde, 50 ml of 0.2 M sodium cacodylate buffer and 2 g of sucrose and stir with magnetic stirrer. Add 2 ml of 1.0 M CaCl2.
- Adjust to pH 7.4 prior to making solution up to 100 ml with distilled water. The final fixative contains 2.5 % glutaraldehyde, 2 % Paraformaldehyde, 2 mmol CaCl2, 2 % Sucrose in 0.1 M cacodylate buffer. Ensure that the total Osmolality is 440 mOsmol/L. Use within 24 hr of preparation.
2. Perfusion Fixation of Liver
- Warm perfusion buffer and fixative to 35 - 37 ºC. The correct temperature of the exsanguination buffer and fixative helps to ensure tissue integrity.
- Anaesthetize the animal with a single intraperitoneal injection of 50 mg/kg Ketamine and 5 mg/kg Xylazine.
- Once the animal is under deep anaesthesia, assessed by hind limb withdrawal and tail pinch, a Y incision is made with blunt ended scissors in the animal’s abdomen to expose the liver and portal vein.
NOTE: Ensure that equipment is clean to avoid contamination of specimens with microorganisms and general debris which will be readily seen on SEM. - Tie two very loose sutures around the portal vein one proximal to the liver, the other more distally to the liver.
- Cannulate the portal vein with an appropriately sized IV cannula (18 G for rats, 22 G for mice).Tighten sutures to secure cannula.
- Commence perfusion with phosphate buffered saline warmed to 37 ºC, and at a pressure of 10 cm of H20. Between 5 and 20 ml of PBS is usually required to exsanguinate the liver.
NOTE: Do not to allow air bubbles to enter the liver through the tubes connected to the cannula as they induce artefacts secondary to embolization and pressure; Damage to the hepatocytes, sinusoids and LSEC fenestrations occurs if the perfusion pressure is too high. - Sever the abdominal and thoracic vena cava to allow the buffer to exit freely from the liver. This prevents high back-pressure damage to LSECs.
- Once the liver is free of blood, replace PBS with EM fixative and perfuse for approximately 5 minutes, until the liver is hardened and very pale.
- Discontinue perfusion and cut the fixed liver into 1 - 2 mm3 blocks using a sharp scalpel.
- Post-fix tissue in EM fixative for 24 - 72 hr at 4 ºC.
NOTE: In general, underfixation causes more artefacts than overfixation. - Change fixative following post-fix period to 0.1 M sodium cacodylate buffer for storage at 4 ºC.
NOTE: Specimens stored in this way will be preserved for a significant period of time (up to 12 months), however timely secondary fixation and examination is recommended for best results.
3. Needle Perfusion
NOTE: Needle fixation is a variant of perfusion fixation that involves injection of fixative directly into biopsied liver tissue. The aim is for fixative to be flushed through the blood vessels in order to exsanguinate them and expose all of the tissue block to fixative. Care must be taken to keep the injecting pressure low to avoid pressure injury18,19.
- Remove a small piece of liver from the animal or subject and rinse in saline to remove blood and debris.
- Draw the normal saline into syringe fitted with a fine gauge needle (typically an insulin syringe).
- Inject the saline very slowly into the liver until blood is flushed out of the tissue. Multiple injections may be required.
- Draw the EM fixative into another syringe fitted with a fine gauge needle (typically an insulin syringe).
- Inject the fixative very slowly into the liver until it becomes hard and tan in colour. Multiple injections may be required.
- Cut the fixed liver into 1 - 2 mm3 blocks using a sharp scalpel. Incubate in EM fixative for 24 - 72 hr 4 °C. Wash 3 times in 0.1 M sodium cacodylate buffer before commencing secondary fixation.
4. Preparation for Scanning Electron Microscopy
- Wash sample 3 times in 0.1 M sodium cacodylate buffer. To fix lipids, post fix the sample in 2% osmium tetroxide in 0.1 M sodium cacodylate buffer for 2 hr.
NOTE: Complete washing is very important as glutaraldehyde and osmium tetroxide cross react and generate artefacts on SEM. - Rinse the samples in increasing concentrations of ethanol to commence dehydration. First rinse in 50 % ethanol for 5 minutes; then 3 times for 5 min with 70% ethanol; rinse 3 times for 5 min with 90% ethanol; rinse 2 times for 5 min in 100 % ethanol; and finally rinse 2 times for 10 min in 100% ethanol (molecular sieve).
- Remove all ethanol from the samples and replace with hexamethyldisilazane (HMDS) in fumehood and leave for 10 min. Remove HMDS from the tissue samples and allow to evaporate.
NOTE: HMDS is highly hygroscopic when cold therefore allow to reach RT before using for final dehydration step. - Optionally, mount the samples immediately or place them into a desiccator until ready to mount for SEM.
5. Mounting
NOTE: Correct specimen mounting will maximize the number of clearly delineated sinusoids available for analysis under SEM.
- Label the base of the metal SEM stubs and apply double-sided conductive carbon tape to the top of the stubs.
- Visualize samples using a dissecting microscope to identify the surface with the best sinusoids for subsequent SEM. Place that surface upwards onto the carbon tape surface of the stub.
- Stick specimens firmly to the stub, specimens are now ready for sputter coating.
6. Coating
NOTE: Coating the specimen with a fine film of conductive metal (gold or platinum) in a sputter coater grounds the specimen and protects it from damage from the electron beam. If the coating is too thick structures of interest may be obscured.
- Place stubs into the vacuum chamber of automatic fine sputter coater, set mode to rotation and automatic sputter coating for 45 sec. Use platinum coating for finer detailing, however gold is also suitable.
- Apply a thin layer of carbon paint to the external surfaces of the mounted liver specimens, taking care not to coat the sinusoidal surfaces.
- Once the specimens are coated with platinum and carbon paint has dried they are ready for observation on the SEM. Samples can be stored in a desiccator.
7. Using the Scanning Electron Microscope
- Place specimens into scanning electron microscope and return microscope to vacuum.
- Using standard microscope operating procedures for visualisation of specimens by commencing at a low magnification, gradually increasing magnification.
- Ensure the microscope is adjusted appropriately for working distance, spot size and astigmatism.
- Check for fixation integrity. If the LSEC is mostly free from gaps and contains fenestrations measuring 30 - 250 nm diameter this would generally indicate that specimen preparation has been successful.
- If the sinusoids are full of gaps or devoid of fenestrations the specimen preparation has not been successful or there is significant pathology. In this case, slice the sample with a very fine razor blade, and the cut surfaces recoated and analysed for successfully fixed sinusoids.
- At approximately 15,000-20,000 × magnification select flat LSEC surfaces that are free of debris with good fixation and where the fenestrations are clearly visible (typically containing at least 10 fenestrations).
- Save images of at least 10 sinusoids per liver, from different areas of the blocks, using at least two blocks per liver. Sampling 10 micrographs at 15,000 - 20,000 × magnification per animal is generally sufficient for the quantification of fenestrations to be representative of the entire liver.
8. Analysis
NOTE: ImageJ software which can be downloaded free from the NIH is utilized to quantify fenestration diameter and frequency (www.imagej.nih.gov/ij).
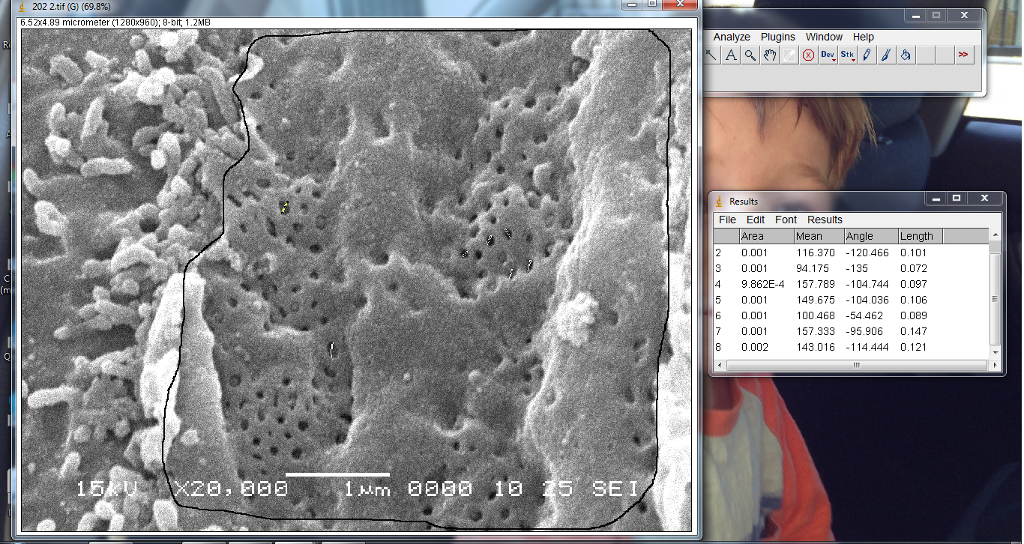
- Open Image J and set the scale using the scale bar embedded in the picture (Screen shot 1).
- Using the polygon tool in ImageJ, trace around the entire flat area of the LSEC including fenestrated and defenestrated areas. Don’t just trace the sieve plates as this will falsely inflate porosity. Exclude any large pieces of debris that are on the cell surface that might be obscuring fenestrations.
- To measure fenestration diameter, trace a line through the longest diameter of each fenestration by selecting the line tool, and press “m” to measure the line, and “d” (draw) to permanently draw the line on the picture. This line is defined as the fenestration diameter. The length of the line will now be available in the results box of ImageJ (Screen shot 2).
- Measure all gaps which are larger holes in the LSEC cytoplasm over 250 nm, as well as fenestrations. Gaps are often artefacts reflecting poor perfusion or fixation, however gaps also can occur as a result of disease and toxicity. The data for gaps will be excluded from calculation of fenestration parameters later in the analysis.
- The area of gaps that are not circular should be calculated by tracing around the gaps and calculating their area on ImageJ.
- Paste the data from the results box in ImageJ into an EXCEL spreadsheet for further analysis.
9. Calculations
- Average fenestration diameter = average of all fenestration diameters (not including gaps, where gaps are ≥ 250 nm).
- Fenestration area = πr2, where r, the radius, is calculated from the individual fenestrations diameter (r=d/2), not including gaps.
- Porosity (%) = (Σ (πr2)/total area analyzed - Σ (area of gaps =)) (µm2)) × 100.
- Fenestration frequency = total number of fenestrations/ (total area analyzed-Σ (area of gaps) (µm2).
10. Presentation of Fenestration Data
NOTE: Whenever possible, publications including quantification of fenestration data should include the following information
- Fenestration diameter, with a statement confirming what boundary diameters where used to define fenestrations (typically between 50 - 250 nm), Fenestration frequency (number/µm2) and porosity (%).
- A statement confirming whether gaps have been included in the analysis, frequency distribution graph of fenestration diameter and the number of livers, blocks, images and fenestrations should be included in the analysis.
Subscription Required. Please recommend JoVE to your librarian.
Representative Results
Initial visualization at low magnification by scanning electron microscopy reveals a flat surface of the liver specimen with an exposed area large enough to observe many large liver vessels and sinusoids (Figure 1A). Ensuring correct liver block placement on the mounting stub is essential for obtaining clear images of the sinusoids and the Glisson’s capsule of the liver should be avoided for this reason (Figure 1B). Increasing the magnification allows closer inspection of the dense vasculature of the liver and reveals the single cell plates of hepatocytes that divide the vessels (Figure 1C). Poor fixation of the liver results in poor image quality, blood cells and debris obscure the view of the liver (Figure 1D).
Further increasing the magnification allows observation of LSEC fenestrations (Figure 2A). It is essential that the sinusoids are correctly identified - the plates of hepatocytes can, under some circumstances appear like blood vessels but features such as the bile canaliculi assist with orientation (Figure 2B). High perfusion pressure can cause artefacts such as large gaps in the endothelium, thought to be caused by coalescence of the LSEC sieve plates. These are easily identified under SEM (Figure 2C). Avoiding cell membrane directly above the nuclei will assist with accuracy of fenestration density and porosity calculations (Figure 2D).
Analysis of the LSEC with ImageJ allows quantification of LSEC fenestration diameter, density and frequency (Figure 3A). These dimensions provide an empirical measurement of fenestrations and allow measurements of changes induced by aging, disease, toxins or therapies (Figure 3B).

Figure 1. Visualizing the liver with SEM. (A) Initial inspection under the SEM reveals the sinusoids of the liver and larger vessels including those of the portal tract and central venules; (B) The Glisson’s capsule covers all details of the sinusoids; (C) The dense vasculature of the liver and single cell plates of hepatocytes that lie between the vessels; (D) Poor fixation results in collapsed sinusoids and the development of ultrastructural artefacts. Please click here to view a larger version of this figure.

Figure 2. The ultrastructure of the liver. (A) LSEC fenestrations are easily seen in well-fixed tissue; (B) The surface of a hepatocyte with well-preserved bile canaliculi; (C) Large gaps in the endothelium caused by high perfusion pressure; (D) LSEC nuclei indicated by the arrows bulge under the surface of the thin LSEC and should not be included in the area for porosity analysis. Please click here to view a larger version of this figure.

Figure 3. Analysis of the LSEC with ImageJ. (A) The polygonal tool allows measurement of the overall area for measurement and the line tool is used to measure fenestration diameter; (B) A frequency histogram generated by the data gained from Image J analysis. Please click here to view a larger version of this figure.
| Diameter (nm) | Frequency (per um2) | Porosity (%) | Reference |
| n.a. | n.a | 60 ± 12 | 20 |
| 127 ± 4 nm | 6.5 ± 0.5 | 4.6 ± 0.4 | 21 |
| n.a | n.a | 40.5 | 22 |
| n.a. | 0.6 ± 1.4 | 0.01 ± 0.03 | |
| n.a. | 2.5 ±0.5 | 0.047 ± 0.012 | 24 |
| 87.25 ± 1.4 | n.a | 9.22 ± 0.7 | 25 |
| 100-200 | 4.49 ± 0.69 | 2.55 ± 0.54 | 26 |
| n.a. | n.a. | 23 ± 2 | 27 |
| 85 ± 17 | 11 ±0.4 | 6.6 ± 0.2 | 28 |
| n.a | 2.7 ± 1.1 | 4.1 ± 2.3 | 10 |
| 68 ± 1 | 8 ± 0.6 | 3.4 ± 0.2 | 29 |
| n.a. | n.a | 3.9 ± 0.2 | 30 |
| 73.3 ± 0.4 | n.a | 2.2 ± 0.2 | 31 |
| 90.7 ± 11.7 | 8.45 ± 2.43 | 5.93 ± 2.05 | 4 |
| 110.7 ± 0.25 | 9 | 6 | 3 |
| 104.8 ± 0.22 | 13 | 8 | 3 |
Table 1. Published data on fenestrations from a selection of studies in rats showing a wide range of values for fenestration diameter, frequency and porosity when measured by SEM in intact and preserved liver tissue (Mean ± sem).
| Component | Artefact |
| Osmolarity of fixative and buffer too low (hypotonic) | Cell swelling |
| Osmolarity of fixative and buffer too high(hypertonic) | Cell shrinkage |
| Specimen size too large | Fixative cannot penetrate far enough during incubation = autolysis/inadequate fixation |
| pH of the fixative and buffer prior to osmium less than 7.2 or over 7.4 | Protein denaturation and structural deformities |
| Fixation time too short | Autolysis |
| Fixation time too long | May cause cell shrinkage |
| Temperature high | Increases fixation speed however may denature proteins |
| Temperature low | Inadequate fixation |
| Perfusion pressure too high | Gaps, space of Disse enlargement, vacuoles in hepatocytes, loss of sieve plates, widening of fenestration diameter |
| Mechanical damage when mincing and/or using forceps | Crushing of cellular structures if the tissue is not hardened well enough by the fixative |
| Prolonged time to fixation after death, specimen biopsy, or exsanguination | Ischaemia, autolysis, gap formation, defenestration |
| Low fixative incubation volume | Less than 20 times the specimen volume = inadequate penetration of the fixative and autolysis in the centre of blocks. |
| Fixative concentration too high | Concentration affects the rate of fixation and penetration of fixative. Artefact formation. |
| Fixative concentration too low | Exhaustion of the fixative before the fixation process is complete producing cell blebbing and other artefacts. |
| Signs of incomplete fixation in liver | Cell blebbing (swollen microvilli or originating from the cytoplasm), defenestration, gaps, loss of microvilli, swollen mitochondria, cell swelling, sinusoid lumens collapsed or compressed, blood in sinusoidal lumen, irregularly shaped hepatocyte nuclei |
| Blood contamination of the fixative | Deactivates fixative |
| Dirty perfusion and preparation equipment | Specimen contamination with debris and bacteria |
| Incomplete dehydration of the specimens or storage without desiccant after coating | Specimen charge-up on SEM. Adding carbon paint to the block may help reduce charge |
Table 2. Troubleshooting tips for poor specimen and image quality.
Subscription Required. Please recommend JoVE to your librarian.
Discussion
The ability to accurately and reproducibly measure the status of the liver sinusoidal endothelium is an important step in understanding the biology of these highly specialized cells. Newer techniques such as structured illumination microscopy32, atomic force microscopy33 and d-STORM (direct Stochastic Optical Reconstrucion Microscopy) 34 will impart important information regarding the morphology of these cells in vitro but SEM remains the primary methodology to visualize and measure their structure in situ.
The most crucial and technically challenging step is the initial fixation: if the liver is preserved well the subsequent steps will produce easily observable and indeed, beautiful, images of the liver sinusoid. Whole liver perfusion is the most effective method to ensure good fixation, but comparable results are possible in needle perfusion samples that have been fixed quickly and under low pressure. Resorption of water by the dehydrated liver samples is another common reason for poor SEM images, but this can be easily avoided by proper storage of the samples in a desiccator with desiccant.
There is a need for standardization of the quantification of fenestrations so that studies from different research groups can be compared and interpreted. In the past there has been wide variation in the values published with very little methodological information about how these values were obtained. Here we have provided a standardized approach for determining and presenting values that describe fenestration ultrastructure.
Whenever possible, publications including quantification of fenestration data should include the following information: Fenestration diameter, with a statement confirming what boundary diameters where used to define fenestrations (typically between 50 - 250 nm); fenestration frequency (number/µm2 ) and porosity (%); a statement confirming whether gaps have been included in the analysis; and a frequency distribution graph of fenestration diameter. In addition, the number of livers, blocks, images and fenestrations should be included in the analysis.
Fenestration diameter, frequency and porosity are important indicators of liver status and standardizing the collection of this data will be beneficial to the field. The methods discussed here provide a framework for ensuring that studies of the ultrastructure of the LSEC and fenestrations are performed and presented in a comparable way across different research groups. The methodology is easily adapted to measuring fenestrations in isolated and cultured LSECs.
Subscription Required. Please recommend JoVE to your librarian.
Disclosures
The authors have nothing to disclose.
Acknowledgments
The authors have no acknowledgements.
Materials
| Name | Company | Catalog Number | Comments |
| 25% EM grade Glutaraldehyde | ProSciTech | C001 | Store stock at -20 C until needed, avoid refreeze |
| Paraformaldehyde powder | Sigma Aldrich | 158127 | Always prepare Paraformaldehyde fresh |
| Sodium Cacodylate powder | Sigma Aldrich | C0250 | Prepare 0.2 M stock, pH 7.4 by dissolving powder in dH2O, used mostly at 0.1 M by preparing 1:2 dilution |
| Calcium Chloride | Sigma Aldrich | C1016 | Prepare 1 M CaCl2by dissolving powder in dH2O |
| Osmium tretroxide | ProSciTech | C011 | Wash ampoules in weak acid prior to use to avoid contamination. Prepare 2 % stock in glass bottle |
| Ethanol- Absolute | Sigma Aldrich | 459836 | 100 % Ethanol must be high grade and stored with Molecular Sieve |
| Other grades of Ethanol | Labtech | EL5 | Prepare graded Ethanols with dH2O |
| Hexamethyldisilazane | Sigma Aldrich | 52619 | Allow to reach room temperature before use |
| Cannulas | Terumo | TSROX1832C, TSROX2225C, TSROX2419C | 18 G is suitable for most rats, 22 G is suitable for most mice, but it is good to have a few 24 G on hand in case of very small mice |
| Conductive Carbon tape | ProSciTech | IA0201 | |
| Carbon Paint | ProSciTech | I003 | |
| Ketamine | Must be obtained under license | ||
| Xylazine | Must be obtained under license | ||
| Molecular Sieve | Sigma Aldrich | 208647 | Removes water from the 100 % Ethanol |
References
- Cogger, V. C., Le Couteur, D. G., et al. The Liver: Biology and Pathobiology. Arias, I. M., et al. , John Wiley & Sons, Ltd. 387-404 (2009).
- Fraser, R., Dobbs, B. R., Rogers, G. W. Lipoproteins and the liver sieve: the role of fenestrated sinusoidal endothelium in lipoprotein metabolism, atherosclerosis, and cirrhosis. Hepatology. 21, 863-874 (1995).
- Wisse, W., De Zanger, R. B., Charels, K., Van Der Smissen, P., McCuskey, R. S. The liver sieve: considerations concerning the structure and function of endothelial fenestrae, the sinusoidal wall and the space of Disse. Hepatology. 5 (4), 683-692 (1985).
- Reilly, J. N., Cogger, V. C., Fraser, R., Le Couteur, D. G. The effect of feeding and fasting on fenestrations in the liver sinusoidal endothelial cell. Pathology. 42 (3), 255-258 (2010).
- Tian, Y., et al. Activation of serotonin receptor-2B rescues small-for-size liver graft failure in mice. Hepatology. 53 (1), 253-262 (2011).
- Cogger, V. C., Mitchell, S. J., Warren, A., de Cabo, R., Le Couteur, D. G. Age-Related Loss of Responsiveness to 2,5-Dimethoxy-4-Iodoamphetamine in Liver Sinusoidal Endothelial Cells. J Gerontol A Biol Sci Med Sci. 69 (5), 514-518 (2013).
- Reilly, J. N., Cogger, V. C., Le Couteur, D. G. Old age is associated with ultrastructural changes in isolated rat liver sinusoidal endothelial cells. J Electron Microsc. 59 (1), 65-69 (2010).
- Le Couteur, D. G., et al. Calorie Restriction, Aging and Longevity. Rattan, A. E., Le Couteur, D. G., de Cabo, R., et al. , 191-216 (2010).
- McLean, A. J., et al. Age-related pseudocapillarization of the human liver. J Pathol. 200 (1), 112-117 (2003).
- Le Couteur, D. G., et al. Pseudocapillarization and associated energy limitation in the aged rat liver. Hepatology. 33 (3), 537-543 (2001).
- Cogger, V. C., et al. The effect of acute oxidative stress on the ultrastructure of the perfused rat liver. Pharmacol Toxicol. 89 (6), 306-311 (2001).
- Horn, T., Christoffersen, P., Henriksen, J. H. Alcoholic liver injury: defenestration in noncirrhotic livers-a scanning electron microscopic study. Hepatology. 7 (1), 77-82 (1987).
- Jamieson, H. A., et al. Alterations in liver sinusoidal endothelium in a baboon model of type 1 diabetes. Diabetologia. 50 (9), 1969-1976 (2007).
- Fraser, R., et al. High perfusion pressure damages the sieving ability of sinusoidal endothelium in rat livers. Br J Exp Pathol. 61 (2), 222-228 (1980).
- Wisse, E. An electron microscopic study of the fenestrated endothelial lining of rat liver sinusoids. J Ultrastruct Res. 31 (1), 125-150 (1970).
- Wisse, E. An ultrastructural characterization of the endothelial cell in the rat liver sinusoid under normal and various experimental conditions, as a contribution to the distinction between endothelial and Kupffer cells. J Ultrastruct Res. 38 (5), 528-562 (1972).
- Fahimi, H. D. Perfusion and immersion fixation of rat liver with glutaraldehyde. Lab Invest. 16 (5), 736-750 (1967).
- Wisse, E., et al. Fixation methods for electron microscopy of human and other liver. World J Gastroenterol. 16 (23), 2851-2866 (2010).
- Vreuls, C., et al. Jet-fixation: a novel method to improve microscopy of human liver needle biopsies. Hepatology. 59 (2), 737-739 (2014).
- Furrer, K., et al. Serotonin reverts age-related capillarization and failure of regeneration in the liver through a VEGF-dependent pathway. Proc Natl Acad Sci U. S. A. 108 (7), 2945-2950 (2011).
- Zhang, Q., et al. OxLDL induced injury and defenestration of HLSECs via LOX-1. J Mol Endocrinol. , (2014).
- May, D., et al. A transgenic model for conditional induction and rescue of portal hypertension reveals a role of VEGF-mediated regulation of sinusoidal fenestrations. PLoS One. 6 (7), e21478 (2011).
- Funyu, J., Mochida, S., Inao, M., Matsui, A., Fujiwara, K. VEGF can act as vascular permeability factor in the hepatic sinusoids through upregulation of porosity of endothelial cells. Biochem Biophys Res Commun. 280 (2), 481-485 (2001).
- Venkatraman, L., Tucker-Kellogg, L. The CD47-binding peptide of thrombospondin-1 induces defenestration of liver sinusoidal endothelial cells. Liver Int. 33 (9), 1386-1397 (2013).
- Wack, K. E., et al. Sinusoidal ultrastructure evaluated during the revascularization of regenerating rat liver. Hepatology. 33 (9), 363-378 (2001).
- Morsiani, E., Mazzoni, M., Aleotti, A., Gorini, P., Ricci, D. Increased sinusoidal wall permeability and liver fatty change after two-thirds hepatectomy: An ultrastructural study in the rat. Hepatology. 21 (2), 539-544 (1995).
- Straub, A. C., et al. Arsenic-stimulated liver sinusoidal capillarization in mice requires NADPH oxidase–generated superoxide. J Clin Invest. 118 (12), 3980-3989 (2008).
- Barberá-Guillem, E., Arrue, J. M., Ballesteros, J., Vidal-Vanaclocha, F. Structural changes in endothelial cells of developing rat liver in the transition from fetal to postnatal life. JJ Ultrastruct Mol Struct Res. 97 (1-3), 197-206 (1986).
- Jamieson, H. A., et al. Caloric restriction reduces age-related pseudocapillarization of the hepatic sinusoid. Exp Gerontol. 42 (4), 374-378 (2007).
- Cogger, V. C., et al. Hyperlipidemia and surfactants: the liver sieve is a link. Atherosclerosis. 189 (2), 273-281 (2006).
- Cogger, V. C., et al. The effects of oxidative stress on the liver sieve. J Hepatol. 41 (3), 370-376 (2004).
- Cogger, V. C., et al. Three-dimensional structured illumination microscopy of liver sinusoidal endothelial cell fenestrations. J Struct Biol. 171 (3), 382-388 (2010).
- Braet, F., de Zanger, R., Seynaeve, C., Baekeland, M., Wisse, E. A comparative atomic force microscopy study on living skin fibroblasts and liver endothelial cells. J Electron Microsc. 50 (4), 283-290 (2001).
- Monkemoller, V., et al. Imaging fenestrations in liver sinusoidal endothelial cells by optical localization microscopy. Phys Chem Chem Phys. 16 (24), 12576-12581 (2014).
