Drosophila blood cells, or hemocytes, cycle between resident sites and circulation. In the larva, resident (sessile) hemocytes localize to inductive microenvironments, the Hematopoietic Pockets, while circulating hemocytes move freely in the hemolymph. The goal of this protocol is the standardized isolation and quantification of these two, behaviorally distinct but interchanging, hemocyte populations.
Method Article
Assaying Blood Cell Populations of the Drosophila melanogaster Larva
In This Article
Summary
Abstract
In vertebrates, hematopoiesis is regulated by inductive microenvironments (niches). Likewise, in the invertebrate model organism Drosophila melanogaster, inductive microenvironments known as larval Hematopoietic Pockets (HPs) have been identified as anatomical sites for the development and regulation of blood cells (hemocytes), in particular of the self-renewing macrophage lineage. HPs are segmentally repeated pockets between the epidermis and muscle layers of the larva, which also comprise sensory neurons of the peripheral nervous system. In the larva, resident (sessile) hemocytes are exposed to anti-apoptotic, adhesive and proliferative cues from these sensory neurons and potentially other components of the HPs, such as the lining muscle and epithelial layers. During normal development, gradual release of resident hemocytes from the HPs fuels the population of circulating hemocytes, which culminates in the release of most of the resident hemocytes at the beginning of metamorphosis. Immune assaults, physical injury or mechanical disturbance trigger the premature release of resident hemocytes into circulation. The switch of larval hemocytes between resident locations and circulation raises the need for a common standard/procedure to selectively isolate and quantify these two populations of blood cells from single Drosophila larvae. Accordingly, this protocol describes an automated method to release and quantify the resident and circulating hemocytes from single larvae. The method facilitates ex vivo approaches, and may be adapted to serve a variety of developmental stages of Drosophila and other invertebrate organisms.
Introduction
Research in the invertebrate model Drosophila melanogaster has driven the discovery of innate immunity1, and has facilitated the understanding of various aspects of blood cell development2-4. Drosophila hematopoiesis can be divided into the lineage of embryonic/larval hemocytes, which originate in the embryo and expand in the larva, and the lineage of lymph gland hemocytes4,5. Here, we present a protocol that focuses on the lineage of embryonic/larval hemocytes, which in the Drosophila larva mainly comprises plasmatocytes (macrophages) and few crystal cells4. In the larva, hemocytes of the embryo persist and colonize segmentally repeated and terminal Hematopoietic Pockets (HPs) located between the epidermis and muscle layers of the larval body wall5,6. Based on their nature as self-renewing macrophages6, their predominant residence in local tissue microenvironments6,7, and their lineage from the earliest blood cells emerging during development6,8, this blood cell population is considered similar to vertebrate self-renewing tissue macrophages, an independent myeloid lineage recently identified in a variety of species4,9,10. However, in Drosophila, some or all of these resident cells also show plasticity to give rise to other blood cell types such as crystal cells11,12.
Larval hemocytes are predominantly resident (sessile), but are in a dynamic steady-state between various HPs. They are progressively released into circulation, in particular as the 3rd instar larva approaches pupariation5-7. Immune challenges, injury or mechanical disturbance lead to a premature, in the latter case reversible, mobilization of resident hemocytes into the hemolymph4,6,13.
Previous studies have suggested that resident and circulating larval hemocytes are of the same lineage, but differ in their adhesive or homing properties6,7,13,14. Selective isolation of circulating versus resident hemocytes revealed elevated levels of proliferation in the resident hemocyte population, suggesting their exposure to inductive cues from the HPs6. Drosophila larval HPs are lined by epidermis and muscle layers and further harbor sensory neuron clusters of the Peripheral Nervous System (PNS) and liver function resembling oenocytes6. Functionally, mutant and genetic cell ablation experiments have demonstrated that sensory neurons present in the HPs support the trophic survival and localization of larval hemocytes6.
Here we describe a method for the specific isolation and quantification of resident and circulating hemocytes from single Drosophila larvae, and a protocol for mechanical hemocyte mobilization. The methods can be used for the ex vivo study of hemocytes and can further be adapted to other Drosophila developmental stages such as the pupa and adult, and other invertebrate systems. Since previous studies did not distinguish between resident and circulating hemocytes, this protocol provides a common standard for the study of resident blood cells and will help to increase the consistency of invertebrate blood cell research.
First, the Hemocyte Bleed/Scrape Assay describes the differential isolation and automated quantification of fluorescent protein-marked resident and circulating hemocyte populations from single Drosophila larvae; the protocol provides two options for regular and tile scan-equipped microscopes (Figure 1). As a result, the percentage of circulating hemocytes and the total number of hemocytes per larva are obtained. The method relies on transgenic Drosophila larvae that express fluorescent protein among their blood cell population. The choice of hemocyte driver or reporter determines the outcome, i.e., which population of blood cells is visualized and quantified. To label mainly macrophages (plasmatocytes), which comprise the vast majority of the resident and circulating hemocyte population of the Drosophila larva6, suitable transgenes include HmlΔ-DsRed 6, HmlΔ-GAL4 15, Pxn-GAL4 16, Crq-GAL4 (by H. Agaisse16), or eater-GAL4 17; for labeling the relatively small population of crystal cells, suitable lines are BcF6-CFP and -GFP 18, or lz-GAL4 (by J. Pollock19); for labeling lamellocytes, a specialized cell type mainly induced by immune challenges and injury13, e.g., MSNF9mo-mCherry may be used17. Some transgenic drivers are expressed in a range of differentiated blood cells and progenitors, such as He-GAL4 20, which labels about 80% of all larval blood cells20. Please note that in all cases where GAL4 drivers are used, combination with UAS-GFP or another fluorescent protein UAS-transgene is required. In the Results section, this method is used to monitor blood cell number and circulation behavior over the course of larval development.
Second, the Hemocyte Disturbance Assay describes a preceding step designed to detach resident hemocytes by external manipulation, which subsequently allows the evaluation of the ability of hemocytes to re-adhere and home to HPs within a limited time frame (30 - 60 min)6. Typically this assay is followed by the Bleed/Scrape Assay to determine the percentage of circulating hemocytes per larva. We present a simplified protocol for this assay (Figure 1D), which uses disturbance by vortexing with glass beads, rather than manipulation of single larva with a paint brush as described previously6. In the Results section, this assay is used to demonstrate that transiently detached hemocytes float in the hemolymph and can be recovered in the fraction of circulating hemocytes. The assay is also useful to quantify differences of hemocytes in their homing/adhesion to resident sites, comparing e.g., various genetic backgrounds or stimulation conditions. Please note that this mechanical manipulation reflects a reversible process and is distinct from infection- or injury-induced resident hemocyte mobilization, which typically are not reversible in a short time frame4,13.
Protocol
1. Hemocyte Bleed/Scrape Assay
- Preparation of slides:
- Option 1 for microscopes without tile scanning function: For each larva to be analyzed, prepare one glass slide with about 5 Pap-pen wells of 2 mm squares each, corresponding to the field viewing area of the microscope; add approximately 5 - 10 µl of S2 media to each (Figure 1A). Keep slides in moist chamber to prevent wells from drying out.
- Option 2 for microscopes with tile scanning function: For each larva to be analyzed, prepare one glass slide with 3 to 4 Pap-pen wells of ~3 - 4 mm squares each; add approximately 15 - 20 µl of S2 media to each well (Figure 1B). Keep slides in moist chamber to prevent wells from drying out.
NOTE: The above recommended number of wells is sufficient for totals of up to 3,000 hemocytes per larva (late 2nd instar larvae, ~2.5 - 3 mm length, transgene labeling the majority of larval blood cells). When assessing larger blood cell numbers, more wells might be needed to avoid over-crowding.
- Collection of larvae:
- Squirt water into a fly vial containing larvae and flush larvae into a Petri dish, or scoop some food that contains larvae into a Petri dish and dilute with water using a squirt bottle.
- Gently pick larvae out of the Petri dish using a paintbrush and place them in water in a cavity dish or on a slide on a cold block.
NOTE: Larvae can be kept for a limited time in water or on a cold block; use specimens within 45 min or less to avoid larval death or unwanted effects on hemocytes.
- Dissection:
- Select larvae under a fluorescence microscope on a cold metal block. Measure sizes and image larvae if desired.
- Isolation of circulating hemocytes (“Bleed”):
- Once larvae are selected, place one larva in the first Pap-pen well (Figure 1C, 2A).
- Use 2 clean needles or dissecting scissors and forceps to make an incision at both the posterior and anterior ends of the larva. To avoid disturbing resident hemocytes, it is best to make these incisions on the ventral side of the larva. For consistent results, make the incisions in the same locations for every larva. For 1st instar larvae, 1 incision (in the ventral anterior) is sufficient.
- Allow larva to bleed for a few seconds without any pressure or physical agitation (Figure 2A).
NOTE: If working on multiple larvae it is better to make these incisions for each one before proceeding to the next step to avoid keeping larvae on ice too long which could affect the samples’ integrity. - Gently lift the larva with the needles or forceps and dip it into the second well to rinse any remaining circulating hemocytes. After that, follow with the release of resident hemocytes.
- Isolation of resident hemocytes (“Scrape”):
- Gently transfer the larva to the next well (Figure 2C).
- Identify the lymph gland of the larva, which typically is located approximately 1/3 from the anterior end of the larva, and which may fluoresce dorsally through the larval body wall. Avoid the lymph gland while releasing resident hemocytes by pinning down the larva with a needle as near as possible to the lymph gland to avoid puncturing (Figure 2C).
NOTE: During normal development the maturation of lymph gland hemocytes is delayed compared to larval hemocytes, and fluorescent reporters of differentiated hemocytes may not show a signal in the lymph gland of young larvae. In these instances, less attention needs to be paid to the lymph gland as no contamination of differentiated fluorescently-labeled larval hemocytes by lymph gland hemocytes is expected. - Release resident blood cells in a dissection process of scraping and/or jabbing. Use one needlepoint to effectively pin down the larva near the lymph gland (see above) or other body areas as needed. Use another needle to jab at the clusters of hemocytes that are visible through the larval body wall (Figure 2C,E), aiming to separate the hemocytes. Hemocytes can also be released in a scraping motion. However, tearing the epidermis early may release big clusters of blood cells, which could make automated counting more challenging.
NOTE: Depending on the age and genotype of the larva, the number of total hemocytes will vary. Distribute the release process described above over several wells to avoid overcrowding of some wells with blood cells, which could make single cell image analysis more difficult. - If few hemocytes remain in the final carcass, count these hemocytes by observation through the microscope and use of a manual tally counter (Figure 2E). To facilitate counting, place the carcass on a clean area of the same slide and spread it as thinly as possible to reduce the number of optical planes.
- Once the dissection is complete, wait between 5 - 10 min for the cells to settle (but not necessarily adhere) before imaging the wells. Incubate the slide in a moist chamber to avoid drying, and avoid rough handling of the slides, which could disturb the settled hemocytes.
NOTE: When determining hemocyte counts, released cells are not fixed and the cells must be imaged shortly after dissection, preferably within 30 min after release from the larva. Depending on the volume of medium and cell properties, the vast majority of cells will have settled within 5 - 10 min, which should be confirmed by focusing through the optical planes of the medium in the well. However, only a fraction of blood cells will have adhered to the slide surface by this time, a fact that needs to be considered if modifying this protocol for cell fixation-based approaches.
- Quantification:
- Take images of the settled hemocytes under a fluorescent microscope (Figure 2B,D,F). Follow with quantification of hemocytes using ImageJ software.
- Prepare image for ImageJ cell counting algorithm:
- Open image of well using ImageJ: File → Open → (locate file and select).
- Ensure that the image(s) is 8-bit or 16-bit. Adjust the threshold for the image by selecting Image then click Adjust and select Threshold. Observe the “Threshold window” (Figure 3A).
- Check the “Dark Background” option. Select “Red” and increase the Lower Threshold Level (see black arrow) until each cell in the image is marked with a red dot (cells that are not being covered will be seen in grayscale; Figure 3B). As the Lower Threshold is increased some cells will become unmarked. This can be the indicator for how far to set the Lower Threshold.
NOTE: Occasionally clusters of cells cannot be resolved and would be counted as one by the particle counter. In such cases, the number of cells in a cluster can be estimated by examining the image (zoom in if needed) and manual counting using a tally counter. Alternatively, the Lower Threshold can be increased to resolve clusters of cells; any unmarked cells resulting from this manipulation can then be counted using a tally counter.
- Analyze cell number using ImageJ:
- Launch the Particle Analyzer to count the cells (Figure 3C). Select Analyze and click on Analyze Particle. Optionally select “Overlay Outlines” to see the particles the algorithm count (Figure 3D). Alternatively, set a limit to the size or pixel area of a unit (e.g., cell, clump of cells, etc.) for the algorithm to count.
- Click OK. Observe a summary window with the count (Figure 3E).
2. Hemocyte Disturbance Assay
- To disturb hemocytes, select larvae and place them in a 2 ml microcentrifuge tube with approximately 0.5 g of glass beads (212 - 600 µm) and add 0.5 ml water.
- Vortex the tube, by hand, at speed 10 for 1 min.
- Retrieve the larvae from the glass beads by spilling the contents of the microcentrifuge tube into a Petri dish and picking out the larvae with a paintbrush.
- For the recovery phase, place larvae in previously prepared Petri dishes with small amounts of fly food. Allow the larvae to re-establish their hemocyte pattern for a period of 45 min or as desired.
NOTE: Discard any larvae that have stopped moving, as they have died in the process. However, we typically see little damage after 1 min of vortexing (see below and Supplemental Figure 1). - After the recovery period, continue with the Bleed/Scrape Assay as described above in Section 1.
Results
To illustrate typical outcomes of the described methods, we first used the Hemocyte Bleed/Scrape Assay to outline the progression of larval hemocyte numbers and their residence over the course of larval development (Figure 4). Resident and circulating larval hemocyte populations were isolated from single larvae (HmlΔ-GAL4, UAS-GFP; He-GAL4 to label the vast majority of larval hemocytes) and quantified using ImageJ. Cohorts of larvae sized 1.2 mm (~48 hr AEL or 1st instar), 2.5 mm (~80 hr AEL or late 2nd instar), and 3.5 mm (~96 hr AEL or 3rd instar) were examined (Figure 4). Hemocyte numbers expanded over the course of larval development, correlating with and exceeding previous estimates based on light microscopy of dye stained larvae7 and live counting of fluorescent protein labeled hemocytes through the larval cuticle6. In 1st instar larvae almost all hemocytes were resident, while the fraction of circulating hemocytes progressively increased over the course of larval development (Figure 4B,C), consistent with previous publications6,7.
Next we examined whether the method faithfully monitors the transition of hemocytes between the resident and circulating populations. Taking advantage of the phenomenon that resident hemocytes can be transiently detached by mechanical disturbance and they re-adhere to their resident sites spontaneously6, we dispersed resident hemocytes by vortexing with glass beads as described in the Hemocyte Disturbance Assay. Indeed, mechanical disturbance of larvae led to a dramatic increase in the population of circulating hemocytes at the expense of resident hemocytes (Figure 5). After a recovery period of 45 min, hemocytes had largely returned to their adherent state, both by visual inspection and by the assessed percentage of circulating cells (Figure 5D,E). As expected, total hemocyte numbers remained stable over time, despite the shift of hemocytes between the circulating and resident populations.
Several additional considerations were taken into account. To confirm that vortexing did not cause major tissue damage, vortexing with glass beads was performed in the presence of trypan blue (Sigma) for various time periods (1, 5, 20 min). Both 1 and 5 min vortexing did not cause any obvious tissue disruption, while 20 min vortexing resulted in small areas of damage, resembling damage caused by needle stitches used as positive control (Supplemental Figure 1). While internal damage of epidermis or other tissues without cuticle damage cannot be excluded, this scenario seems rather unlikely as hemocytes of 1 min and 5 min-treated larvae re-adhered in the expected pattern and time frame, suggesting larval integrity was not compromised (Supplemental Figure 1). In contrast, larvae vortexed for 20 min suffered from a lack of re-adhesion, and did not even show attachment of circulating hemocytes to epidermal wound sites, as has been described previously14.
Lastly, to demonstrate reproducibility of the method, we compared biological replicates of 2.5 mm larvae from the above two experiments, which were conducted by distinct experimenters. As illustrated in Supplemental Figure 2, both cohorts showed comparable total numbers of hemocytes per larva, and the percentage of circulating hemocytes. Student’s t testing showed no statistically significant differences, suggesting that the method is reproducible and broadly applicable.
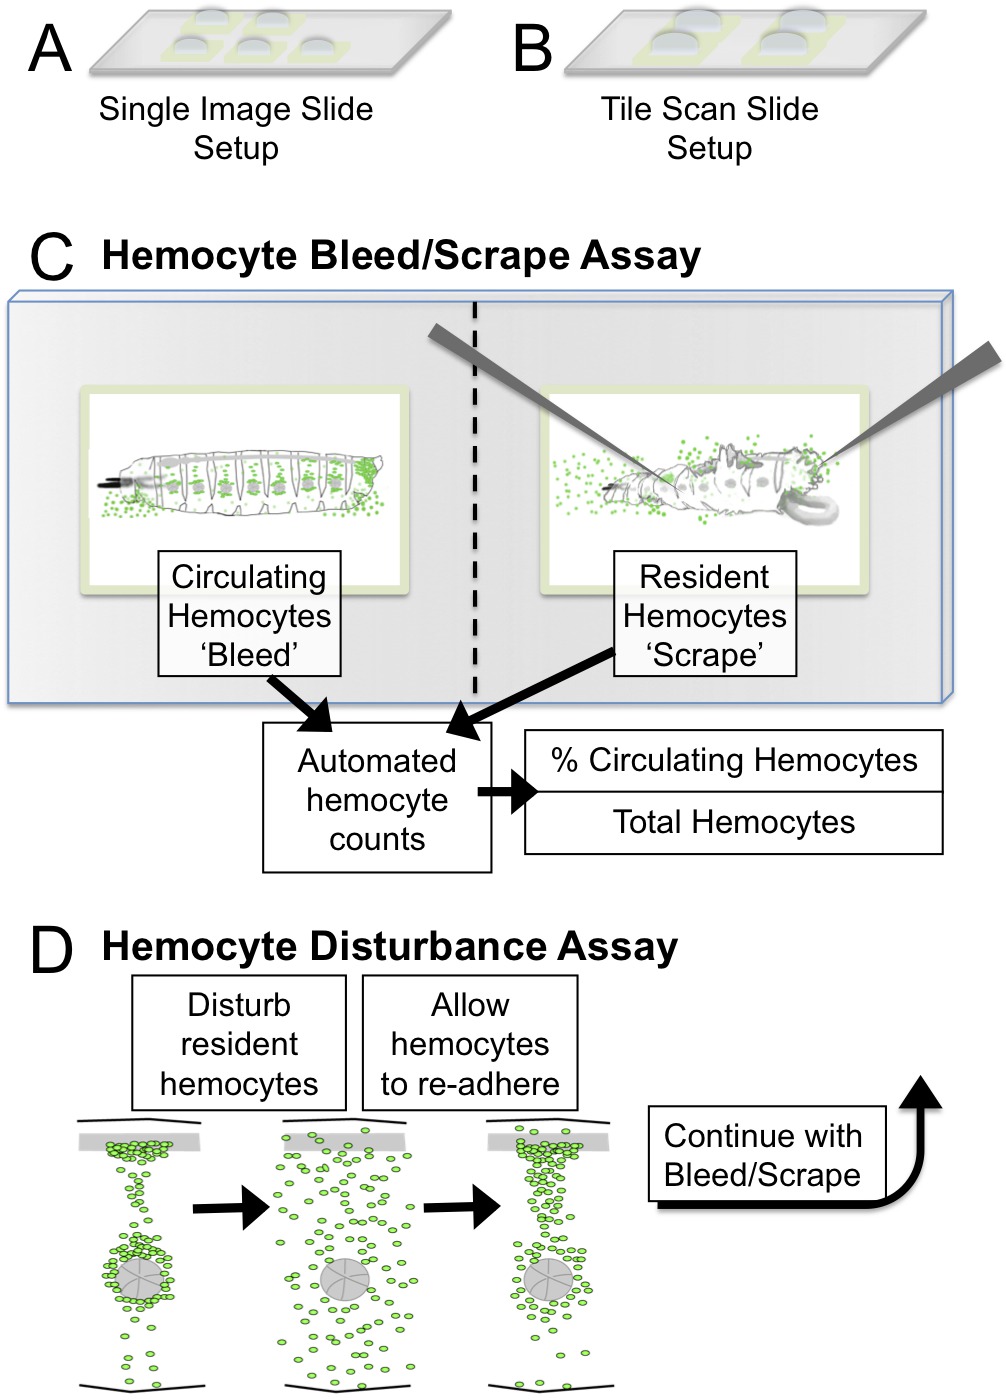
Figure 1. Hemocyte Bleed/Scrape and Disturbance Assay setup and schematic. (A) Single Image Slide Setup: five 2mm squares for imaging with a 5X objective. (B) Tile Scan Slide Setup: four 3 mm squares for imaging bleed/scrapes of ≤2.5 mm larvae with a tile scan microscope. Recommended objectives for imaging are 5X or 10X. (C) Bleed/Scrape Assay schematic and resulting quantifications using ImageJ. (D) In the Disturbance Assay, the hemocyte pattern is mechanically disrupted by vortexing larvae with glass beads. Larvae are allowed to recover over a period of 45 min during which hemocytes re-adhere to the Hematopoietic Pockets. The adhesive properties of hemocytes can be assessed by this method, quantifying the percentage of hemocytes in circulation after disturbance. Please click here to view a larger version of this figure.
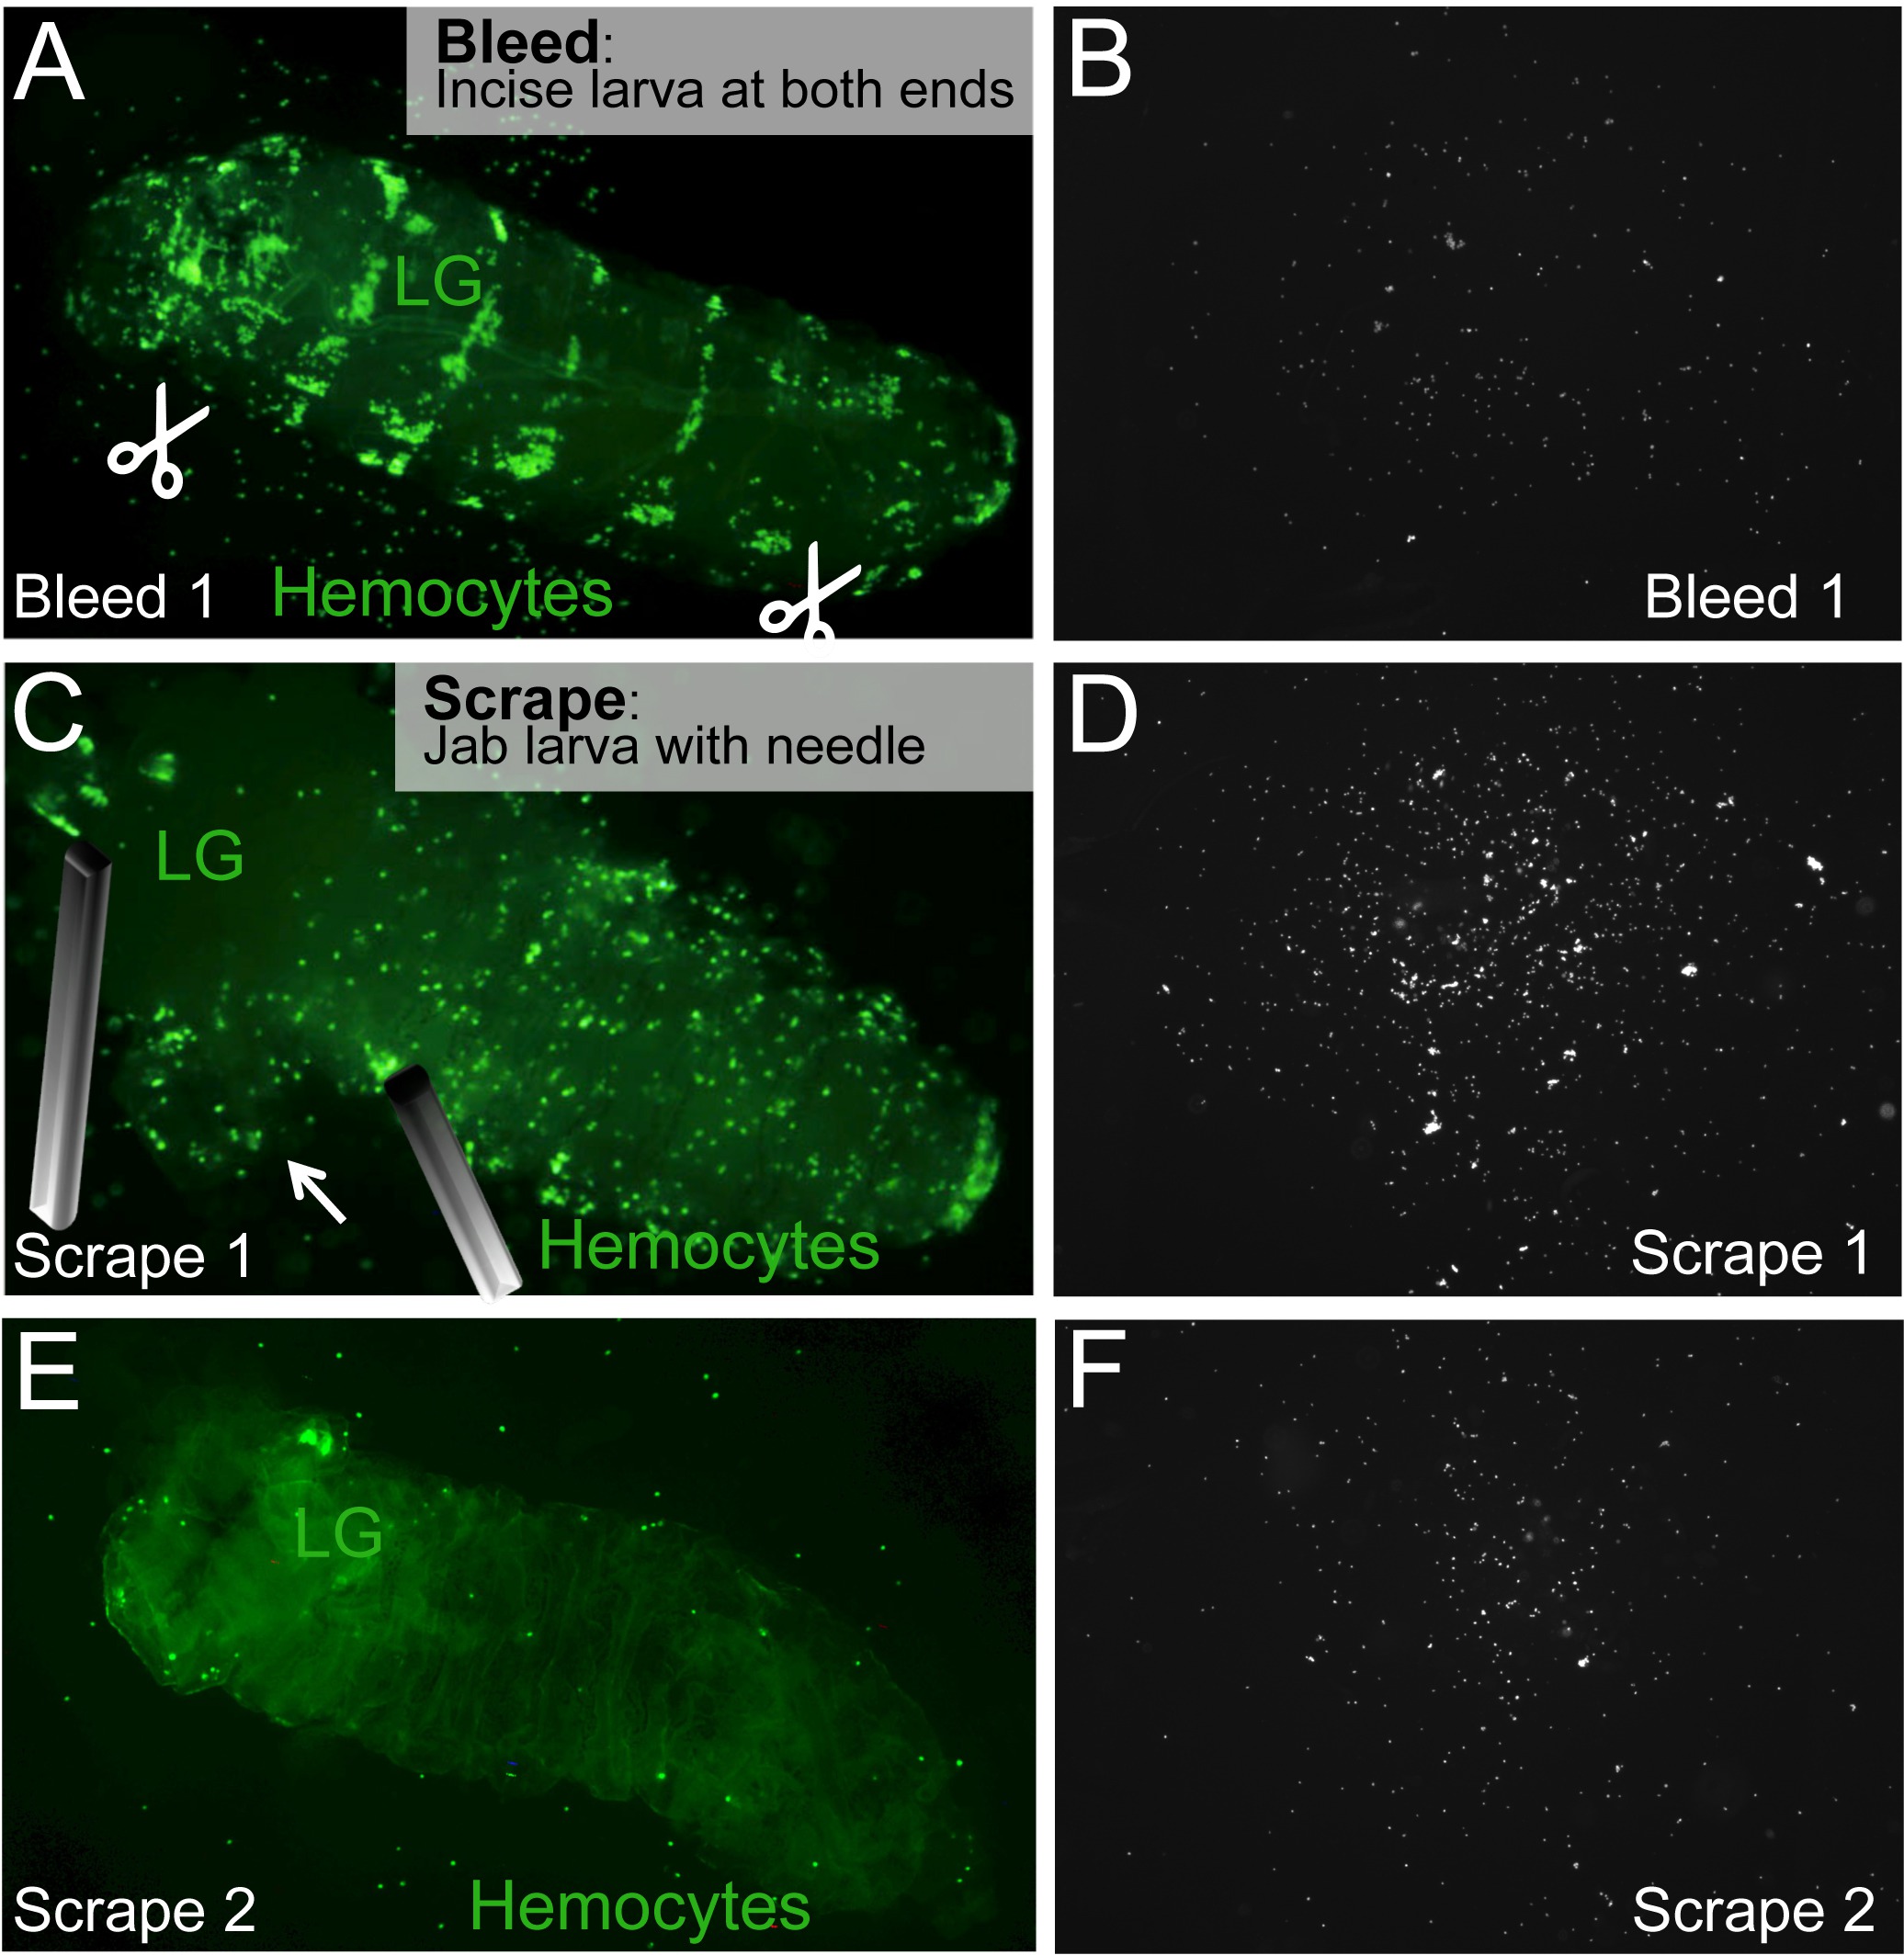
Figure 2. Bleed/Scrape Assay to release circulating and resident hemocytes. (A) To bleed a larva, ventral incisions at the posterior and anterior ends of the larva are made (scissors symbol). (B) Hemocytes in circulation will flow out of the incisions and settle on the surface of the slide. (C) The lymph gland (LG) is located and pinned down, without puncturing it. Resident hemocytes are released by jabbing and/or scraping the larva with a needle. (D) Resident hemocytes on slide. (E,F) The Scrape process is repeated until all resident hemocytes are released. The larval carcass containing the intact lymph gland is left behind. Please click here to view a larger version of this figure.

Figure 3. Automated quantification of hemocytes using ImageJ. (A,B) After opening a hemocyte image file in ImageJ, the Lower Threshold level is adjusted to account for all the cells in the image. (C,D) Analyze Particles requires setting the cell pixel size, circularity, and the result readout format (e.g., Overlay Outlines). (E) Summary window displaying the number of hemocytes. Please click here to view a larger version of this figure.

Figure 4. Representative Results (1). Hemocyte number and resident state over the course of larval development. (A) Overview of the larval stages used; 1st instar (48 hr AEL; ~1.2 mm length); 2nd instar (80 hr AEL; 2.5 mm length); 3rd instar (96 hr AEL; ~3.5 mm length). Genotype is HmlΔ-GAL4, UAS-GFP; He-GAL4. Stages were confirmed by assessing larval mouthhooks. (B) Bar diagram of circulating and resident hemocyte numbers at the respective larval stages. (C) Percentage of circulating hemocytes. Note that the fraction of circulating hemocytes increases disproportionally over the course of larval development. (D) Total hemocytes, resulting from the sum of circulating and resident hemocytes per larva. Hemocytes were quantified using the Bleed/Scrape method; n ≥ 6 larvae/condition, error bars show standard deviation, findings confirmed in 3 independent replicate experiments. Please click here to view a larger version of this figure.
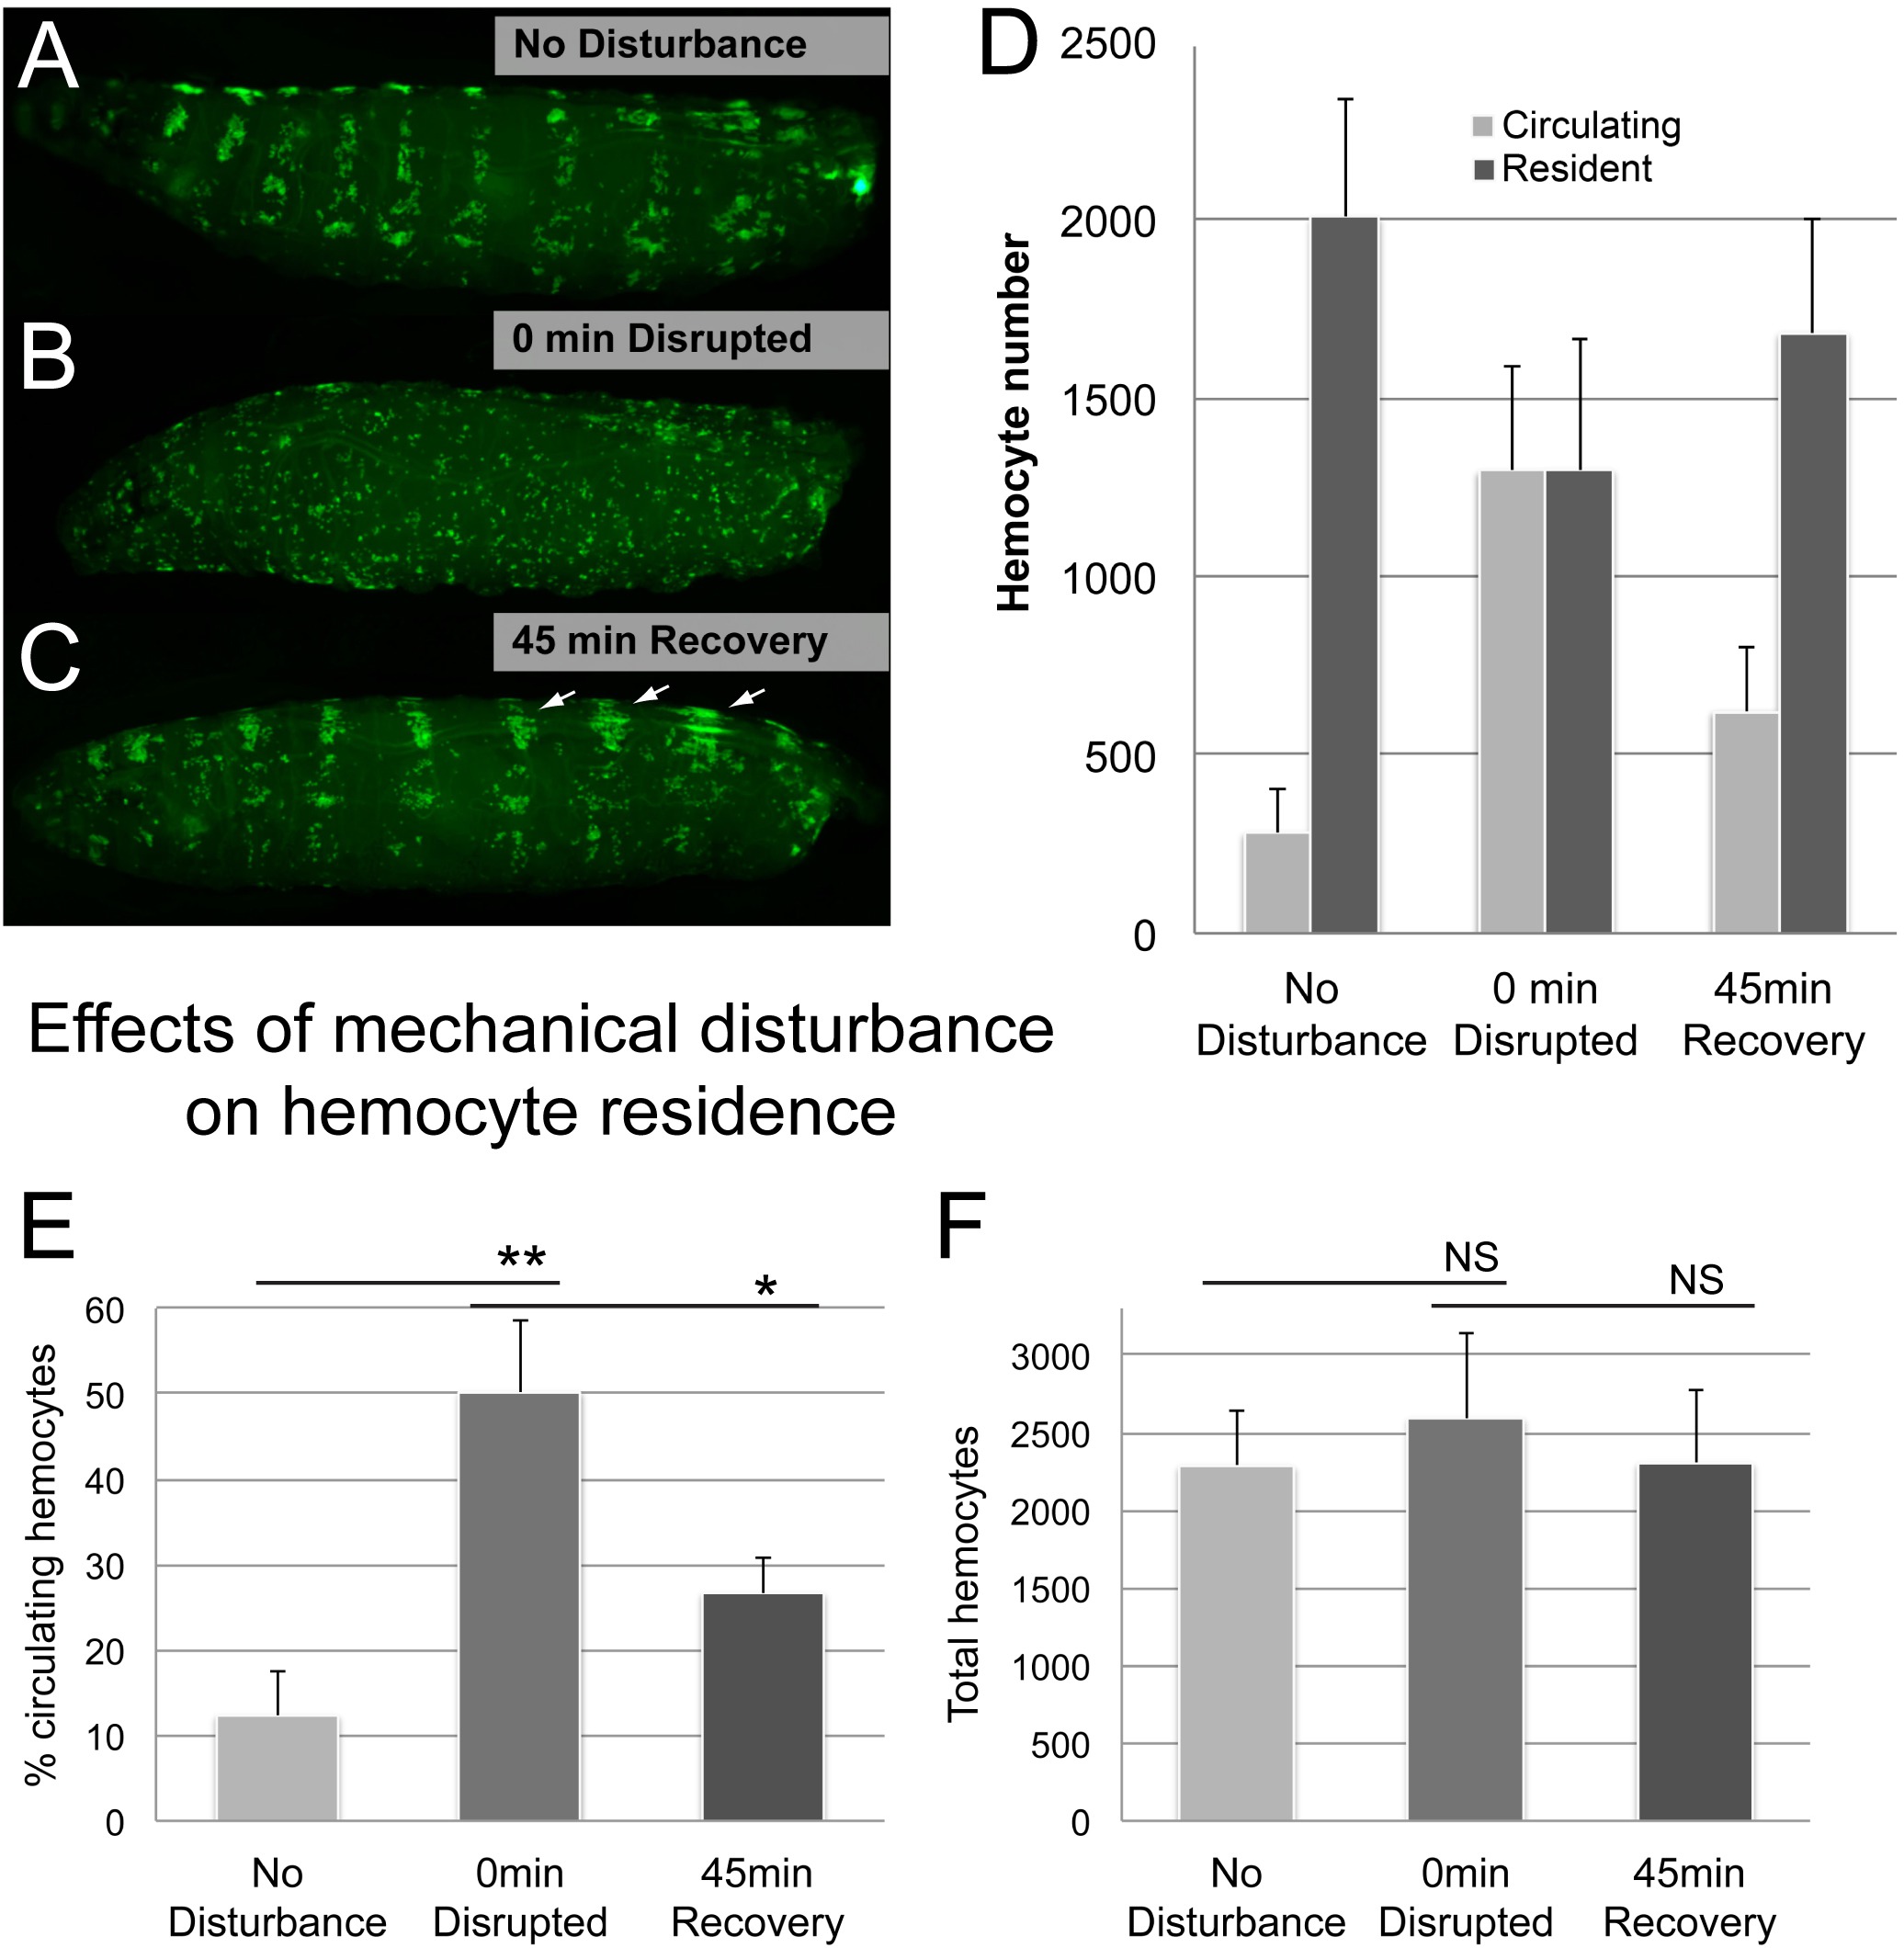
Figure 5. Representative Results (2). Effects of mechanical disturbance on hemocyte residence. (A-C) Example of a larva before and after vortexing with glass beads, followed by 45 min recovery. (A) No disturbance control; hemocytes are localized in Hematopoietic Pockets. (B) Disrupted hemocyte pattern at 0 min after vortexing larvae in a suspension of glass beads and water. (C) Hemocyte pattern at 45 min of recovery post-disturbance; many hemocytes have relocated to the Hematopoietic Pockets; note enlarged dorsal-vessel associated clusters and dorsal stripes which are predominant sites of early post-disturbance accumulation (arrows). Genotype is HmlΔ-GAL4, UAS-GFP; He-GAL4 x yw. (D) Percentage of circulating hemocytes quantified by the Bleed/Scrape method. (E) Total hemocytes, resulting from the sum of circulating and resident hemocytes per larva. n ≥ 4 larvae/condition, error bars show standard deviation, findings confirmed in 3 independent replicate experiments. Student’s t-test to confirm significance, NS (not significant), ** (p ≤ 0.05), ** (p ≤ 0.01). Please click here to view a larger version of this figure.
Discussion
Here, we describe the first method to quantitatively recover resident and circulating blood cells from single Drosophila larvae, and quantify these two hemocyte populations. The protocol comprises the sequential release of circulating and resident blood cells, followed by imaging and automated cell counting. Larval resident hemocytes can be transiently mobilized into circulation by mechanical disturbance, a process that is known to be largely reversed within a 30 - 60 min recovery period6. Accordingly, this protocol was tested in two ways, (1) by assessing the total hemocyte number per larva and fraction of circulating hemocytes over the course of larval development, and (2) by experimentally dislodging resident hemocytes using an automated method, which confirmed the tight correlation of hemocyte localization and hemocyte number in the resident and circulating populations. In addition, the reproducibility of the method was demonstrated by comparing two datasets of biological replicates.
In the past, laboratories have used a range of techniques to quantify larval hemocytes6,13,21. This protocol establishes a common standard to retrieve and quantify resident and circulating blood cell populations from Drosophila larvae, providing an easily adaptable platform. The method described is critical for studies that focus on the role of resident hemocytes and their microenvironment, the Hematopoietic Pockets4-6, and is suitable to study fluorescent protein transgene-carrying Drosophila strains in wild type and genetically modified backgrounds. The protocol is also relevant for studies that focus on hemocyte mobilization after immune challenge or injury, and genetically or environmentally induced signaling that triggers mobilization of resident hemocytes or changes in total hemocyte number (reviewed in 4). It should be noted that, in cases of premature differentiation and release of hemocytes from the lymph gland, distinguishing embryonic/larval versus lymph gland lineages may be limited by the expression pattern of the fluorescent hemocyte reporter used.
The protocol presented here relies on imaging live, fluorescently-labeled hemocytes. In the future, it may be modified to permit the detection of released cells after fixation, e.g., using immunocytochemistry. In this case, the protocol may need to be adapted to ensure complete adhesion of the blood cells, for example by increasing adhesion incubation times, and adding adhesive slide coating, such as concanavalin A. Since the method allows retrieval of hemocytes and their manipulation ex vivo, it will benefit a wide range of developmental, cell biological and biochemical studies. Resident and circulating blood cells are found during all postembryonic developmental stages of Drosophila and other invertebrates22, suggesting that adaptation of this method will benefit a wide range of studies beyond the Drosophila larval hematopoietic system.
Disclosures
The authors have nothing to disclose.
Acknowledgements
We thank Jesper Kronhamn and Dan Hultmark, Michael Galko, and the Bloomington Stock Center for the fly stocks. Special thanks to Courtney Onodera for advice with statistical analysis. We thank Katrina Gold for critical reading of the manuscript, and Kalpana Makhijani, Katrina Gold, members of the Derynck laboratory, and members of the Nystul laboratory for discussion and comments on the manuscript. This work was supported by grants from the UCSF Program for Breakthrough Biomedical Research (PBBR), Broad Center, Hellman Foundation, American Cancer Society RSG DDC-122595, American Heart Association 13BGIA13730001, National Science Foundation 1326268, National Institutes of Health 1R01GM112083-01 and 1R56HL118726-01A1 (to K.B.).
Materials
| Name | Company | Catalog Number | Comments |
|---|---|---|---|
| 6 cm/9 cm Petri dishes | One for each genotype to be evaluated | ||
| Water squirt bottle | |||
| Metal spoon/spatula | |||
| Thin paintbrush | e.g., a "liner" | ||
| Glass cavity dish | |||
| PAP pen: Super PAP PEN IM3580 | Beckman Coulter | ||
| Glass slides | Each slide will have 5 or more PAP PEN squares drawn on them. Size of squares depends on the imaging objective and magnification of the microscope camera; e.g., 2 mm squares. | ||
| Moist chamber | This will be used to prevent slides and wells from drying out: sealed container with wet paper towels lining the sides/bottom | ||
| Schneider’s Drosophila cell culture media | Invitrogen | ||
| Cold block | This is a metal block (a.k.a. heating block) chilled in bucket containing ice; preferably black-colored or other dark, non-reflective color | ||
| 2 x 1 ml syringes with needles (27 G ½") | Becton Dickinson | For dissections. | |
| Optional: Surgical spring scissors (cutting edge 2 mm) | Fine Science Tools | ||
| Glass beads, 212 - 600 μm | Sigma | ||
| 2 ml Eppendorf tubes | Eppendorf | One per genotype evaluating | |
| Vortex mixer | Fisher Scientific | ||
| Transgenic Drosophila larvae with fluorescently marked hemocytes. | Suitable transgenes include: HmlΔ-DsRed (Makhijani et al., 2011), MSNF9mo-mCherry (Tokusumi et al., 2009), BcF6-CFP and -GFP (Gajewski et al., 2007), or HmlΔ-GAL4 (Sinenko and Mathey-Prevot, 2004), Pxn-GAL4 (Stramer et al., 2005), He-GAL4 (Zettervall et al., 2004), Crq-GAL4 (by H. Agaisse (Stramer et al., 2005)), or eater-GAL4 (Tokusumi et al., 2009) combined with UAS-GFP or other fluorescent protein transgenes. | ||
| Fluorescence dissecting microscope | Leica | Here: Leica M205, optional with camera, imaging software and measuring module | |
| Inverted fluorescence microscope with camera attachment | Leica or Keyence | With or without tile scanning function (e.g., Leica DMI series, Keyence BIOREVO BZ-9000 series) |
References
- Lemaitre, B., Hoffmann, J. The host defense of Drosophila melanogaster. Annu Rev Immunol. 25, 697-743 (2007).
- Evans, C. J., Hartenstein, V., Banerjee, U. Thicker than blood: conserved mechanisms in Drosophila and vertebrate hematopoiesis. Dev Cell. 5, 673-690 (2003).
- Wood, W., Jacinto, A. Drosophila melanogaster embryonic haemocytes: masters of multitasking. Nat Rev Mol Cell Biol. 8, 542-551 (2007).
- Gold, K. S., Brückner, K. Drosophila as a model for the two myeloid blood cell systems in vertebrates. Experimental hematology. 42, 717-727 (2014).
- Makhijani, K., Brückner, K. Of blood cells and the nervous system: Hematopoiesis in the Drosophila larva. Fly. 6, 254-260 (2012).
- Makhijani, K., Alexander, B., Tanaka, T., Rulifson, E., Brückner, K. The peripheral nervous system supports blood cell homing and survival in the Drosophila larva. Development. 138, 5379-5391 (2011).
- Lanot, R., Zachary, D., Holder, F., Meister, M. Postembryonic hematopoiesis in Drosophila. Dev Biol. 230, 243-257 (2001).
- Holz, A., Bossinger, B., Strasser, T., Janning, W., Klapper, R. The two origins of hemocytes in Drosophila. Development. 130, 4955-4962 (2003).
- Sieweke, M. H., Allen, J. E. Beyond stem cells: self-renewal of differentiated macrophages. Science. 342, 1242974(2013).
- Davies, L. C., Jenkins, S. J., Allen, J. E., Taylor, P. R. Tissue-resident macrophages. Nature immunology. 14, 986-995 (2013).
- Bretscher, A. J., et al. The Nimrod transmembrane receptor Eater is required for hemocyte attachment to the sessile compartment in Drosophila melanogaster. Biology Open. 1-9, (2015).
- Leitao, A. B., Sucena, E. Drosophila sessile hemocyte clusters are true hematopoietic tissues that regulate larval blood cell differentiation. eLife. , (2015).
- Markus, R., et al. Sessile hemocytes as a hematopoietic compartment in Drosophila melanogaster. Proc Natl Acad Sci U S A. 106, 4805-4809 (2009).
- Babcock, D. T., et al. Circulating blood cells function as a surveillance system for damaged tissue in Drosophila larvae. Proc Natl Acad Sci USA. 105, 10017-10022 (2008).
- Sinenko, S. A., Mathey-Prevot, B. Increased expression of Drosophila tetraspanin, Tsp68C, suppresses the abnormal proliferation of ytr-deficient and Ras/Raf-activated hemocytes. Oncogene. 23, 9120-9128 (2004).
- Stramer, B., et al. Live imaging of wound inflammation in Drosophila embryos reveals key roles for small GTPases during in vivo cell migration. J Cell Biol. 168, 567-573 (2005).
- Tokusumi, T., Shoue, D. A., Tokusumi, Y., Stoller, J. R., Schulz, R. A. New hemocyte-specific enhancer-reporter transgenes for the analysis of hematopoiesis in Drosophila Genesis. 47, 771-774 (2009).
- Gajewski, K. M., et al. Identification of a crystal cell-specific enhancer of the black cells prophenoloxidase gene in Drosophila. Genesis. 45, 200-207 (2007).
- Lebestky, T., Chang, T., Hartenstein, V., Banerjee, U. Specification of Drosophila hematopoietic lineage by conserved transcription factors. Science. 288, 146-149 (2000).
- Zettervall, C. J., et al. A directed screen for genes involved in Drosophila blood cell activation. Proc Natl Acad Sci USA. 101, 14192-14197 (2004).
- Shim, J., Mukherjee, T., Banerjee, U. Direct sensing of systemic and nutritional signals by haematopoietic progenitors in Drosophila. Nature cell biology. 14, 394-400 (2012).
- Hartenstein, V. Blood cells and blood cell development in the animal kingdom. Annu Rev Cell Dev Biol. 22, 677-712 (2006).
Reprints and Permissions
Request permission to reuse the text or figures of this JoVE article
Request Permission