We present an experimental protocol to form a supported lipid bilayer on solid substrates without using lipid vesicles. We demonstrate a one-step method to form a lipid bilayer on silicon dioxide and gold as well as supported membranes with cholesterol-enriched domain for various biological applications.
Method Article
Biomembrane Fabrication by the Solvent-assisted Lipid Bilayer (SALB) Method
Opens in a new tab
In This Article
Summary
Loading...
$$\rightleftharpoonup{xx}$$
$$\longleftharp{xx}$$,
$$\longrightharp{xx}$$,
Abstract
Loading...
$$\rightleftharpoonup{xx}$$
$$\longleftharp{xx}$$,
$$\longrightharp{xx}$$,
In order to mimic cell membranes, the supported lipid bilayer (SLB) is an attractive platform which enables in vitro investigation of membrane-related processes while conferring biocompatibility and biofunctionality to solid substrates. The spontaneous adsorption and rupture of phospholipid vesicles is the most commonly used method to form SLBs. However, under physiological conditions, vesicle fusion (VF) is limited to only a subset of lipid compositions and solid supports. Here, we describe a one-step general procedure called the solvent-assisted lipid bilayer (SALB) formation method in order to form SLBs which does not require vesicles. The SALB method involves the deposition of lipid molecules onto a solid surface in the presence of water-miscible organic solvents (e.g., isopropanol) and subsequent solvent-exchange with aqueous buffer solution in order to trigger SLB formation. The continuous solvent exchange step enables application of the method in a flow-through configuration suitable for monitoring bilayer formation and subsequent alterations using a wide range of surface-sensitive biosensors. The SALB method can be used to fabricate SLBs on a wide range of hydrophilic solid surfaces, including those which are intractable to vesicle fusion. In addition, it enables fabrication of SLBs composed of lipid compositions which cannot be prepared using the vesicle fusion method. Herein, we compare results obtained with the SALB and conventional vesicle fusion methods on two illustrative hydrophilic surfaces, silicon dioxide and gold. To optimize the experimental conditions for preparation of high quality bilayers prepared via the SALB method, the effect of various parameters, including the type of organic solvent in the deposition step, the rate of solvent exchange, and the lipid concentration is discussed along with troubleshooting tips. Formation of supported membranes containing high fractions of cholesterol is also demonstrated with the SALB method, highlighting the technical capabilities of the SALB technique for a wide range of membrane configurations.
Introduction
Loading...
$$\rightleftharpoonup{xx}$$
$$\longleftharp{xx}$$,
$$\longrightharp{xx}$$,
The solid-supported lipid bilayer1 (SLB) is a versatile platform which preserves the basic characteristics of biomembranes such as the bilayer thickness, two-dimensional lipid diffusivity, and the ability to host membrane-associated biomolecules. Due to the complexity of natural cell membranes, this simple platform has been shown to function as an efficient platform for in vitro studies of membrane-related processes such as raft formation2, protein binding3, virus and virus-like particle binding4,5, and cell signaling6. Formed in close proximity to a solid support, the SLB platform is compatible with a range of surface-sensitive measurements techniques such as total internal reflection microscopy (TIRF), quartz crystal microbalance-dissipation (QCM-D), and impedance spectroscopy.
Several methods have been developed to produce different types of SLBs, including air bubble collapse7 and dip-pen nanolithography8 for submicron-sized lipid spots, spin-coating9 for bilayer stacks and Langmuir−Blodgett (LB)10 and vesicle fusion (VF)11 for full-spanning, single lipid bilayer coatings. The VF method consists of the adsorption of small unilamellar vesicles to a solid support and subsequent spontaneous rupture and fusion to form a continuous lipid bilayer. However, under physiological conditions, spontaneous vesicle rupture is mainly limited to silicon-based materials such as silicon dioxide, glass, and mica. In addition, vesicle rupture does not occur spontaneously for vesicles of complex lipid compositions such as those containing high fractions of cholesterol or negatively charged lipids. Depending on the system, vesicle rupture may be induced by further tailoring the experimental conditions such as temperature12, solution pH13, and salinity14, osmotic shock15 or pressure16, or addition of divalent ions such as Ca2+ 17 . Alternatively, the membrane-active AH peptide can be introduced in order to destabilize a layer of adsorbed vesicles, leading to vesicle rupture and bilayer formation on a range of surfaces18-22.
Moreover, successful bilayer formation requires preparation of a well-controlled population of small unilamellar vesicles that can be time consuming and difficult to achieve for certain membrane compositions. Therefore, despite its high efficiency in optimal cases (e.g., after extensive freeze-thaw pretreatment of vesicles23), the general application of vesicle fusion is limited by the scope of suitable substrates and membrane compositions .
The solvent-assisted lipid bilayer (SALB) method24-28 is an alternative fabrication technique which does not require lipid vesicles. The method is based on the deposition of lipid molecules onto a solid surface in the presence of a water miscible organic solvent followed by gradual exchange of this solvent with an aqueous buffer solution in order to trigger SLB formation. During the solvent-exchange step, the ternary mixture of lipids, organic solvent, and water undergoes a series phase transitions with increasing water fraction, which leads to the formation of lamellar phase structures in the bulk solution and an SLB on the solid substrate. Importantly, this self-assembly route bypasses the need for vesicle rupture, which is usually the limiting step for the transformation of adsorbed vesicles into an SLB. The protocol is applicable to a wide variety of surfaces including silicon dioxide, aluminum oxide, chrome, indium tin oxide, and gold. In this paper and in the accompanying video, a comparison of lipid deposition by the SALB and vesicle fusion methods is presented. In particular, the influence of experimental parameters, including lipid concentration, flow rate, and the choice of water miscible organic solvent, on the quality of the bilayer formed by the SALB method are discussed. Analytical characterization of the fabricated SLBs is performed by the QCM-D, fluorescence microscopy, and fluorescence recovery after photobleaching (FRAP) techniques. QCM-D monitoring is a surface-sensitive mass measurement technique which, since the pioneering work conducted by Keller and Kasemo29, has been extensively used to quantitatively investigate bilayer formation. Fluorescence microscopy permits inspection of membrane homogeneity as well as the visualization of membrane domains. The FRAP technique is a standard tool to determine the lateral mobility of lipid molecules in an SLB, which is an essential property of fluidic membranes.
The first part of this study involves QCM-D analysis of the SALB and vesicle fusion methods applied to attempt bilayer formation on silicon dioxide and gold. In the second part, the preparation and characterization of supported membranes containing a range of cholesterol concentrations with the SALB method are demonstrated and the results are compared with those obtained by the vesicle fusion method.
Protocol
Loading...
$$\rightleftharpoonup{xx}$$
$$\longleftharp{xx}$$,
$$\longrightharp{xx}$$,
1. Formation of Supported Lipid Bilayer on a Hydrophilic Solid Support
- Prepare lipid stock solutions of 10 mg/ml 1,2-dioleoyl-sn-glycero-3-phosphocholine (DOPC) and 1 mg/ml 1,2-dioleoyl-sn-glycero-3-phosphoethanolamine-N-(lissamine rhodamine B sulfonyl) (Rh-PE) by dissolving the respective lipid powders (appropriately weighed beforehand with an analytical mass balance) in isopropanol solution.
- Dilute and mix the stock solutions in isopropanol in order to prepare the desired lipid mixture at the final concentration. For fluorescence microscopy and FRAP experiments,0.5 wt% Rh-PE should be included in the lipid mixture.
- Inject the lipid mixture in isopropanol into the microfluidic channel until it is filled.
- Incubate the lipid mixture on the glass surface for about 10 min.
- Gradually replace the lipid solution with water or buffer solution using a peristaltic pump at a very low flow rate (10-50 µl/min). Alternatively, replace the lipid mixture by repeated pipetting.
- Rinse the channel thoroughly with excess buffer in order to remove the residual isopropanol.
2. Formation of Cholesterol-enriched Supported Membranes
Note: The solid surface (SiO2) supports vesicle fusion, but the membrane composition (high cholesterol) inhibits vesicle fusion because cholesterol-enriched vesicles have high bending rigidity30.
- Prepare a stock solution containing 10 mg/ml DOPC lipid, 10 mg/ml cholesterol, and 1 mg/ml Rh-PE by first dissolving the respective powders in isopropanol.
- Repeat steps 1.2-1.6 using the stock solutions prepared in step 2.1.
3. Membrane Fluidity Assay
- Immerse the glass slide in sodium dodecyl sulfate (SDS) solution (1%) for 10 min.
- Wash the slides thoroughly with deionized water and rinse with ethanol.
- Blow-dry slides using a gentle stream of nitrogen.
- Expose the slides to oxygen plasma for 30 sec at maximum radiofrequency power in the oxygen plasma chamber.
- Remove the protective film coating of the bottomless commercial microfluidic chamber (Figure 1A) using a tweezer and attach the glass slide onto the sticky side of the chamber (Figure 1B).
- Assemble the connectors and tubing into the inlet and outlet positions of the chamber and place the microfluidic channel on the microscope stage (Figure 1C).
- Form a fluorescently-labeled supported lipid bilayer in the microfluidic channel [repeat step 1 using the desired lipid composition (e.g., 0.5 mg/ml DOPC) including 0.5 wt% Rh-PE in organic solvent].
- Locate the bilayer plane with a 60X oil immersion objective (NA 1.49) in order to capture images.
- Take two pre-bleach images, then photo-bleach a 30 µm wide circular spot with a 532 nm, 100 mW laser beam. Before photobleaching, warm up the laser until its intensity has become stable. Immediately after photobleaching, capture a series of images every 1 sec for 2 min in order to follow the recovery in fluorescence intensity at the bleached spot.
4. Cholesterol Quantification Assay
- Expose the silicon dioxide-coated quartz crystal sensor chip to oxygen plasma for 30 sec at maximum radiofrequency power in the oxygen plasma chamber. Remove the chip from the chamber and immediately mount the chip in the measurement chamber.
- Before experiment, first acquire the frequency and dissipation of the sensor chip in air in order to ensure proper mounting.
- For the commercial Q-Sense E1 or E4 QCM-D instrument, run the Q-Soft software program and click “Acquisition” and select “Setup Measurement”.
- In the new window which appears, check the 3, 5, 7, 9, 11 and 13 overtones and then click Find and Run in order to check the resonance spectra. Set the temperature at 24 °C. If one or more resonance frequencies do not agree with the expected values, check the chip mounting and re-perform this step until an agreement is reached.
- Start the peristaltic pump and flow buffer solution (10 mM Tris, 150 mM NaCl, pH 7.5) into the measurement chamber at a flow rate of 100 µl/min.
- In the software program, click “Acquisition” and select “Restart Measurement” in order to record the resonance frequency and energy dissipation signals. Repeat this step until a stable baseline is obtained for the frequency and dissipation shifts. Note: For steps hereafter, there will be additional frequency and dissipation shifts which can be recorded as a function of time.
- Inject isopropanol (without lipid) for 10 min.
- Inject the mixture of DOPC lipid/cholesterol at the desired molar ratio with a total lipid concentration of 0.5 mg/ml in isopropanol for 10 min.
- Inject buffer for 20 min at a flow rate of 100 µl/min.
- Inject a solution of 1 mM methyl-β-cyclodextrin (MβCD) prepared in buffer (flow rate 100 µl/min) until the frequency signal reaches a stable value.
- Measure the relative positive frequency shifts that is caused by the MβCD treatment step and calculate the mass of cholesterol and DOPC lipids by converting the Δfcho and ΔfDOPC values to mass values by using the Sauerbrey equation [Δm = -(C/n)×Δf, where C=17.7 ng/cm2, n:overtone].
- Calculate the mole fraction of cholesterol in the SLB, taking into account the molecular weights of DOPC lipid (786.1 g/mol) and cholesterol (386.6 g/mol).
Results
Loading...
$$\rightleftharpoonup{xx}$$
$$\longleftharp{xx}$$,
$$\longrightharp{xx}$$,
Fabrication of supported lipid bilayers on hydrophilic substrates.
The VF and SALB formation methods were attempted on silicon dioxide and gold and the formation processes were monitored in real-time by the QCM-D measurement technique. The QCM-D instrument measures changes in the resonance frequency (Δf) of an oscillating piezoelectric quartz crystal upon mass adsorption onto the surface of the crystal. In addition, the QCM-D instrument measures the dissipation of the oscillation energy in order to characterize the viscoelastic properties (rigidity and softness) of the adlayer. Vesicle fusion experiments were performed as previously described31. Briefly, a baseline was first established for the frequency and dissipation signals in aqueous buffer solution [10 mM Tris, 150 mM NaCl, pH 7.5; (Figure 2A and B)]. Next, small unilamellar DOPC lipid vesicles in the same buffer were injected at t = 10 min (arrow 1) onto silicon dioxide (Figure 2A) and gold (Figure 2B). For vesicle fusion on silicon dioxide, two-step adsorption kinetics were observed with final changes in frequency and energy dissipation of −26 (± 1) Hz and 0.3 (± 0.2) × 10−6, respectively. These values are consistent with the formation of a supported lipid bilayer29.
As shown in Figure 2B, the addition of the vesicle solution to the gold surface led to a simultaneous decrease and increase in Δf and ΔD signals, respectively, until their values reached −150 (± 10) Hz and (7.5 ± 2) × 10−6, respectively. These values correspond to the formation of an adsorbed vesicle layer. Thus, as expected, an SLB was not formed on gold via the vesicle fusion method.
QCM-D analysis for bilayer formation on silicon dioxide and gold by the SALB method is presented in Figure 2C and D. On silicon dioxide, final Δf and ΔD shifts of −25.6 (± 0.55) Hz and 0.4 (± 0.27) × 10−6, respectively, were achieved and these values indicate formation of an SLB. Similar ranges of Δf and ΔD (ΔfAu: −27.3 ± 2.7 Hz, ΔDAu: 0.48 (± 0.26) × 10−6) were observed on gold. These results support that the SALB method enables formation of supported lipid bilayers on surfaces which prevent vesicle rupture.
Effect of solvent-exchange flow rate on the quality of supported lipid bilayers.
To determine the optimal conditions for fabrication of high quality supported lipid bilayers via the SALB method, the influence of lipid concentration, solvent-exchange rate and the choice of organic solvent were examined.
Figure 3 shows the change in QCM-D frequency during the final step of the SALB protocol, as performed on silicon dioxide at two different flow rates (100 and 600 µl/min) and two different lipid concentrations (0.125 and 0.5 mg/ml).
When 0.5 mg/ml DOPC lipid was used (Figure 3A), bilayer formation was not affected by the flow rate and a final Δf shift of about −26 Hz was obtained at both flow rates.
By contrast, when a lower lipid concentration was used, the amount of adsorbed lipid after complete solvent exchange was significantly affected by the flow rate (Figure 3B). At an average flow rate of 100 µl/min, bilayer formation was complete (Δf around −26 Hz). However, at a 6-fold higher flow rate (600 µl/min), a complete bilayer was not formed (Δf around −17 Hz). These results provide a guideline for choosing the right experimental conditions for successful bilayer formation using the SALB method with isopropanol as the organic solvent of choice.
Characterization of supported lipid bilayers formed from different lipid concentrations in various alcohol solutions.
Lipid concentration is another parameter that affects the quality of SLBs obtained by using the SALB method. Fluorescence microscopy revealed that, at 0.05 mg/ml lipid concentration, only isolated, sub-microscopic lipid structures were formed (Figure 4A). With increasing lipid concentration used in the SALB procedure, the fluorescence intensity of the lipid structures became more homogenous. At 0.1 mg/ml lipid concentration, there were microscopic lipid patches although the structures did not span across the entire field of view (Figure 4B). However, when 0.25 mg/ml lipid concentration was used, a homogenous lipid bilayer was formed (Figure 4C). Therefore, there is a minimum lipid concentration required to form a complete, full-spanning SLB.
The influence of lipid concentration on the final outcome of the SALB experiments was also examined over a wider lipid concentration range (0.01 to 5 mg/ml) and in different organic solvents (isopropanol, ethanol, and n-propanol). The Δf and ΔD values corresponding to the final step in the SALB procedure are presented in Figure 5.
We defined bilayer formation based on final changes in frequency and energy dissipation between -25 and -30 Hz and less than 0.5 x 10⁻⁶, respectively. Based on these criteria, the optimal lipid concentration range to form a supported lipid bilayer was determined to be between 0.1 and 0.5 mg/ml largely independent of the type of organic solvent. The deviations in the acquired Δf and ΔD shifts outside of the aforementioned range is due to the presence of additional mass (e.g., bilayer stacks),the occurrence of non-bilayer morphologies (e.g., vesicles, worm-like micelles), and the presence of fragmented bilayer islands with incomplete morphology across the substrate.
While the SALB procedure to obtained supported lipid bilayers is relatively robust, the optimal lipid concentration for high-quality bilayer formation may require tuning depending on the specific experimental configuration. Basically, there is not only a minimum lipid concentration but also a maximum lipid concentration required for optimal bilayer formation via the SALB method. The optimal concentration range depends on the flow rate and may be also be affected by the substrate and lipid composition. Empirically, in many cases, we have found that a lipid concentration of 0.5 mg/ml and a flow rate of 100 µl/min is the optimal set of conditions for the formation of a homogenous supported lipid bilayer. However, depending on the lipid composition and flow-cell geometry—the latter of which affects the flow profile during solvent exchange—further optimization of the lipid concentration might be necessary. Thus, we recommend performing pilot SALB experiments using a 0.5 mg/ml lipid concentration and assess the bilayer quality using the QCM-D or fluorescence microscopy techniques. If the bilayers appear incomplete, then the lipid concentration should be increased in 10% increments until satisfactory outcomes are achieved. If the bilayer appears to co-exist with additional lipid structures, then the lipid concentration should be decreased in 10% increments until satisfactory outcomes are achieved.
Fabrication of supported lipid bilayers with various lipid compositions and different cholesterol fractions.
Next, the SALB and VF methods were employed in order to form cholesterol-enriched SLBs. Figure 6 shows representative fluorescence images (100 × 100 µm) of cholesterol-containing supported membranes prepared by the SALB method. The membranes consist of circular shaped dye-excluded domains surrounded by a continuous phase characterized by uniform fluorescent brightness. The dark domains increased in area with increasing cholesterol fraction in the precursor lipid mixture. Next, FRAP measurements were performed in order to examine the fluidity of the lipid bilayer films. The FRAP measurements revealed almost complete fluorescence recovery in the surrounding phase, indicating the lateral mobility of lipids and thus formation of a single lipid bilayer. Since Rh-PE partitions preferentially into the fluid phase, the dark domains are most likely composed of dense cholesterol-enriched structures.
For comparison, the fabrication of DOPC/Chol bilayers using the VF method was also attempted. DOPC vesicles with increasing cholesterol fractions (10 - 40 mol%) were prepared by the vesicle extrusion method. Rh-PE lipid (0.5 wt%) was used as the fluorescent label for imaging. Figure 7 shows representative fluorescence images (100 × 100 µm) of structures created upon incubation of the glass substrates with cholesterol-containing vesicles. FRAP analysis showed the formation of a fluidic lipid bilayer using vesicles that contained 20 mol% Chol or less. However, samples prepared by using vesicles with higher cholesterol fractions did not exhibit recovery, indicating the presence of adsorbed but unruptured vesicles.
The fraction of cholesterol which was ultimately incorporated into the supported lipid bilayers was quantified as a function of the cholesterol fraction which had been included in the precursor lipid mixture in organic solvent in the SALB method or in the vesicles in aqueous solution in the VF method. Using the QCM-D technique, bilayer formation was monitored and then MβCD was added in order to specifically extract Chol from the supported lipid bilayers32. The mass loss due to the removal of cholesterol led to a decrease in the absolute value of the frequency shift (|Δf|) associated with the SLB. The relative positive frequency shifts caused by the MβCD treatment step are shown in Figure 8A. The mole fraction of cholesterol was calculated based on the frequency shift, as presented in Figure 8B.
The cholesterol fraction incorporated into supported lipid bilayers prepared by the SALB method was almost linearly proportional to the cholesterol contents in the precursor lipid mixture. Interestingly, the cholesterol fraction in bilayers prepared by the VF method (vesicles containing up to 20 mol% Chol) was substantially lower than that contained in the precursor vesicles. In fact, the highest fraction of cholesterol obtained by the VF method was only about 10 mol%.
Observation of stripe superstructure in the β-two-phase co-existence region of cholesterol-phospholipid supported lipid bilayers.
SALB experiments were further performed using a lipid mixture with an even higher fraction of cholesterol. When a 4:6 mixture of DOPC and cholesterol was used, a gradual demixing of a uniform liquid phase into two coexisting phases visualized as bright stripe-shaped domains on a dark (dye-excluding) background was observed (Figure 9). It is established that Rh-PE is excluded from cholesterol-rich domains33, and hence the predominant dark domains which appeared as background are cholesterol-enriched regions. The formation of micron-sized bright domains on a dark background at high cholesterol fraction (>50 mol%) is consistent with the β region in the monolayer phase diagram of cholesterol/phospholipids mixtures34,35. Moreover, the formation of stripe domains, which arise from a weak line tension, suggests that the mixture is near a miscibility critical point.
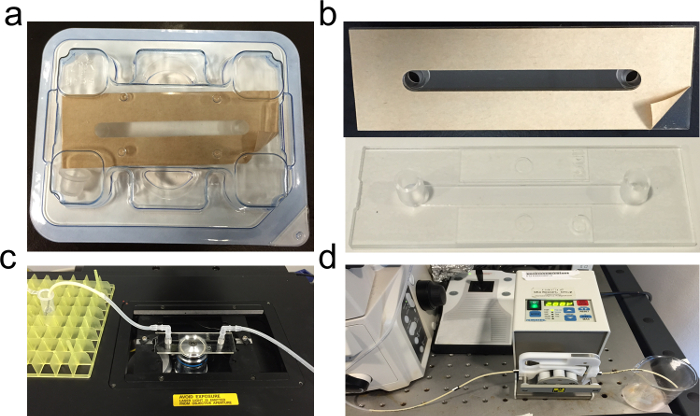
Figure 1. Microfluidic chamber for SALB formation in a suitable configuration for epifluorescence microscopy. (A) Commercial microfluidic chamber, (B) Glass coverslip attached onto the adhesive side of the chamber, (C) Complete setup on a microscope holder with tubing connected into the inlet and outlet ports of the chamber, and (D) Peristaltic pump used to control the rate of solvent exchange. Lipids dissolved in isopropanol are injected into the measurement chamber with the aid of the peristaltic pump. Please click here to view a larger version of this figure.
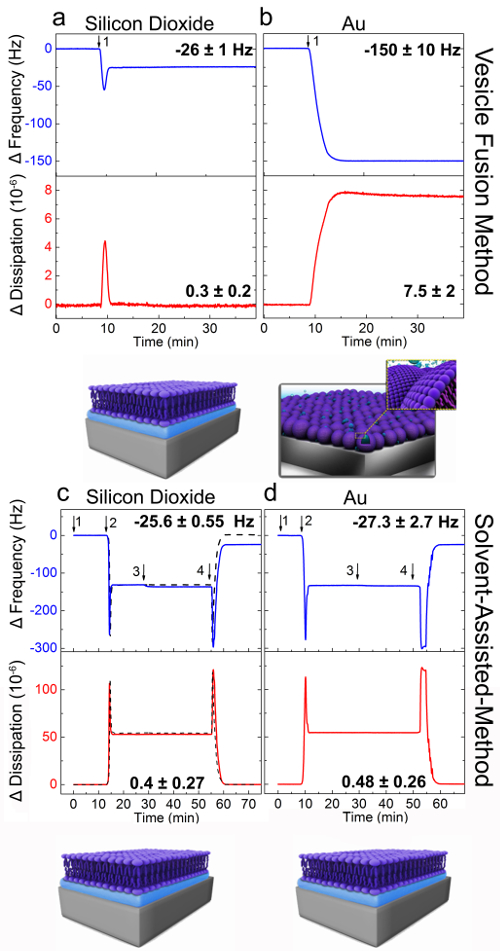
Figure 2. QCM-D analysis of vesicle fusion and SALB experiments on silicon dioxide and gold substrates. QCM-D frequency (Δf, blue) and dissipation (ΔD, red) responses for the third overtone (n = 3) were recorded as a function of time during lipid adsorption onto (A and C) silicon dioxide, (B and D) gold. Panels a and b present the vesicle fusion method. DOPC lipid vesicles were injected at t = 10 min (arrow 1). Panels c and d correspond to the SALB formation method. Arrows indicate the injection of buffer (1), isopropanol (2), lipid mixture [0.5 mg/ml DOPC lipid in isopropanol; (3)] and buffer exchange (4). The dashed curve in panel B corresponds to a control experiment in which lipid was not injected. The final values of Δf and ΔD for each surface are specified. The schematics show the proposed assembled lipid structures as inferred from the final frequency and dissipation shifts. Adapted from reference 24 and used with permission of the American Chemical Society. Please click here to view a larger version of this figure.
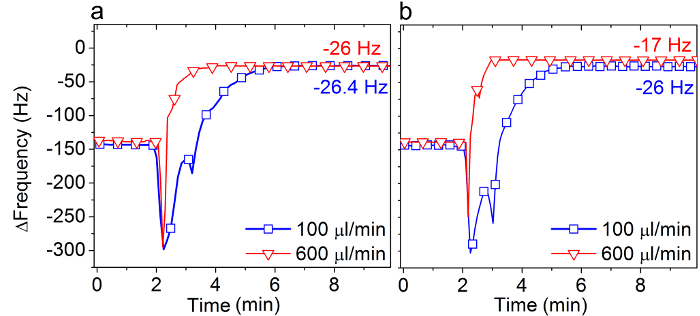
Figure 3. Influence of the solvent-exchange rate on the SALB formation process. QCM-D frequency shifts (Δf) corresponding to the final step (see Arrow 4 in Figure 2C) in the SALB method were measured on silicon dioxide at two different exchange rates, 100 and 600 µl/min, using (A) 0.5 mg/ml and (B) 0.125 mg/ml DOPC lipid in isopropanol. The final Δf values are also specified, as compared to the measurement baseline in aqueous buffer solution. Adapted from reference 24 and used with permission of the American Chemical Society. Please click here to view a larger version of this figure.

Figure 4. Threshold of Lipid Concentration for Complete SALB Formation. Epifluorescence microscopy of lipid layers on silicon dioxide prepared by SALB using (A) 0.05 mg/ml ; (B) 0.1 mg/ml; and (C) 0.25 mg/ml lipid concentration. Adapted from reference 26 and used with permission of the American Chemical Society. Please click here to view a larger version of this figure.
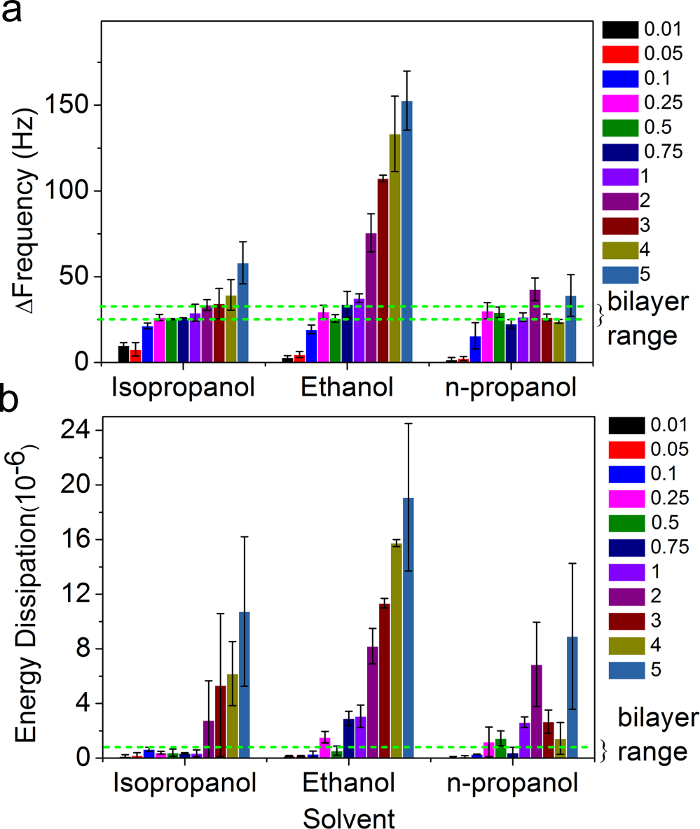
Figure 5. Influence of lipid concentration and organic solvent on supported lipid bilayer formation by the SALB method. The final changes in QCM-D (A) frequency and (B) energy dissipation for SALB experiments using various organic solvents, as a function of lipid concentration. The dashed green lines correspond to the expected frequency and dissipation shifts for a complete bilayer (-30 Hz < Δf < -25 Hz and ΔD < 1 x 10⁻⁶). Adapted from reference 26 and used with permission of the American Chemical Society. Please click here to view a larger version of this figure.
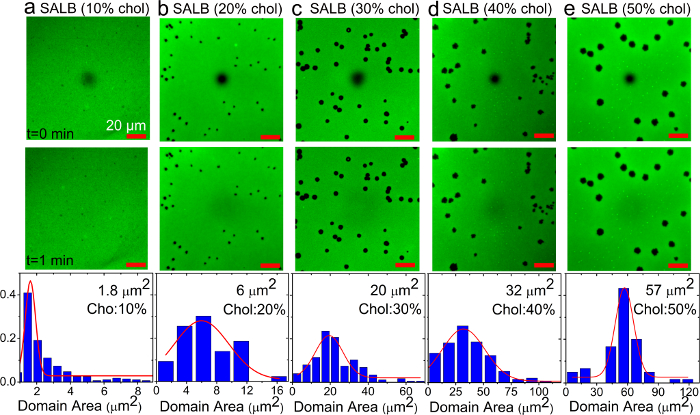
Figure 6. Fluorescence recovery after photobleaching analysis of supported lipid bilayers with varying fractions of cholesterol prepared by the SALB method on a glass substrate. (A-E) Fluorescence micrographs of bilayers prepared using various cholesterol fractions in the precursor mixture. Images were recorded immediately (top) and 1 min (middle) after photobleaching. The dark spot in the image center corresponds to the photobleached region. The scale bars are 20 µm. Surface area histograms of individual dye-excluded domains within each sample are also presented (bottom). Adapted from reference 36 and used with permission of the American Chemical Society. Please click here to view a larger version of this figure.
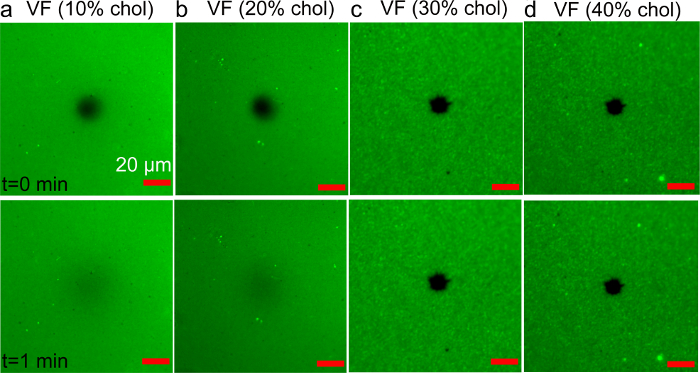
Figure 7. FRAP analysis of cholesterol-containing supported bilayers prepared by the vesicle fusion method. (A-D) Fluorescence micrographs of bilayers prepared using various cholesterol fractions (10 to 40 mol%), in the precursor vesicles. Images were recorded immediately (top) and 1 min (bottom) after photobleaching. The dark spot in the image center corresponds to the photobleached region. The scale bars are 20 µm. Adapted from reference 36 and used with permission of the American Chemical Society. Please click here to view a larger version of this figure.
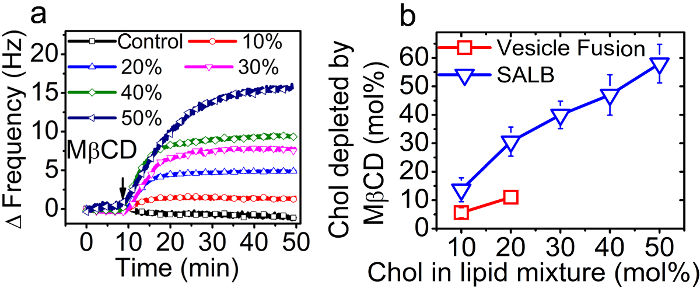
Figure 8. Quantification of cholesterol fraction in supported lipid bilayers. (A) The positive QCM-D frequency shift upon injection of 1 mM MβCD onto supported lipid bilayers with varying mole fractions of cholesterol in the precursor mixture (between 0 and 50 mol%). (B) Mole percent of cholesterol depleted from the bilayers prepared by the SALB and vesicle fusion methods as a function of the cholesterol fraction in the precursor mixtures or vesicles. Adapted from reference 36 and used with permission of the American Chemical Society. Please click here to view a larger version of this figure.
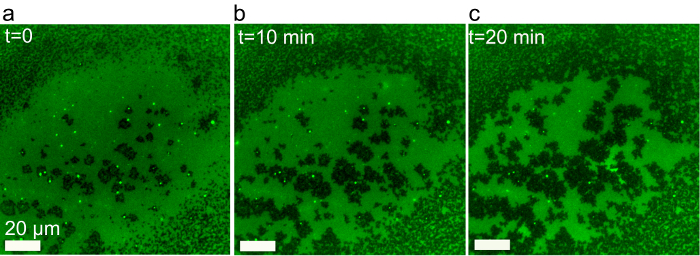
Figure 9. Time dependent evolution of fluorescence microstructure in a supported bilayer of DOPC/Chol (4:6 molar ratio containing 0.5% Rhodamine-PE) prepared by the SALB method. A uniform phase gradually phase separates into a liquid-liquid coexistence region upon complete solvent exchange. Adapted from reference 37 and used with permission of the American Chemical Society. Please click here to view a larger version of this figure.
Discussion
Loading...
$$\rightleftharpoonup{xx}$$
$$\longleftharp{xx}$$,
$$\longrightharp{xx}$$,
In this work, a solvent-exchange protocol is presented in which lipids in alcohol (isopropanol, ethanol, or n-propanol) are incubated with a solid support and then the alcohol is replaced gradually with an aqueous buffer solution in order to drive a series of phase transitions eventually producing lamellar-phase lipid bilayers24. It is shown that the method enables fabrication of supported lipid bilayers on surfaces such as gold, which is intractable to the vesicle fusion method.
An optimal lipid concentration range (0.1 - 0.5 mg/ml) has been determined for complete bilayer formation in standard experimental formats tested thus far. At lipid concentrations below 0.1 mg/ml, discrete, microscopic patches of bilayers formed. On the other hand, at concentrations above 0.1 mg/ml and lower than 0.5 mg/ml, a complete and uniform bilayer is formed. At lipid concentrations above this range, a fluid bilayer was still formed as verified by FRAP analysis, however, fluorescence microscopy reveals the presence of additional lipid structures on top of the bilayer. Strikingly, the morphology of these additional lipid structures, as determined by QCM-D analysis, depended on the alcohol which was used during the incubation step. In the case of ethanol, the relatively high Δf and ΔD shifts resemble the QCM-D signature obtained for an adsorbed vesicle layer. When isopropanol or n-propanol was instead used, the Δf was slightly higher than the value expected for a bilayer (final Δf between -30 to -40 Hz), while the ΔD was appreciably higher. Such QCM-D responses would be expected for extended lipid structures (e.g., worm-like micelles) protruding outward from the membrane surface (as visible by fluorescence microscopy in some cases).
The rate of solvent exchange is another important parameter which can be critical, especially when lower lipid concentrations (e.g., 0.1 mg/ml) are used. Rapid solvent exchange at low lipid concentration can lead to the formation of incomplete bilayers. In the standard measurement chamber used for QCM-D measurements in this paper (Q-Sense E4 measurement chamber), flow rates of around 100 µl/min, were suitable for highly reproducible complete bilayer formation. For flow cells with other geometries and volume, the optimal flow rate may vary and must be empirically determined based on the steps suggested herein.
In addition to form supported lipid bilayers on surfaces which are intractable to vesicle fusion, the SALB can be employed to circumvent the need for lipid vesicles which can rupture, thereby opening the door to the fabrication of supported membranes with complex compositions. As an illustrative example composition, lipid mixtures with a high fraction of cholesterol were examined. Cholesterol is an important component of mammalian cell membranes, and its fraction can approach 45−50 mol% of the membrane lipid composition (e.g., in erythrocytes). Thus, even a simple model of a lipid bilayer representing a human cell membrane should include cholesterol.
While vesicle fusion could be used to fabricate fluidic lipid bilayers containing only 10-15% cholesterol, the SALB method enables formation of fluidic lipid bilayers containing high fractions of cholesterol (up to 57 mol%, as quantified by QCM-D measurements)36. However, when the level of cholesterol was further elevated (up to 63 mol%), stripe-shape domains were observed37. The co-existing domains were liquid, reminiscent of those observed in the β region in the phase diagram of the cholesterol/phospholipids monolayer at the air-water interface.
Overall, the SALB method is shown to be a simple and efficient approach to form supported lipid bilayers, especially in cases beyond the scope of the conventional vesicle fusion method. Thus far, the QCM-D technique and fluorescence microscopy were mainly used to characterize the supported lipid bilayers formed by the SALB method. Looking forward, a broad range of surface-sensitive analytical measurements techniques, including surface plasmon resonance (SPR)38, atomic force microscopy (AFM)39,40, Fourier-transform infrared spectroscopy41, X-ray42 and neutron reflectivity43, can be used to further characterize and study simple and complex bilayer configurations prepare by the SALB method. These emerging capabilities open the door to a greater number of scientists who can explore artificial cell membranes by taking advantage of a simple and robust experimental protocol.
Disclosures
Loading...
$$\rightleftharpoonup{xx}$$
$$\longleftharp{xx}$$,
$$\longrightharp{xx}$$,
The authors have no competing financial interests to disclose.
Acknowledgements
Loading...
$$\rightleftharpoonup{xx}$$
$$\longleftharp{xx}$$,
$$\longrightharp{xx}$$,
The authors wish to acknowledge support from the National Research Foundation (NRF -NRFF2011-01 and NRF2015NRF-POC0001-19), the National Medical Research Council (NMRC/CBRG/0005/2012), and Nanyang Technological University to N.J.C.
Materials
| Name | Company | Catalog Number | Comments |
|---|---|---|---|
| QCM-D silicon dioxide-coated substrates | QSense AB, Sweden | ||
| QCM-D gold-coated substrates | QSense AB, Sweden | ||
| Q-Sense E4 module | QSense AB, Sweden | ||
| Plasma Cleaner, PDC-32G | Harrick Plasma, Ithaca, NY | PDC-001 (115V) | |
| 1,2-dioleoyl-sn-glycero-3-phosphocholine (DOPC) | Avanti Polar Lipids | 850375P | |
| 1,2-dioleoyl-sn-glycero-3-phosphoethanolamine-N-(lissamine rhodamine B sulfonyl) (ammonium salt) (Rh-PE) | Avanti Polar Lipids | 810150P | |
| cholesterol | Avanti Polar Lipids | 700000P | |
| Methyl-β-cyclodextrin | Sigma | C4555 | |
| Isopropanol | Sigma | 673773 | |
| Ethanol | Sigma | 459844 | |
| n-propanol | Sigma | 279544 | |
| Sticky-Slide I 0.1 Luer | IBIDI | 81128 | |
| Male elbow 1/8” | Cole-Parmer | 30505-70 | |
| Silicon tubing 1.6 mm ID | IBIDI | 10842 | |
| Glass coverslip No. 1.5H, 25 mm x 75 mm | IBIDI | 10812 | |
| Reglo Digital M2-2/12 Peristaltic Pump | Ismatec | ||
| Sodium dodecyl sulfate | Sigma | 71725 |
References
Loading...
$$\rightleftharpoonup{xx}$$
$$\longleftharp{xx}$$,
$$\longrightharp{xx}$$,
- Sackmann, E. Supported membranes: Scientific and practical applications. Science. 271, 43-48 (1996).
- Kraft, M. L., Weber, P. K., Longo, M. L., Hutcheon, I. D., Boxer, S. G. Phase separation of lipid membranes analyzed with high-resolution secondary ion mass spectrometry. Science. 313, 1948-1951 (2006).
- Kalb, E., Engel, J., Tamm, L. K. Binding of proteins to specific target sites in membranes measured by total internal reflection fluorescence microscopy. Biochemistry. 29, 1607-1613 (1990).
- Bally, M., et al. Norovirus GII. 4 Virus-like Particles Recognize Galactosylceramides in Domains of Planar Supported Lipid Bilayers. Angewandte Chemie International Edition. 51, 12020-12024 (2012).
- Bally, M., Graule, M., Parra, F., Larson, G., Höök, F. A virus biosensor with single virus-particle sensitivity based on fluorescent vesicle labels and equilibrium fluctuation analysis. Biointerphases. 8, 10-1186 (2013).
- Groves, J. T., Dustin, M. L. Supported planar bilayers in studies on immune cell adhesion and communication. Journal of Immunological Methods. 278, 10-1016 Forthcoming.
- Mager, M. D., Melosh, N. A. Lipid Bilayer Deposition and Patterning via Air Bubble Collapse. Langmuir. 23, 9369-9377 (2007).
- Lenhert, S., Sun, P., Wang, Y., Fuchs, H., Mirkin, C. A. Massively Parallel Dip-Pen Nanolithography of Heterogeneous Supported Phospholipid Multilayer Patterns. Small. 3, 71-75 (2007).
- Mennicke, U., Salditt, T. Preparation of solid-supported lipid bilayers by spin-coating. Langmuir. 18, 8172-8177 (2002).
- Tamm, L. K., McConnell, H. M. Supported phospholipid bilayers. Biophysical Journal. 47, 105-113 (1985).
- Kalb, E., Frey, S., Tamm, L. K. Formation of supported planar bilayers by fusion of vesicles to supported phospholipid monolayers. Biochim Biophys Acta. 1103, 307-316 (1992).
- Reimhult, E., Höök, F., Kasemo, B. Intact vesicle adsorption and supported biomembrane formation from vesicles in solution: influence of surface chemistry, vesicle size, temperature, and osmotic pressure. Langmuir. 19, 1681-1691 (2003).
- Cho, N. -J., Jackman, J. A., Liu, M., Frank, C. W. pH-Driven assembly of various supported lipid platforms: A comparative study on silicon oxide and titanium oxide. Langmuir. 27, 3739-3748 (2011).
- Boudard, S., Seantier, B., Breffa, C., Decher, G., Felix, O. Controlling the pathway of formation of supported lipid bilayers of DMPC by varying the sodium chloride concentration. Thin Solid Films. , 495-4246 (2006).
- Stanglmaier, S., et al. Asymmetric distribution of anionic phospholipids in supported lipid bilayers. Langmuir. 28, 10818-10821 (2012).
- Jackman, J. A., Choi, J. -H., Zhdanov, V. P., Cho, N. -J. Influence of osmotic pressure on adhesion of lipid vesicles to solid supports. Langmuir. 29, 11375-11384 (2013).
- Rossetti, F. F., Bally, M., Michel, R., Textor, M., Reviakine, I. Interactions between titanium dioxide and phosphatidyl serine-containing liposomes: formation and patterning of supported phospholipid bilayers on the surface of a medically relevant material. Langmuir. 21, 6443-6450 (1021).
- Cho, N. -J., Cho, S. -J., Cheong, K. H., Glenn, J. S., Frank, C. W. Employing an amphipathic viral peptide to create a lipid bilayer on Au and TiO2. Journal of the American Chemical Society. 129, 10050-10051 (2007).
- Hardy, G. J., et al. Biomimetic supported lipid bilayers with high cholesterol content formed by [small alpha]-helical peptide-induced vesicle fusion. Journal of Materials Chemistry. 22, 19506-19513 (2012).
- Wallin, M., Choi, J. -H., Kim, S. O., Cho, N. -J., Andersson, M. Peptide-induced formation of a tethered lipid bilayer membrane on mesoporous silica. European Biophysics Journal. , 1-10 (2014).
- Coutable, A., et al. Preparation of tethered-lipid bilayers on gold surfaces for the incorporation of integral membrane proteins synthesized by cell-free expression. Langmuir. 30, 3132-3141 (2014).
- Zan, G. H., Jackman, J. A., Cho, N. -J. AH peptide-mediated formation of charged planar lipid bilayers. The Journal of Physical Chemistry B. 118, 3616-3621 (2014).
- Jackman, J. A., Zhao, Z., Zhdanov, V. P., Frank, C. W., Cho, N. -J. Vesicle adhesion and rupture on silicon oxide: Influence of freeze–thaw pretreatment. Langmuir. 30, 2152-2160 (2014).
- Tabaei, S. R., Choi, J. -H., Haw Zan,, Zhdanov, G., P, V., Cho, N. -J. Solvent-Assisted Lipid Bilayer Formation on Silicon Dioxide and Gold. Langmuir. 30, 10363-10373 (2014).
- Hohner, A., David, M., Rädlera, J. Controlled solvent-exchange deposition of phospholipid membranes onto solid surfaces. Biointerphases. 5, 1-8 (2010).
- Tabaei, S. R., Jackman, J. A., Kim, S. -O., Zhdanov, V. P., Cho, N. -J. Solvent-Assisted Lipid Self-Assembly at Hydrophilic Surfaces: Factors Influencing the Formation of Supported Membranes. Langmuir. 31, 3125-3134 (2015).
- Tabaei, S. R., Vafaei, S., Cho, N. -J. Fabrication of Charged Membranes by the Solvent-Assisted Lipid Bilayer (SALB) Formation. Method on SiO2 and Al2O3. Physical Chemistry Chemical Physics., doi:10.1039/C5CP01428J. , (2015).
- Jackman, J. A., Tabaei, S. R., Zhao, Z., Yorulmaz, S., Cho, N. -J. Self-Assembly Formation of Lipid Bilayer. Coatings on Bare Aluminum Oxide: Overcoming the Force of Interfacial Water. ACS Applied Materials & Interfaces. 7, 959-968 (2015).
- Keller, C., Kasemo, B. Surface specific kinetics of lipid vesicle adsorption measured with a quartz crystal microbalance. Biophysical Journal. 75, 1397-1402 (1998).
- Sundh, M., Svedhem, S., Sutherland, D. S. Influence of phase separating lipids on supported lipid bilayer formation at SiO2 surfaces. Physical Chemistry Chemical Physics. 12, 453-460 (2010).
- Cho, N. -J., Frank, C. W., Kasemo, B., Höök, F. Quartz crystal microbalance with dissipation monitoring of supported lipid bilayers on various substrates. Nature Protocols. 5, 1096-1106 (2010).
- Beseničar, M. P., Bavdek, A., Kladnik, A., Maček, P., Anderluh, G. Kinetics of cholesterol extraction from lipid membranes by methyl-β-cyclodextrin—A surface plasmon resonance approach. Biochimica et Biophysica Acta (BBA) - Biomembranes. 1778, 175-184 (2008).
- Pedersen, S., Jørgensen, K., Baekmark, T. R., Mouritsen, O. G. Indirect evidence for lipid-domain formation in the transition region of phospholipid bilayers by two-probe fluorescence energy transfer. Biophysical journal. 71, 554-560 (1996).
- Okonogi, T., McConnell, H. Contrast inversion in the epifluorescence of cholesterol-phospholipid monolayers. Biophysical Journal. 86, 880-890 (2004).
- McConnell, H. M., Radhakrishnan, A. Condensed complexes of cholesterol and phospholipids. Biochimica et Biophysica Acta (BBA)-Biomembranes. 1610, 159-173 (2003).
- Tabaei, S. R., et al. Formation of Cholesterol-Rich Supported Membranes Using Solvent-Assisted Lipid Self-Assembly. Langmuir. 30, 13345-13352 (2014).
- Tabaei, S. R., Jackman, J. A., Liedberg, B., Parikh, A. N., Cho, N. -J. Observation of Stripe Superstructure in the β-Two-Phase Coexistence Region of Cholesterol–Phospholipid Mixtures in Supported Membranes. Journal of the American Chemical Society. 136, 16962-16965 (2014).
- Salamon, Z., Wang, Y., Tollin, G., Macleod, H. A. Assembly and molecular organization of self-assembled lipid bilayers on solid substrates monitored by surface plasmon resonance spectroscopy. Biochimica et Biophysica Acta (BBA)-Biomembranes. , 1195-11267 (1994).
- Yuan, C., Johnston, L. Phase evolution in cholesterol/DPPC monolayers: atomic force microscopy and near field scanning optical microscopy studies. Journal of microscopy. 205, 136-146 (2002).
- Schneider, J., Dufrêne, Y. F., Barger, W. R. Jr, Lee, G. U. Atomic force microscope image contrast mechanisms on supported lipid bilayers. Biophysical Journal. 79, 1107-1118 (2000).
- Tamm, L. K., Tatulian, S. A. Infrared spectroscopy of proteins and peptides in lipid bilayers. Quarterly reviews of biophysics. 30, 365-429 (1997).
- Miller, C. E., Majewski, J., Gog, T., Kuhl, T. L. Characterization of biological thin films at the solid-liquid interface by X-ray reflectivity. Physical Review Letters. 94, 238104(2005).
- Koenig, B. W., et al. Neutron reflectivity and atomic force microscopy studies of a lipid bilayer in water adsorbed to the surface of a silicon single crystal. Langmuir. 12, 1343-1350 (1996).
Reprints and Permissions
Request permission to reuse the text or figures of this JoVE article
Request Permission